

Migration Map 2025: Top 100 Countries by Share
Compare 100 countries by the share of residents born abroad, from migrant-majority Gulf states to countries with relatively low foreign-born

Compare 100 countries by the share of residents born abroad, from migrant-majority Gulf states to countries with relatively low foreign-born

Compare official real wage growth across countries from 2020 to 2025, showing where wages beat inflation using OECD and ILO

Top 100 countries by trade openness using World Bank trade (% of GDP) data for 2023. A 2025 analytical snapshot
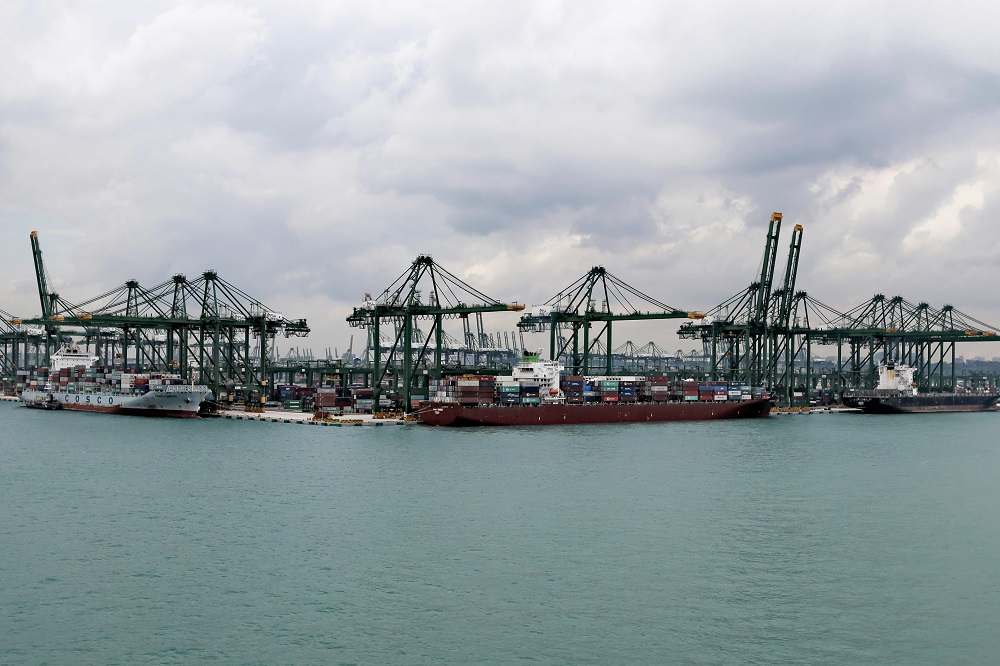
Compare the leading merchandise exporting and importing countries using 2024 WTO and UN trade data, current US dollar values and

Compare countries by the latest available Gini coefficient, a 0–100 measure of income inequality, with source years, definitions and methodology

Compare 100 economies by household disposable income per person in PPP terms, with source years, after-tax income context and methodology

Compare economies by GDP per capita adjusted for purchasing power parity using the latest World Bank WDI data available for

Compare OECD countries by annual medical graduates per 100,000 residents, a measure of the medical training pipeline, with source and

Compare countries by their highest annual reported measles incidence from 2015–2025 using WHO data, measured as cases per 1 million

Compare countries with the lowest youth NEET rates for ages 15–24, measuring the share not in employment, education or training

Ranked table of remittance inflows per person (USD). See the top 10 countries, compare values, and understand what “per capita”

Which economies rely most on ICT services exports? Ranked top 10 table showing ICT services exports as a share of

See which countries lead in digital payment use based on the latest official data. Compare cash-light markets, payment habits, and

Compare countries by B2C e-commerce sales per capita, a population-adjusted measure of online retail intensity, with sources and methodology notes.

Compare countries by electricity supply reliability using SAIDI outage minutes per customer-year, with regulator source years and methodology notes.

Compare national public infrastructure quality using a transparent 2025 comparative framework, with metric limitations, source definitions and methodology.

Compare countries by transport-related CO₂ emissions per person, isolating mobility emissions from power, industry and buildings with methodology notes.

Compare countries with the highest adult obesity prevalence using the latest WHO snapshot, based on BMI 30+ prevalence with methodology

Which countries have the most adults living with diabetes? Compare the Top 10 by absolute diabetes population in 2024, plus

Compare the largest merchandise trade deficits using mainly 2024 goods trade balances in current US dollars, compiled from ITC and

Compare major-city housing price-to-income ratios across countries in the 2024–2025 snapshot, a quick measure of home affordability pressure.

Compare countries with the highest official core inflation at the end of 2025, focusing on underlying price pressure beyond volatile

Compare countries with the largest 2025 general government budget deficits as a share of GDP using IMF World Economic Outlook

Compare countries by the latest available share of pre-tax income received by the richest 1%, using 2024 WID/OWID data in

Compare 20 countries by cumulative real wage growth from 2020 to 2025, adjusting nominal wage gains for inflation to track

Compare countries by median disposable household income in PPP terms using the latest widely comparable data, with methodology and source
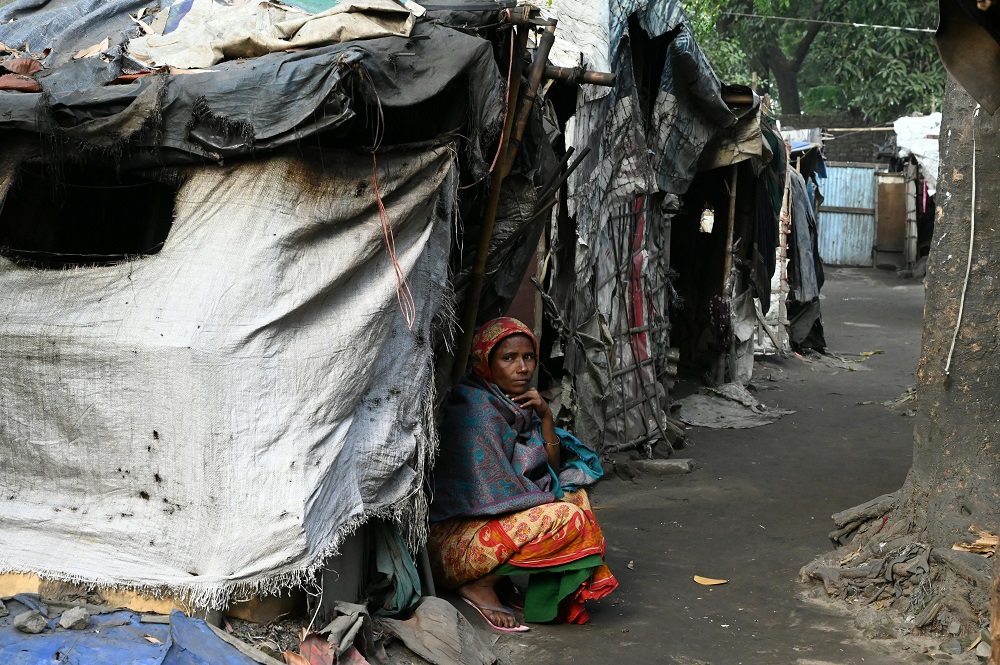
Explore the lowest GDP per capita PPP economies in the 2025 IMF snapshot, with context on fragility, conflict, data gaps

Get Excel and CSV data packs used in published StatRanker research, with source and methodology notes where available.
Browse Data Packs →Publisher details: site managed since 28 August 2025; private entrepreneur, registration code 133276738020, Ukraine. Technical infrastructure is located in the United States; CDN edge locations may be used internationally.