


Top 100 Countries by Central Bank Policy Interest
Economy · Macroeconomics · Dec 2025 snapshot Central bank policy rates show where monetary pressure was still highest at the

Economy · Macroeconomics · Dec 2025 snapshot Central bank policy rates show where monetary pressure was still highest at the

Foreign trade · Mobility, transport and vehicles Automotive Import Markets Ranked by Trade Value This ranking compares countries by the

Per-capita registrations • Demand intensity vs ownership base Per-capita registrations and demand intensity vs ownership base New passenger car registrations

Why “more renewables” can fail to translate into “more usable clean electricity” A common reader assumption is simple: if wind

Installed capacity is a “potential” measure — output is the “realized” measure A common reading mistake in energy statistics is

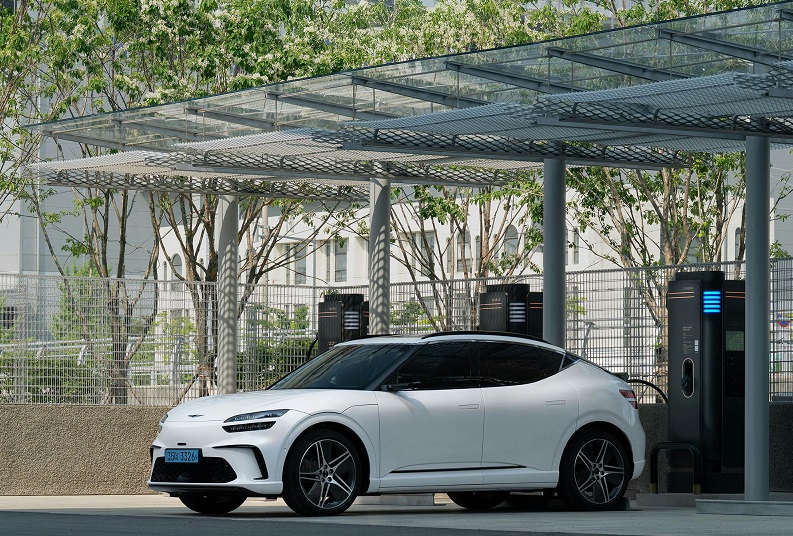
Charging infrastructure as the binding constraint Many readers assume EV adoption is primarily a demand story: if consumers want EVs

Why “EV sales are booming” can coexist with a slow-moving EV share of the car fleet A common misunderstanding in

A common reader assumption is straightforward: if wages rise, people must be better off. In country data, this intuition often

Economy · Macroeconomics · Measurement by admin · December 22, 2025 · ~20 min read Why “GDP” comparisons break in
Why nominal GDP and PPP are often confused Many readers treat “GDP” as a single, universal yardstick of economic size.

Category: Data Methodology · Totals vs per-capita, scaling effects, denominator mechanics Problem framing: why totals and per-capita views often “disagree”

A common reader expectation is simple: “If GDP, inflation, or public debt are measured for the same country and year,

Data Methodology • Stock vs Flow Why “visible change” often fails to move country comparisons Many readers expect country comparisons
Mobility · EV infrastructure This page ranks public EV charging availability against the size of the electric passenger-car fleet. It
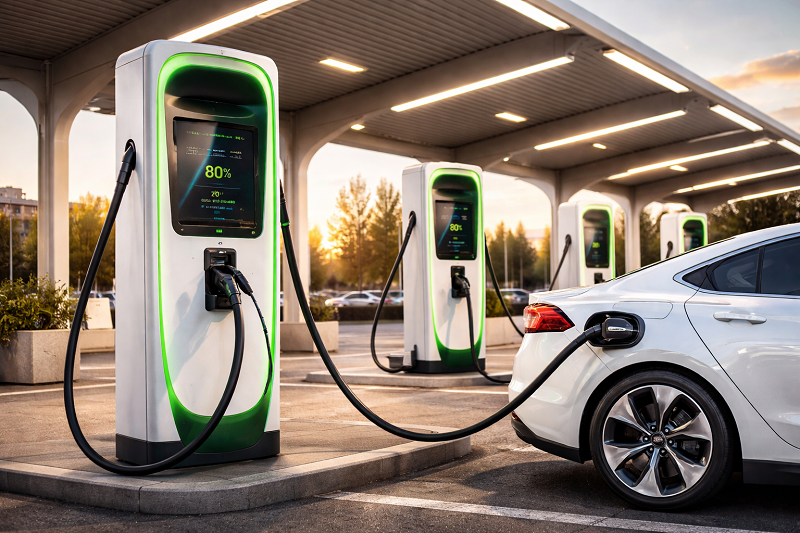
Mobility · EV infrastructure · Public charging Public EV Charging Density by Country: 2025 Comparison Updated: April 27, 2026 Public

USGS data February 2026 · Mineral Commodity Summaries 2026 Phosphate Rock Mine Production by Country: 2025 USGS Ranking China produced

Uranium mining · country output · 2026 snapshot Which countries mine the most uranium? Kazakhstan is the largest uranium mining

Mining · aluminium value chain · 2025 edition Bauxite mine production and aluminium raw-material supply This ranking compares countries by
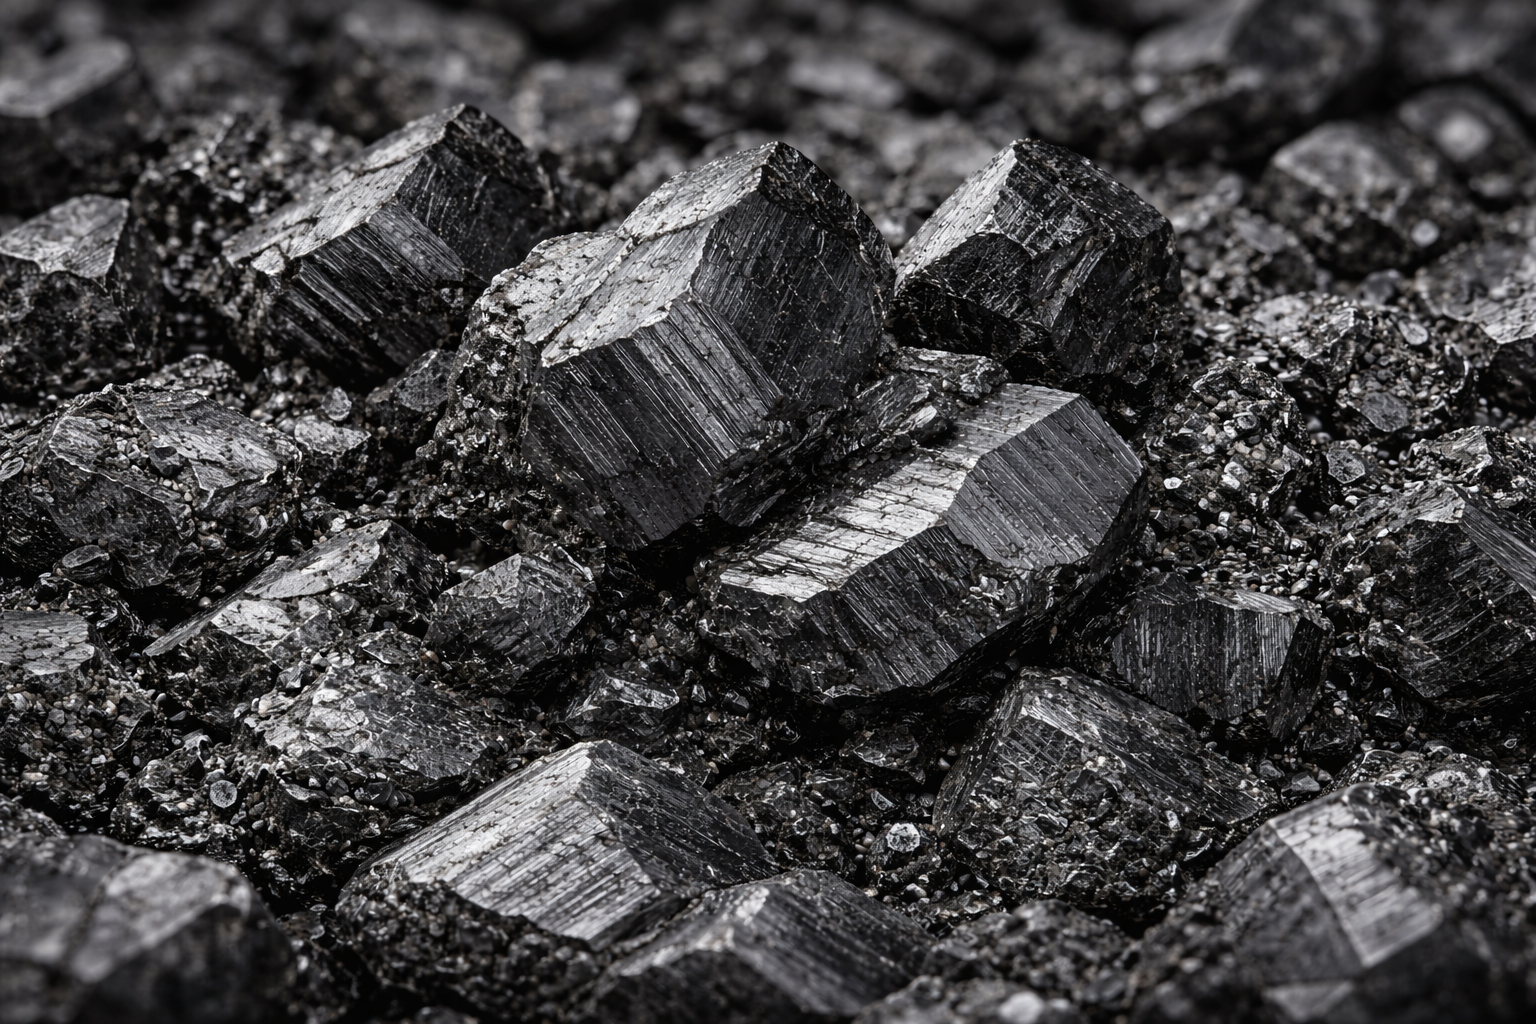
This ranking summarizes natural graphite mine output by country using the latest USGS 2024e estimates. Values are shown in kilotons

Cobalt Mine Production Leaders in the 2025 USGS Snapshot Updated: April 29, 2026 · Data year: 2025e · Primary source:

Nickel · mine production Data year: 2023 Unit: thousand tonnes of Ni metal content (kt) Source: BGS World Mineral Production
Critical minerals · lithium · 2024 data Lithium production leaders by Li content, 2024 snapshot The table ranks countries by

Resources & Critical Minerals · Mine Production A comparative overview of global copper mine output by country, with concentration analysis,

Updated: April 24, 2026 · Data year: 2024 Commercial vehicle registrations and sales by country, 2024: largest markets ranked Commercial

Economy · Demography · Migration Which countries have the highest share of residents born abroad? This ranking maps the full

Labour market · Wages · Inflation-adjusted pay Where wages actually beat inflation in the official comparable data Real wage growth
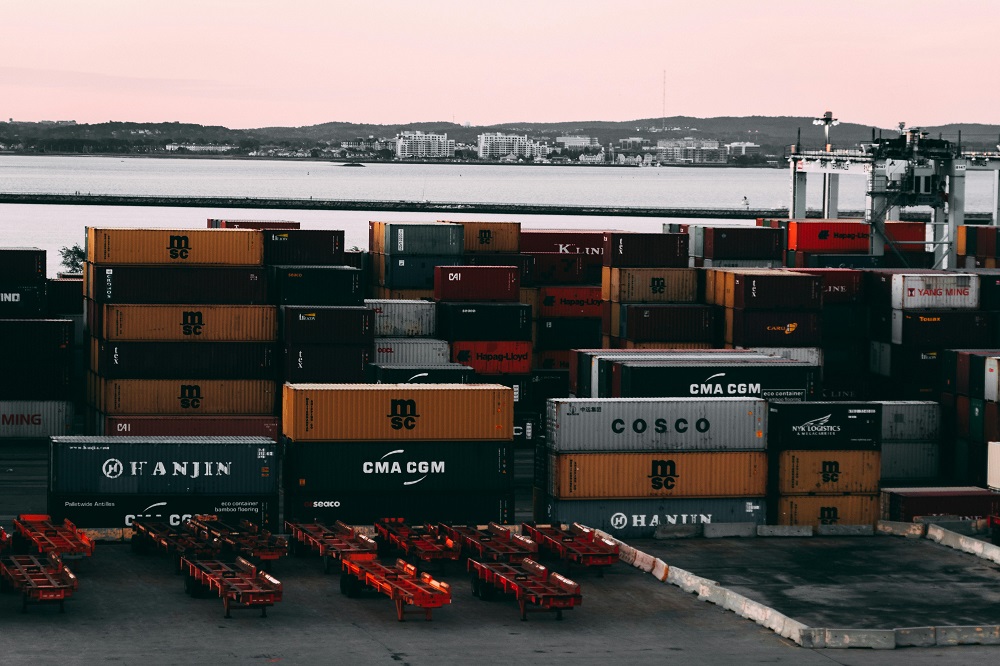
Economy · Foreign Trade · 2025 analytical snapshot How trade openness is measured and which economies actually lead the latest
