


Countries by Currency Depreciation vs USD (YoY) —
Global FX · Weakest currencies vs USD · Latest Feb 2026 snapshot Weakest Currencies Against the U.S. Dollar: Biggest Year-over-Year
Global FX · Weakest currencies vs USD · Latest Feb 2026 snapshot Weakest Currencies Against the U.S. Dollar: Biggest Year-over-Year
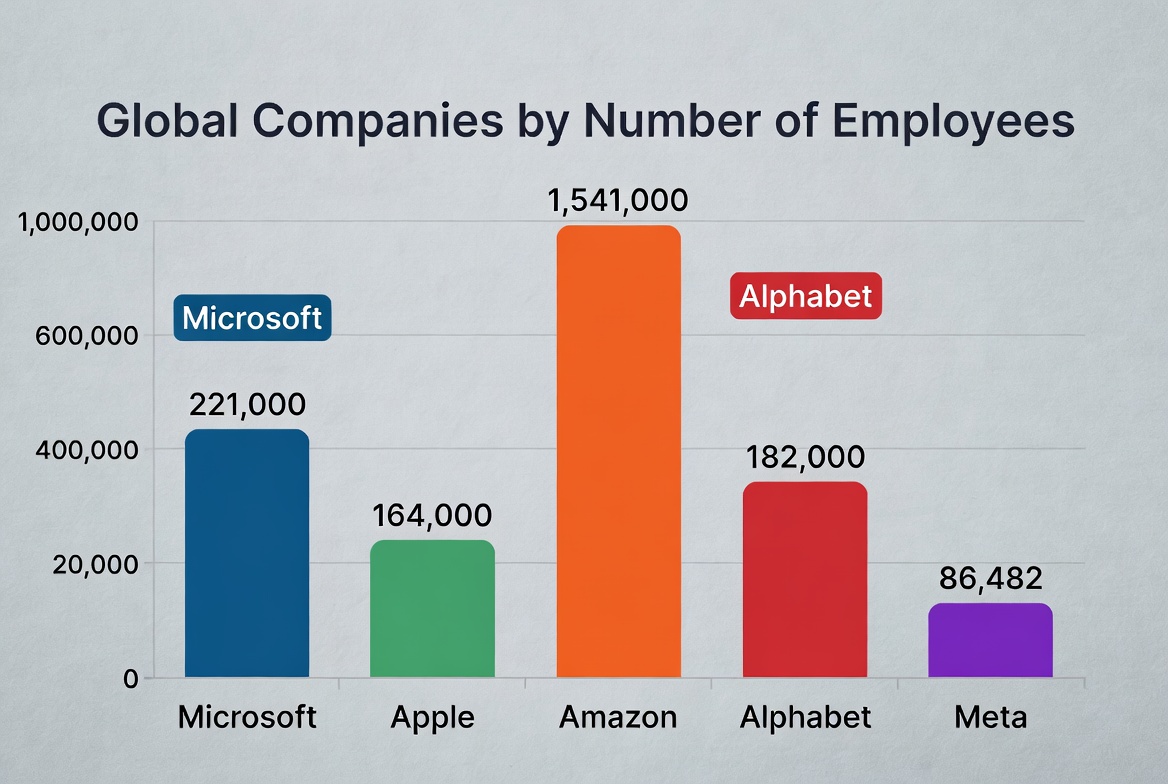
Largest employers • global public-company snapshot Employee headcount is a pure scale signal. It captures operating footprint, service capacity, and
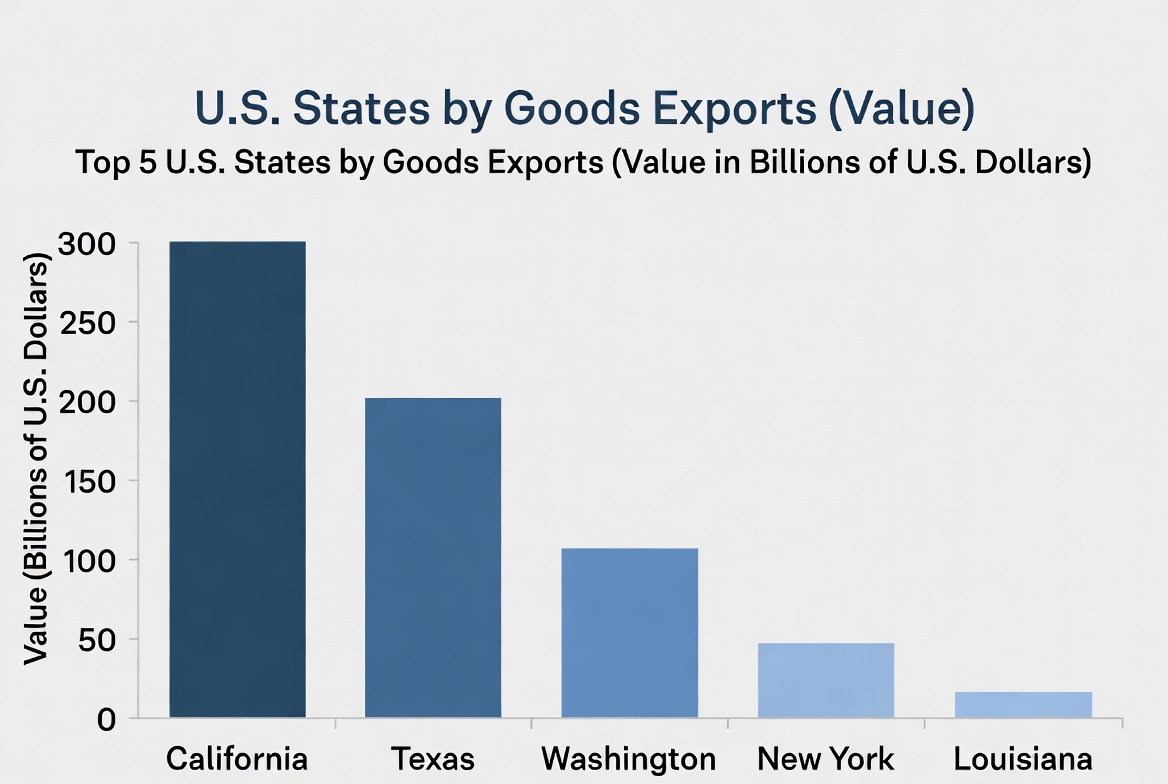
Ranking • State trade Metric: Goods exports (origin of movement) Latest full year in this snapshot: 2024 Units: USD billions (nominal) Updated: 2026-02-05 Where U.S. goods
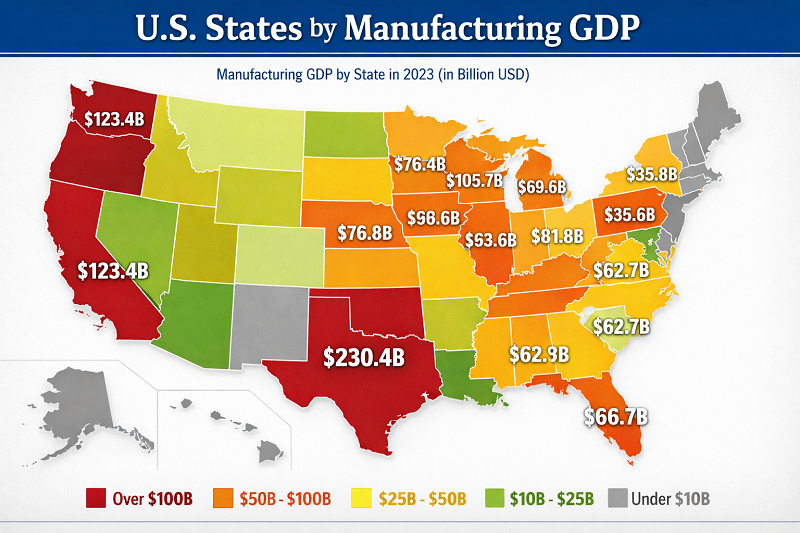
Ranking • Production focus Manufacturing GDP by state: where real output is concentrated (latest year: 2024) Metric: Manufacturing GDP (NAICS
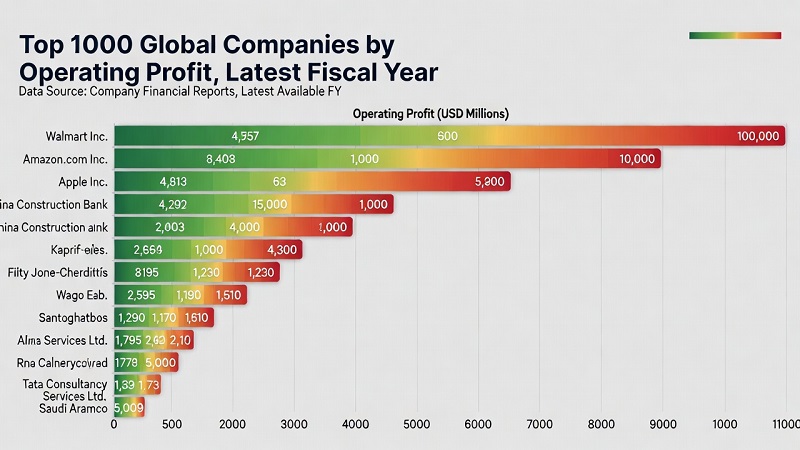
Most profitable companies • Operating profit (EBIT-style) • Latest FY in Scoreboard dataset • Updated: 2026-01-29 This ranking orders the
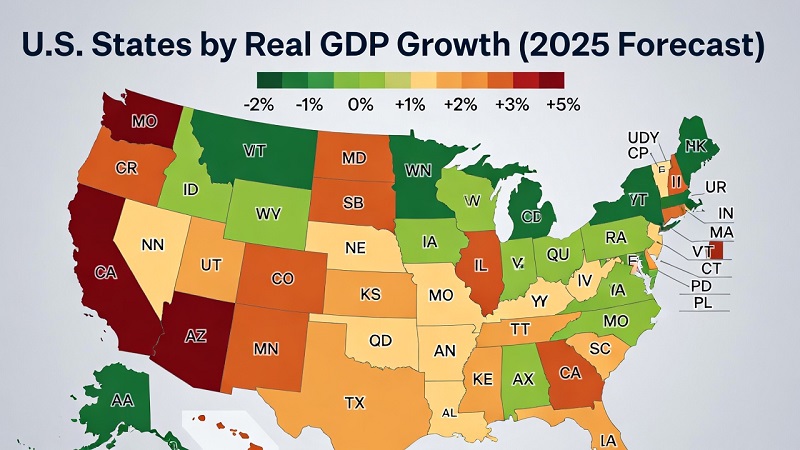
BEA • Real GDP (chained dollars) Quarterly Percent change at annual rate (SAAR) Revisions possible Last updated: January 28, 2026
Disclaimer. This page is for educational use only and is not investment, financial, legal, or tax advice. Markets are volatile,
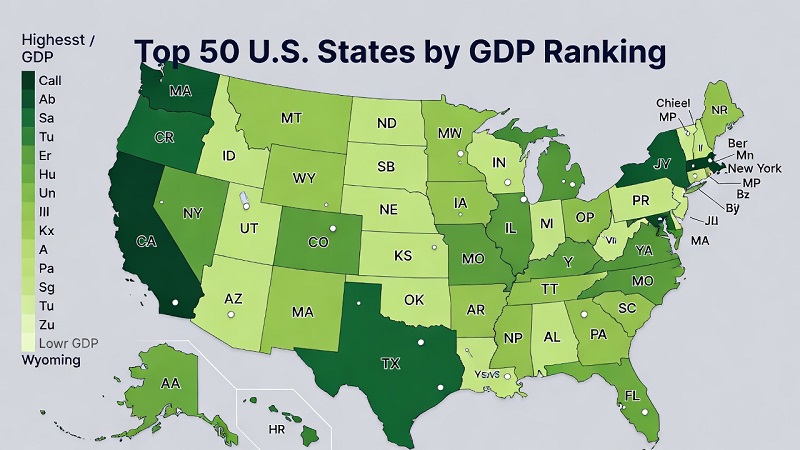
Economy · 2026 Update (2024 preliminary data) This ranking uses current-dollar (nominal) gross domestic product by state from the U.S.

Largest car markets • Unit-based market size • Country ranking New vehicle sales by market provide a consistent unit-based view

Economy · Wages and incomes of the population Updated: January 18, 2026 Metric: median household income Scope: 50 states (excludes

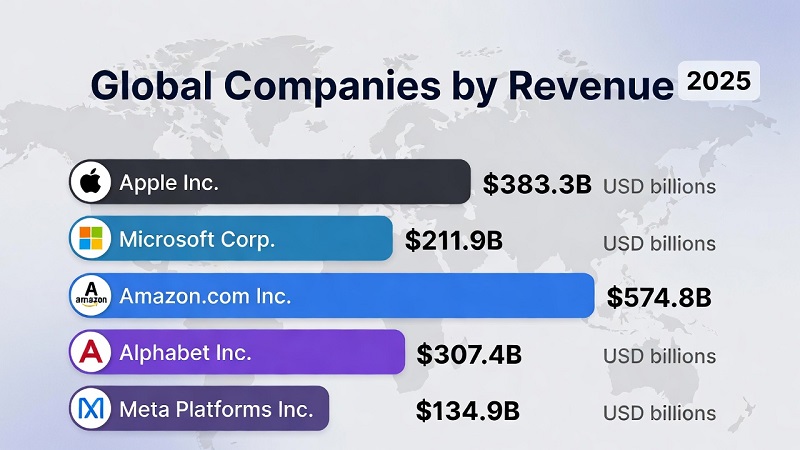
Macroeconomics · nominal GDP · IMF WEO October 2025 snapshot Last updated: April 30, 2026 Largest economies in 2025 by

Environment & Resources · Energy & EV Analysis “Per capita” CO₂ is one of the fastest ways to understand how

Economy & Living Standards · Wages & incomes Data refresh: loading… People often google “median household income by country” expecting

Economy & Living Standards · Poverty rate ranking Poverty Rate Ranking: What the Latest International Data Shows Updated: April 27,

Higher education · international students · 2026 snapshot Universities with the Highest Share of International Students: THE 2026 Profile Data

Economy · Budget and taxes · 2025 IMF WEO snapshot Countries by Government Debt-to-GDP Ratio: 2025 IMF WEO Snapshot This

Updated: April 14, 2026 Source snapshot: Numbeo city ranking Unit: USD/month, after tax The ranking below is built from the

Real wage growth by country, 2020–2025 Real wage growth compares pay growth with consumer-price inflation. A positive value means average

Minimum wages • Real PPP • OECD comparison OECD Minimum Wage Purchasing Power Ranking, 2024 Updated: April 27, 2026 ·

Wages in PPP terms: official benchmark data and how to read it correctly PPP-adjusted wage data help compare what pay

Updated April 16, 2026 · 2025 CPI snapshot Food Inflation by Country: 2025 Snapshot Food inflation is the year-over-year change

Inflation and Prices · Household Energy Countries with the highest residential natural gas prices in 2025 Residential natural gas prices
Household electricity prices · USD/kWh · 2026 snapshot Global Household Electricity Price Benchmark: 2026 Snapshot This ranking compares household electricity

Economy · Macroeconomics · Growth Updated: April 29, 2026 Fastest-growing economies by real GDP growth in 2025 Real GDP growth

Global Labour Market • Youth unemployment Youth Unemployment Ranking: What the 2025 Data Shows About Young Jobseekers Updated: April 27,

IMF DataMapper · unemployment rate · 2025 Highest unemployment rates in the IMF 2025 labour-market snapshot The ranking compares unemployment

Real Interest Rate Ranking, 2025 Snapshot Real interest rate measures the cost of borrowing after inflation is taken into account.
