

Top 100 Countries by International Tourist Arrivals, 2025
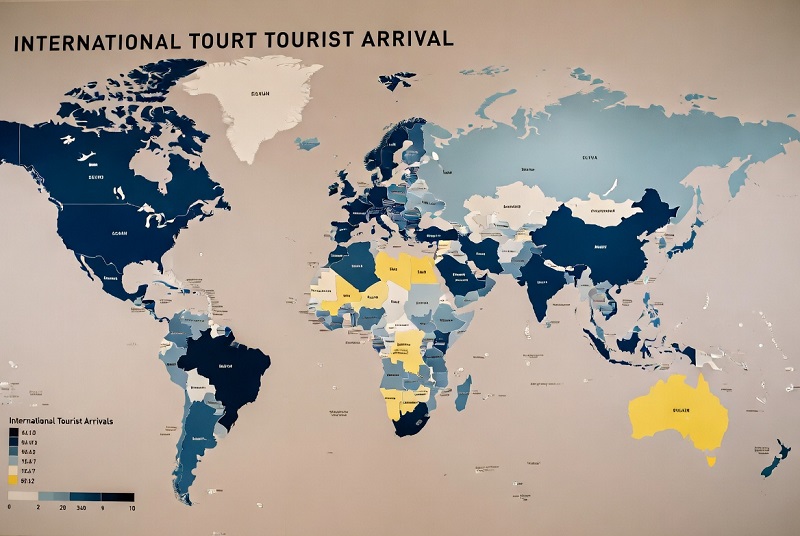
Top countries by international tourist arrivals
International tourist arrivals measure inbound overnight trips made by non-resident visitors. The indicator shows the operating scale of a destination system: how many cross-border visitor trips a country can attract, admit, move, accommodate, and serve during a year. It is a volume measure, not a revenue, profitability, quality-of-life, or destination-quality score.
The ranking uses the World Bank WDI tourism-arrivals indicator, sourced to UN Tourism. The global 2025 context reflects the sector’s full recovery to an estimated 1.52 billion international tourist arrivals, while the country rows use the latest broad comparable WDI ranking basis available for this indicator. Many country values in this table come from the 2020 WDI snapshot, so the ranking should not be read as a final 2025 country-by-country league table.
Values are trip counts, not unique people. A frequent traveler can be counted more than once, and national reporting systems may rely on border records, surveys, accommodation data, or mixed methods. This is why arrivals are best used to compare scale and pressure, not overall tourism value.
Continue exploring
More StatRanker pages connected by topic, category or ranking theme.
France combines city tourism, leisure travel, repeat European trips, dense access, and a broad year-round destination mix.
The value is measured as arrivals, not unique people. A visitor entering more than once can appear more than once in annual arrival counts.
Share values are calculated against the 123-entry comparable country set used here. They should not be read as exact live global market shares.
Arrivals show inbound volume. They do not show tourism receipts, average spend, length of stay, seasonality, or net economic benefit.
What the top of the ranking shows
The top group is dominated by destinations with large nearby source markets, strong transport access, mature tourism infrastructure, and repeated short-haul flows. Europe is overrepresented because border density and regional mobility lift trip counts. Mexico and the United States show the importance of North American proximity and huge source-market demand, while China remains a large multi-purpose destination system even when travel cycles shift.
Several countries look higher than casual readers might expect because arrivals reward accessibility and repeat movement, not only destination fame. Hungary, Croatia, Denmark, and Andorra are examples where cross-border movement, compact geography, seasonal leisure demand, and regional short trips can push totals upward.
Top 10 destination cards
117,109,000 arrivals
Large leisure, city, cultural, rail, and short-haul flows keep France clearly ahead of the rest of the ranking.
51,128,000 arrivals
Mexico benefits from U.S. proximity, resort corridors, land-border travel, and strong North American air access.
45,037,000 arrivals
The United States combines business travel, visiting friends and relatives, gateway cities, and broad long-haul access.
38,419,000 arrivals
Italy’s position reflects cultural tourism, city demand, coastal travel, and repeat European trips.
36,410,000 arrivals
Spain combines beaches, islands, city tourism, second-home travel, and short-haul European demand.
31,641,000 arrivals
Hungary’s high place reflects the power of regional and cross-border movements in arrivals statistics.
30,402,000 arrivals
China is a large destination system with business, urban, family, and multi-purpose inbound travel.
21,608,000 arrivals
Croatia shows tourism intensity: a smaller country can rank high with strong feeder markets and seasonal leisure appeal.
15,971,000 arrivals
Turkey combines coastal resorts, Istanbul city travel, regional access, and long-haul visitor demand.
15,595,000 arrivals
Denmark’s compact geography and neighboring-market flows help it appear high in trip-count data.
Ranking table: top countries by international tourist arrivals
Use the controls to search countries, change the sort order, filter by region, or switch between the Top 10, Top 20, Top 50, and the full Top 100 view. The default Top 20 view is designed for quick reading; the full table remains present in the page markup.
| Rank | Name | Arrivals | Share |
|---|---|---|---|
| 1 | France | 117,109,000 | 19.29% |
| 2 | Mexico | 51,128,000 | 8.42% |
| 3 | United States | 45,037,000 | 7.42% |
| 4 | Italy | 38,419,000 | 6.33% |
| 5 | Spain | 36,410,000 | 6.00% |
| 6 | Hungary | 31,641,000 | 5.21% |
| 7 | China | 30,402,000 | 5.01% |
| 8 | Croatia | 21,608,000 | 3.56% |
| 9 | Turkey | 15,971,000 | 2.63% |
| 10 | Denmark | 15,595,000 | 2.57% |
| 11 | Austria | 15,091,000 | 2.49% |
| 12 | Germany | 12,449,000 | 2.05% |
| 13 | United Kingdom | 11,101,000 | 1.83% |
| 14 | United Arab Emirates | 8,084,000 | 1.33% |
| 15 | Greece | 7,406,000 | 1.22% |
| 16 | Netherlands | 7,265,000 | 1.20% |
| 17 | Russia | 6,359,000 | 1.05% |
| 18 | Macao SAR (China) | 5,897,000 | 0.97% |
| 19 | Andorra | 5,207,000 | 0.86% |
| 20 | Romania | 5,023,000 | 0.83% |
| 21 | Bulgaria | 4,973,000 | 0.82% |
| 22 | Malaysia | 4,333,000 | 0.71% |
| 23 | Portugal | 4,208,000 | 0.69% |
| 24 | Japan | 4,116,000 | 0.68% |
| 25 | Indonesia | 4,053,000 | 0.67% |
| 26 | South Africa | 3,887,000 | 0.64% |
| 27 | Puerto Rico | 3,882,000 | 0.64% |
| 28 | Vietnam | 3,837,000 | 0.63% |
| 29 | Belarus | 3,598,000 | 0.59% |
| 30 | Hong Kong SAR (China) | 3,569,000 | 0.59% |
| 31 | Ukraine | 3,382,000 | 0.56% |
| 32 | Latvia | 3,204,000 | 0.53% |
| 33 | Morocco | 2,802,000 | 0.46% |
| 34 | Dominican Republic | 2,748,000 | 0.45% |
| 35 | Singapore | 2,742,000 | 0.45% |
| 36 | Albania | 2,658,000 | 0.44% |
| 37 | Belgium | 2,584,000 | 0.43% |
| 38 | South Korea | 2,519,000 | 0.42% |
| 39 | Lithuania | 2,284,000 | 0.38% |
| 40 | Kuwait | 2,161,000 | 0.36% |
| 41 | Kazakhstan | 2,035,000 | 0.34% |
| 42 | Tunisia | 2,012,000 | 0.33% |
| 43 | Sweden | 1,957,000 | 0.32% |
| 44 | Bahrain | 1,909,000 | 0.31% |
| 45 | Australia | 1,828,000 | 0.30% |
| 46 | Bahamas | 1,795,000 | 0.30% |
| 47 | Estonia | 1,695,000 | 0.28% |
| 48 | Iran | 1,550,000 | 0.26% |
| 49 | Georgia | 1,513,000 | 0.25% |
| 50 | Philippines | 1,483,000 | 0.24% |
| 51 | Norway | 1,397,000 | 0.23% |
| 52 | Colombia | 1,396,000 | 0.23% |
| 53 | Jamaica | 1,330,000 | 0.22% |
| 54 | Cambodia | 1,306,000 | 0.22% |
| 55 | Jordan | 1,240,000 | 0.20% |
| 56 | Slovenia | 1,216,000 | 0.20% |
| 57 | Costa Rica | 1,147,000 | 0.19% |
| 58 | Peru | 1,119,000 | 0.18% |
| 59 | Paraguay | 1,077,000 | 0.18% |
| 60 | Brunei | 1,071,000 | 0.18% |
| 61 | New Zealand | 996,000 | 0.16% |
| 62 | Myanmar | 903,000 | 0.15% |
| 63 | Finland | 896,000 | 0.15% |
| 64 | Laos | 886,000 | 0.15% |
| 65 | Oman | 869,000 | 0.14% |
| 66 | Azerbaijan | 796,000 | 0.13% |
| 67 | Malta | 718,000 | 0.12% |
| 68 | El Salvador | 707,000 | 0.12% |
| 69 | Honduras | 669,000 | 0.11% |
| 70 | Côte d’Ivoire | 668,000 | 0.11% |
| 71 | Panama | 647,000 | 0.11% |
| 72 | Zimbabwe | 639,000 | 0.11% |
| 73 | Guatemala | 594,000 | 0.10% |
| 74 | Algeria | 591,000 | 0.10% |
| 75 | Qatar | 582,000 | 0.10% |
| 76 | Maldives | 555,000 | 0.09% |
| 77 | Sri Lanka | 540,000 | 0.09% |
| 78 | Luxembourg | 525,000 | 0.09% |
| 79 | Ethiopia | 518,000 | 0.09% |
| 80 | Zambia | 502,000 | 0.08% |
| 81 | Iceland | 488,000 | 0.08% |
| 82 | Belize | 487,000 | 0.08% |
| 83 | Togo | 482,000 | 0.08% |
| 84 | Nicaragua | 474,000 | 0.08% |
| 85 | Uganda | 473,000 | 0.08% |
| 86 | Serbia | 446,000 | 0.07% |
| 87 | Saint Lucia | 433,000 | 0.07% |
| 88 | Antigua and Barbuda | 385,000 | 0.06% |
| 89 | Armenia | 375,000 | 0.06% |
| 90 | Montenegro | 351,000 | 0.06% |
| 91 | Eswatini | 345,000 | 0.06% |
| 92 | Bolivia | 323,000 | 0.05% |
| 93 | Mauritius | 316,000 | 0.05% |
| 94 | Gambia | 246,000 | 0.04% |
| 95 | Nepal | 230,000 | 0.04% |
| 96 | Grenada | 217,000 | 0.04% |
| 97 | Bosnia and Herzegovina | 197,000 | 0.03% |
| 98 | Namibia | 187,000 | 0.03% |
| 99 | Cabo Verde | 180,000 | 0.03% |
| 100 | Fiji | 168,000 | 0.03% |
No matching rows. Clear the search field or choose another region.
Updated: April 29, 2026. Source basis: World Bank World Development Indicators series ST.INT.ARVL, sourced to UN Tourism. Values are rounded to whole arrivals; shares are rounded to two decimals. Share denominator for this table: 606,973,000 arrivals across the comparable country set. Country rows reflect the latest broad comparable WDI ranking basis used here; many values are from the 2020 WDI snapshot.
Charts
The visual blocks highlight the steep concentration at the top of the arrivals ranking and the long tail across smaller inbound tourism markets.
Chart 1. Top 20 by arrivals
The bar chart shows a steep head: France is more than twice Mexico’s value and more than seven times the tenth-ranked country’s value.
Chart 2. Rank-band distribution
France sits alone at the top of the scale, showing how concentrated the first position is.
The next four countries are still very large destination systems, but none is close to France by raw arrivals.
This band includes regional hubs and high-intensity tourism economies with strong repeat or short-haul flows.
The second ten remains substantial, but the values are already far below the leaders.
The middle of the ranking is made of important national and regional tourism markets rather than global volume leaders.
The lower half is a long tail: often locally important, but small in global arrivals share.
The distribution has one extreme leader, a compact top group, and a long tail of smaller inbound markets.
Methodology
The indicator used in the ranking is international tourism arrivals. In the World Bank WDI framework, the relevant series is commonly identified as ST.INT.ARVL and is sourced to UN Tourism. It counts international inbound tourists, or overnight visitors, who travel to a country other than their usual residence for a period not exceeding 12 months and whose main purpose is not being paid from within the visited economy.
The country ladder is based on the latest broad comparable public WDI ranking basis available for this arrivals series. UN Tourism’s 2025 reporting provides current global context, including the recovery of international tourism to about 1.52 billion arrivals worldwide. Country-level rows are treated as a comparable arrivals snapshot because official national updates do not appear at the same speed across all destinations, many WDI country entries still point to the 2020 benchmark for this series, and national tourism statistics can be revised after first release.
Values are rounded to whole arrivals in the table and to one decimal million in the charts. Shares are calculated against the 123-entry comparable country set behind the ranking and rounded to two decimal places. Region labels are used only for filtering and do not alter the ranking values. The Top 100 table presents the first 100 rows from that broader comparable set. The article was last reviewed and updated on April 29, 2026.
The main limitations are measurement differences, border-counting practices, transit treatment, same-person repeat entries, different national data sources, and the gap between volume and value. Arrivals can overstate the economic importance of low-spend short trips and understate destinations that receive fewer visitors but generate higher receipts per visitor. They can also make land-border and short-haul destinations look larger than long-haul island destinations with high spending per stay. This ranking is therefore not a quality ranking, revenue ranking, safety ranking, affordability ranking, or recommendation list.
Insights
The upper part of the ranking is shaped by access, repetition, and capacity. France, Mexico, the United States, Italy, and Spain are not merely famous destinations; they are large travel systems connected to major source markets. Their rankings reflect airports, land borders, rail corridors, accommodation networks, brand depth, source-market diversity, and the ability to convert repeat travel into high annual trip counts.
The middle of the table includes many countries where tourism is economically meaningful but not globally dominant by raw volume. Morocco, the Dominican Republic, Singapore, Albania, Belgium, South Korea, and Lithuania illustrate different models: leisure resorts, city-break markets, hub travel, diaspora travel, regional conferences, and route-network effects. Their positions often reflect focused demand rather than broad global dominance.
The lower part of the Top 100 still matters. Countries near ranks 70–100 can be important for regional tourism, ecological travel, island economies, business corridors, or emerging destination development. Their lower global share does not mean tourism is unimportant domestically; it means their inbound volume is smaller within this ranking. For several small economies, even a few hundred thousand arrivals can be large relative to population, accommodation stock, infrastructure, and protected natural areas.
What this means for readers
For travel businesses, arrivals help identify where visitor flows already exist at scale and where distribution partnerships, aviation links, hotels, guides, and transport services already have demand to serve. For researchers, the ranking separates destination fame from measurable trip volume. For policymakers, arrivals indicate pressure on airports, border systems, roads, rail links, accommodation, utilities, policing, waste management, and heritage sites. For readers comparing countries, the key is to avoid treating arrivals as a single score of tourism success.
A practical reading combines arrivals with tourism receipts, average spend, length of stay, seasonality, source-market diversity, aviation capacity, hotel occupancy, resident pressure, and environmental limits. A country can rank high in arrivals and still face weak margins, overcrowding, or infrastructure stress; another can rank lower and still operate a high-value tourism model with longer stays and higher spending per visitor.
FAQ
Does one arrival mean one unique tourist?
No. Arrivals count trips. A person who enters the same country multiple times can be counted multiple times during the year.
Is this the same as tourism revenue?
No. A country can receive many visitors but earn less per visitor than a destination with fewer arrivals and higher spending. Arrivals measure volume, not value.
Why is Europe so visible near the top?
European geography, open borders, short distances, dense rail and air links, and repeat cross-border travel make arrivals counts especially high for many European destinations.
Why do some smaller countries rank surprisingly high?
Small countries can rank high when they sit near large source markets, receive frequent short trips, or have concentrated resort, city-break, or cross-border demand.
Are all countries measured exactly the same way?
Not perfectly. National data systems may use border records, accommodation statistics, surveys, or mixed approaches. Some systems are better at capturing land arrivals, cruise passengers, transit treatment, or repeat entries than others. This is why arrivals should be interpreted as a scale indicator rather than a flawless country score.
Why can 2025 context and country rows differ?
Global tourism updates are released faster than complete country-by-country datasets. The 2025 context describes the overall recovery, while the country rows use the latest broad comparable ranking basis.
Sources
Last updated: April 29, 2026. Source links were reviewed for the World Bank WDI arrivals series and UN Tourism global context.
- World Bank World Development Indicators — International tourism, number of arrivalsCountry-level arrivals series for the ranking. https://data.worldbank.org/indicator/ST.INT.ARVL
- World Bank DataBank — World Development Indicators metadataIndicator definitions and comparability notes for tourism arrivals. https://databank.worldbank.org/source/world-development-indicators
- UN Tourism — World Tourism Barometer and global tourism updatesGlobal recovery context and international arrivals trends. https://www.unwto.org/un-tourism-world-tourism-barometer-data
- UN Tourism — Glossary and tourism statistics guidanceDefinitions for international visitors, tourists, and arrivals. https://www.unwto.org/glossary-tourism-terms
Related rankings
More StatRanker pages connected by topic, category or ranking theme.
