

Average HO-3 Homeowners Insurance Premium by State (2026 Snapshot)
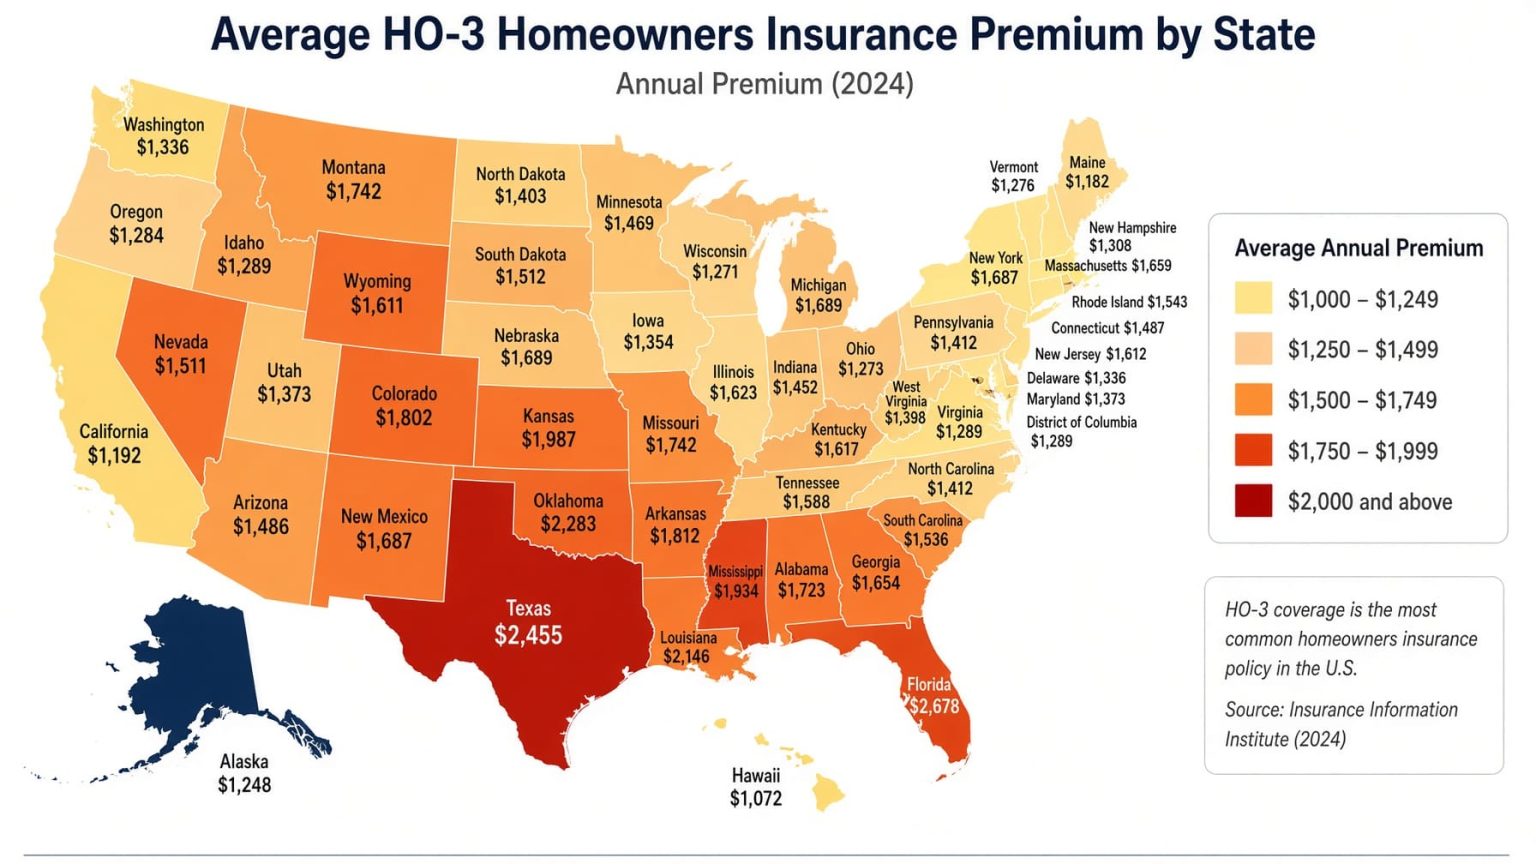
Average HO-3 homeowners insurance premiums by state: NAIC 2022 data
Florida has the highest average HO-3 homeowners insurance premium in the NAIC data used for this ranking, at $2,677 per year. Louisiana follows at $2,603, while Oregon has the lowest state average at $893.
This ranking compares average annual premiums for HO-3 owner-occupied homeowners policies across all 50 U.S. states using observed 2022 data published by the National Association of Insurance Commissioners. Premiums are measured in dollars per house-year, and higher averages rank higher.
This is a 2026 reference snapshot of the latest publicly downloadable NAIC form-level Homeowners Report verified on August 23, 2026. The figures themselves are 2022 observations, not estimated 2026 premiums. All 50 state values are published by NAIC; no premiums have been projected, inflation-adjusted or modeled.
Florida has the highest published HO-3 average in the NAIC 2022 data.
Oregon has the lowest average among the 50 states.
The NAIC countrywide figure is based on aggregate premium and exposure, not an equal-weight average of the states.
The District of Columbia is reported by NAIC but excluded from this state-only ranking.
Observed NAIC premiums; the 2026 date refers to the publication snapshot, not the insurance year.
What the HO-3 premium ranking measures
HO-3 is the dominant owner-occupied homeowners policy form in the NAIC report, accounting for 78.99% of owner-occupied homeowners exposures in 2022. NAIC describes the form as providing broad building coverage against direct losses except those specifically excluded, together with broad named-peril coverage for personal property.
The average premium represents the cost of one year of HO-3 coverage across the policies included for a state. NAIC develops average premiums from aggregate written premium and written exposure, with exposure measured in house-years. One house-year represents 12 months of dwelling coverage.
These numbers are market averages, not quotes for an identical house in every state. Coverage amounts, property values, deductibles, local hazards, policy choices and other market characteristics differ substantially, so state averages should be treated as broad benchmarks rather than standardized price comparisons.
Top 10 states by average HO-3 premium
Florida and Louisiana stand at the top of the ranking, followed by Texas and Oklahoma. Six states have average annual HO-3 premiums above $2,000 in the NAIC dataset.
Top 10 states by average annual HO-3 premium
| Rank | State | Average premium | Source / note |
|---|---|---|---|
| 1 | Florida | $2,677 | NAIC · 2022 observed HO-3 average. |
| 2 | Louisiana | $2,603 | NAIC · 2022 observed HO-3 average. |
| 3 | Texas | $2,397 | NAIC · 2022 observed HO-3 average. |
| 4 | Oklahoma | $2,268 | NAIC · 2022 observed HO-3 average. |
| 5 | Colorado | $2,079 | NAIC · 2022 observed HO-3 average. |
| 6 | Rhode Island | $2,074 | NAIC · 2022 observed HO-3 average. |
| 7 | Mississippi | $1,907 | NAIC · 2022 observed HO-3 average. |
| 8 | Massachusetts | $1,871 | NAIC · 2022 observed HO-3 average. |
| 9 | Nebraska | $1,869 | NAIC · 2022 observed HO-3 average. |
| 10 | Connecticut | $1,814 | NAIC · 2022 observed HO-3 average. |
Premiums are annual dollars per house-year. States are ranked from the highest published average to the lowest.
Top 20 states by average HO-3 premium
Bars are scaled to Florida, the highest-premium state. The dollar figures are the same values shown in the ranking table.
Methodology
What is measured
The ranking uses the statewide average annual premium for the HO-3 owner-occupied homeowners policy form. Premiums are expressed in U.S. dollars per house-year.
How states are ranked
Higher average premiums rank higher. When two states have the same published value, they share the same rank rather than being separated by an artificial tie-break.
Data year
Every state value is an observed 2022 premium. The 2026 label describes when the ranking was reviewed and published, not the year of the insurance premium.
Geographic coverage
All 50 states are included. The District of Columbia is reported by NAIC but is excluded because this page is specifically a ranking of states.
Source consistency
All state premiums come from the same NAIC Homeowners Insurance Report and the same data year. Commercial quote studies and insurer samples are not mixed into the table.
How NAIC develops the averages
NAIC calculates average premiums from aggregate written premium divided by written exposure for each policy form. Written exposure is measured in house-years.
NAIC collected premium and exposure information for every state and the District of Columbia. For most states, data were supplied through insurance statistical agents. Texas data were obtained from the Texas Department of Insurance, and California data were provided by the California Department of Insurance.
The report also incorporates certain residual-market data. NAIC explains that when the underlying policy form for a supplemental residual-market policy is unavailable, the supplemental policy may be classified as HO-3. Its premium is included while its exposure is excluded to avoid counting the same underlying dwelling twice.
State averages should not be interpreted as the price of identical coverage. NAIC specifically cautions that average premium is an imperfect measure for direct state-to-state price comparisons because hazards, economic conditions, property values, coverage amounts, limits and deductibles differ.
The countrywide HO-3 average of $1,569 is based on aggregate premium and exposure, so states contribute according to their exposure rather than receiving equal weight.
This ranking does not measure a homeowner's current quote, insurance affordability relative to income, claims frequency, insurer profitability, catastrophe exposure, coverage adequacy or the price of a standardized property. Separate flood insurance is not part of the HO-3 premium shown here.
Data availability was checked on August 23, 2026. NAIC's Publications catalog continued to link the Homeowners Report with 2022 form-level data. NAIC's 2026 statistical-report schedule separately lists a Homeowners Insurance Report using 2024 data; no unverified replacement values are substituted into this ranking.
Average HO-3 premium in all 50 states
Use the controls to find a state, change the sort order or narrow the table to the highest 10 or 20 premiums. All state values remain visible if JavaScript is unavailable.
Average annual HO-3 homeowners insurance premium, NAIC 2022
| Rank | State | Average premium | Source / note |
|---|---|---|---|
| 1 | Florida | $2,677 | NAIC 2022 · observed HO-3 average. |
| 2 | Louisiana | $2,603 | NAIC 2022 · observed HO-3 average. |
| 3 | Texas | $2,397 | NAIC 2022 · observed HO-3 average. |
| 4 | Oklahoma | $2,268 | NAIC 2022 · observed HO-3 average. |
| 5 | Colorado | $2,079 | NAIC 2022 · observed HO-3 average. |
| 6 | Rhode Island | $2,074 | NAIC 2022 · observed HO-3 average. |
| 7 | Mississippi | $1,907 | NAIC 2022 · observed HO-3 average. |
| 8 | Massachusetts | $1,871 | NAIC 2022 · observed HO-3 average. |
| 9 | Nebraska | $1,869 | NAIC 2022 · observed HO-3 average. |
| 10 | Connecticut | $1,814 | NAIC 2022 · observed HO-3 average. |
| 11 | Minnesota | $1,774 | NAIC 2022 · observed HO-3 average. |
| 12 | South Dakota | $1,756 | NAIC 2022 · observed HO-3 average. |
| 13 | Alabama | $1,748 | NAIC 2022 · observed HO-3 average. |
| 14 | Arkansas | $1,740 | NAIC 2022 · observed HO-3 average. |
| 15 | Missouri | $1,668 | NAIC 2022 · observed HO-3 average. |
| 16 | Georgia | $1,655 | NAIC 2022 · observed HO-3 average. |
| 17 | Montana | $1,639 | NAIC 2022 · observed HO-3 average. |
| 18 | New York | $1,628 | NAIC 2022 · observed HO-3 average. |
| 19 | North Carolina | $1,621 | NAIC 2022 · observed HO-3 average. |
| 20 | Wyoming | $1,596 | NAIC 2022 · observed HO-3 average. |
| 21 | Kansas | $1,583 | NAIC 2022 · observed HO-3 average. |
| 22 | South Carolina | $1,571 | NAIC 2022 · observed HO-3 average. |
| 23 | California | $1,492 | NAIC 2022 · tied with Tennessee. |
| 23 | Tennessee | $1,492 | NAIC 2022 · tied with California. |
| 25 | Hawaii | $1,431 | NAIC 2022 · observed HO-3 average. |
| 26 | New Jersey | $1,417 | NAIC 2022 · observed HO-3 average. |
| 27 | Maryland | $1,392 | NAIC 2022 · observed HO-3 average. |
| 28 | Kentucky | $1,359 | NAIC 2022 · observed HO-3 average. |
| 29 | Illinois | $1,343 | NAIC 2022 · observed HO-3 average. |
| 30 | Virginia | $1,332 | NAIC 2022 · observed HO-3 average. |
| 31 | North Dakota | $1,325 | NAIC 2022 · observed HO-3 average. |
| 32 | New Mexico | $1,322 | NAIC 2022 · observed HO-3 average. |
| 33 | Iowa | $1,268 | NAIC 2022 · observed HO-3 average. |
| 34 | Indiana | $1,191 | NAIC 2022 · observed HO-3 average. |
| 35 | New Hampshire | $1,188 | NAIC 2022 · observed HO-3 average. |
| 36 | Washington | $1,151 | NAIC 2022 · observed HO-3 average. |
| 37 | Alaska | $1,129 | NAIC 2022 · observed HO-3 average. |
| 38 | Pennsylvania | $1,120 | NAIC 2022 · observed HO-3 average. |
| 39 | West Virginia | $1,113 | NAIC 2022 · observed HO-3 average. |
| 40 | Vermont | $1,109 | NAIC 2022 · observed HO-3 average. |
| 41 | Delaware | $1,103 | NAIC 2022 · observed HO-3 average. |
| 42 | Maine | $1,077 | NAIC 2022 · observed HO-3 average. |
| 43 | Michigan | $1,056 | NAIC 2022 · observed HO-3 average. |
| 44 | Arizona | $1,018 | NAIC 2022 · observed HO-3 average. |
| 45 | Idaho | $1,002 | NAIC 2022 · observed HO-3 average. |
| 46 | Ohio | $995 | NAIC 2022 · observed HO-3 average. |
| 47 | Wisconsin | $957 | NAIC 2022 · observed HO-3 average. |
| 48 | Nevada | $948 | NAIC 2022 · observed HO-3 average. |
| 49 | Utah | $937 | NAIC 2022 · observed HO-3 average. |
| 50 | Oregon | $893 | NAIC 2022 · observed HO-3 average. |
California and Tennessee share rank 23 at $1,492. Under standard competition ranking, the next state is ranked 25th.
What stands out in the ranking
Highest premiums
Florida and Louisiana are the only states above $2,500, and both sit well above the $1,569 countrywide HO-3 average.
A clear tie
California and Tennessee both report an average premium of $1,492. The ranking preserves that tie rather than inventing an ordering between them.
Consistent source
Every state is compared using the same policy form, the same 2022 data year and the same NAIC report, avoiding the distortions that can result from mixing commercial quote surveys.
Wide state spread
Florida's $2,677 average is about three times Oregon's $893 average, showing how widely statewide HO-3 averages vary across the country.
How to interpret state premium differences
A state's position is best read as a benchmark for the HO-3 business represented in the NAIC dataset. It is not a prediction of what an individual homeowner will pay.
Actual premiums depend on factors such as insured replacement value, location, deductible, construction characteristics, selected limits, endorsements, insurer underwriting and discounts. The mix of those characteristics is different in every state.
The ranking also does not prove why one state's premium is higher than another's. NAIC identifies multiple factors that can affect homeowners insurance costs, including hazards, repair and construction costs, real-estate values, coverage choices, underwriting costs and state-specific insurance requirements. The table measures the observed result; it does not assign a single cause.
For homeowners comparing insurance with mortgage payments, property taxes or renovation costs, the data year matters. The figures on this page describe the 2022 market captured by NAIC and should not be treated as current individual quotes.
Download the Average HO-3 Homeowners Insurance Premium by State (2026 Snapshot) dataset
Average HO-3 Homeowners Insurance Premium by State (2026 Snapshot)
50 ranked entries · Excel + CSV + methodology + sources + chart · Snapshot: 2022 · Version 1.0
The archive includes machine-readable data, methodology and source documentation. Quick human verification is required before the ZIP is delivered. Full Data Pack downloads require a free account. Free accounts can download 1 different Data Pack every 30 days; re-downloading the same pack does not use another slot. Annual Data Access provides unlimited manual downloads while annual access is active.
Download Excel + CSV Data PackFrequently asked questions
Which state has the highest average HO-3 homeowners insurance premium?
Florida ranks first at $2,677 per year in the NAIC 2022 data. Louisiana is second at $2,603 and Texas is third at $2,397.
Are these current 2026 insurance premiums?
No. The ranking is a 2026 reference snapshot built from observed 2022 NAIC premiums. No attempt has been made to estimate or forecast each state's 2026 average.
Are the state premiums published directly by NAIC?
Yes. The state averages shown in the ranking are published in the NAIC Homeowners Insurance Report. StatRanker ranks those reported values but does not recalculate the state premiums.
What is an HO-3 homeowners policy?
HO-3 is the most common owner-occupied homeowners form in the NAIC report. NAIC describes it as covering direct losses to the building except losses specifically excluded by the policy, while personal property is covered against a broad list of named perils.
Does an HO-3 premium include flood insurance?
No. NAIC specifically uses flood as an example of a loss that may be excluded from the building coverage. Separate flood insurance should not be treated as part of the HO-3 premium in this ranking.
Why is the countrywide average different from an average of the 50 state figures?
The $1,569 countrywide figure is based on aggregate premium divided by aggregate exposure. States with more HO-3 house-years therefore contribute more to the national figure.
Why is the District of Columbia not included?
NAIC reports data for the District of Columbia, but this page ranks the 50 U.S. states. D.C. is excluded rather than being presented as a state.
Can this ranking tell me what my homeowners insurance will cost?
No. It provides historical statewide averages. A current individual quote depends on the home, location, coverage limits, deductible, insurer and policyholder-specific underwriting factors.
Sources
All premium figures in the ranking come from the same NAIC Homeowners Insurance Report. The additional NAIC pages below document the publication, its catalog status and the statistical-report schedule used to check data availability.
NAIC Homeowners Insurance Report: Data for 2022
Primary source for all state HO-3 premiums, the countrywide average, policy-form definitions, exposure methodology and data limitations.
https://content.naic.org/sites/default/files/publication-hmr-zu-homeowners-report.pdf
NAIC Publications
NAIC's publication catalog for the Homeowners Report and the current downloadable report linked from that entry.
NAIC Research & Actuarial Department
Used to check the 2026 statistical-report schedule and the listed data year for the next Homeowners Insurance Report.
NAIC release of the 2022 Homeowners Insurance Report
Provides publication context and summarizes the report's scope, HO-3 prevalence and data collection.
https://content.naic.org/article/naic-releases-homeowners-insurance-report-2022
Related rankings
Closely related StatRanker ranking and data pages selected by topic, entity scope and category. Fewer links are shown when strong matches are limited.
