

Average NFIP Flood Insurance Cost by State, 2026
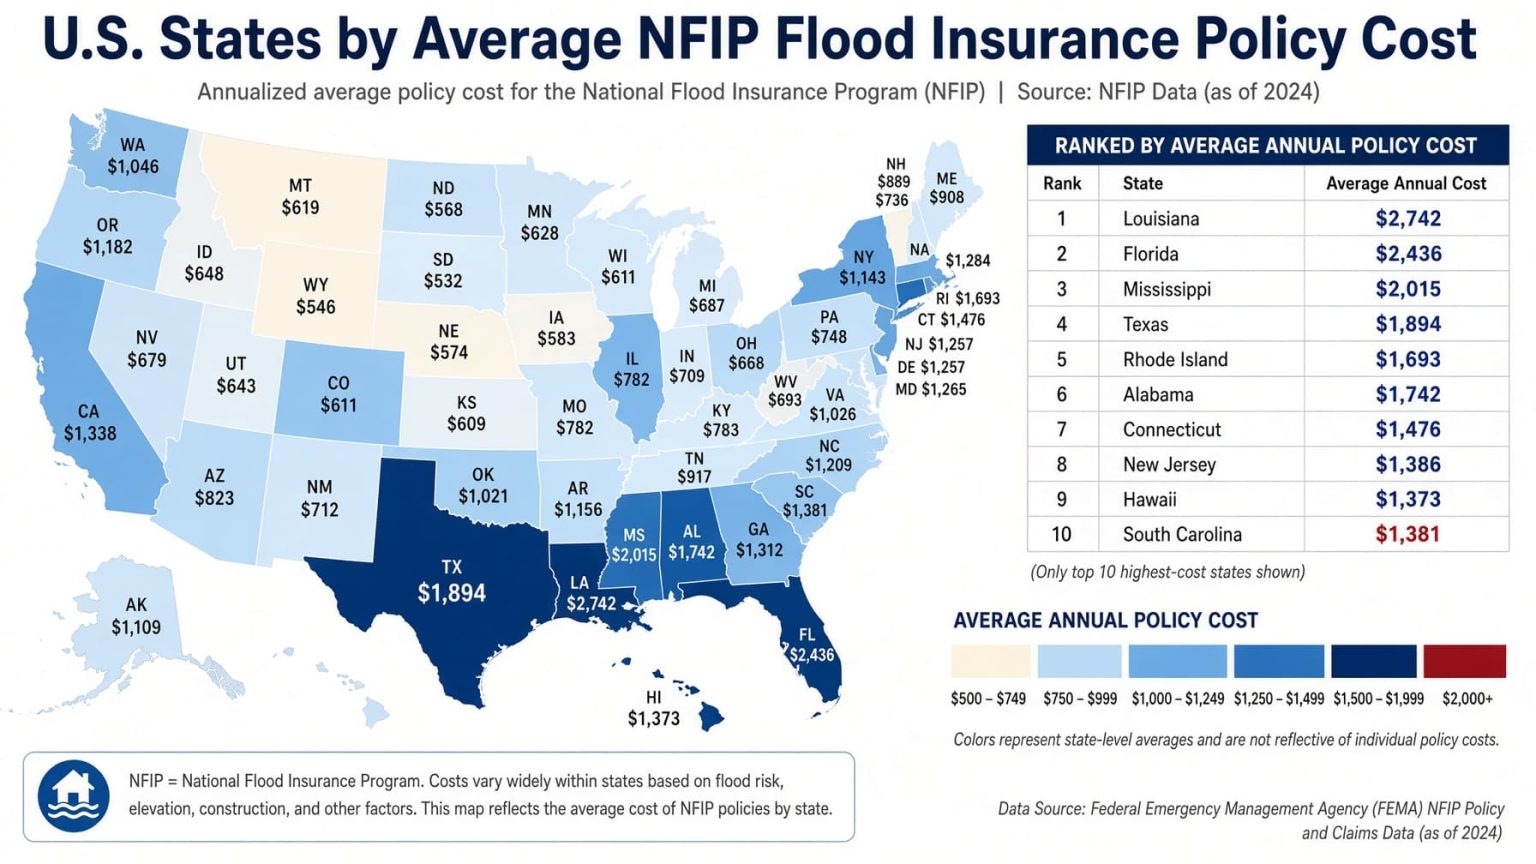
NFIP Policy Cost Ranking by State: July 2026 Snapshot
As of July 31, 2026, West Virginia had the highest average annual NFIP payment among the 50 states at about $2,260 per policy. Vermont ranked second at $2,126, Pennsylvania ranked third at $1,895, and Alaska had the lowest average at about $588.
The ranking compares the average annual payment for National Flood Insurance Program policies in force. For each state, FEMA’s Total Annual Payment is divided by its Policies in Force count. FEMA defines Total Annual Payment as submitted written premium after discounts plus applicable fees, assessments and surcharges.
The ranking covers all 50 states, uses U.S. dollars per policy per year, and places higher average payments first. All 50 state averages are calculated from official FEMA totals; none are directly published state averages, forecasts or modeled projections. These figures are not insurance quotes. The table is a compiled research dataset based on 2 sources, with row-level source and method notes shown in the ranking table.
West Virginia; $20,390,762 in annual payments across 9,021 policies.
Alaska; $1,882,944 in annual payments across 3,204 policies.
NFIP policies in force across the 50 states in the FEMA snapshot.
$5,501,955,873 in annual payments divided by 4,463,346 policies.
What “average NFIP policy cost” means
This ranking measures the average annual payment across NFIP policies currently in force in each state. It is a statewide average across the existing policy mix, not a quoted price for a typical home or a specific property.
FEMA does not publish the state average used here as a ready-made figure. We calculate it from the agency’s observed totals: Total Annual Payment ÷ Policies in Force. The result reflects the published July 31, 2026 snapshot rather than a forecast or modeled estimate.
Total Annual Payment is broader than premium alone because it includes applicable fees, assessments and surcharges as well as submitted written premium after discounts. That distinction matters when comparing this ranking with sources that report average premium only.
Top 10 states by average annual NFIP policy cost
The Top 10 are ranked from the same unrounded values used in the full table. Dollar amounts are rounded to the nearest dollar only after ranking.
Highest average NFIP annual payment per policy, July 31, 2026
| Rank | State | Avg annual cost | Source / calculation |
|---|---|---|---|
| 1 | West Virginia | $2,260 | Calculated from FEMA data · Jul. 31, 2026 · $20,390,762 ÷ 9,021 policies = $2,260.37. Census region: South. |
| 2 | Vermont | $2,126 | Calculated from FEMA data · Jul. 31, 2026 · $8,269,529 ÷ 3,889 policies = $2,126.39. Census region: Northeast. |
| 3 | Pennsylvania | $1,895 | Calculated from FEMA data · Jul. 31, 2026 · $78,841,667 ÷ 41,607 policies = $1,894.91. Census region: Northeast. |
| 4 | Connecticut | $1,874 | Calculated from FEMA data · Jul. 31, 2026 · $57,488,720 ÷ 30,672 policies = $1,874.31. Census region: Northeast. |
| 5 | Missouri | $1,837 | Calculated from FEMA data · Jul. 31, 2026 · $26,323,854 ÷ 14,331 policies = $1,836.85. Census region: Midwest. |
| 6 | Kentucky | $1,811 | Calculated from FEMA data · Jul. 31, 2026 · $30,705,829 ÷ 16,953 policies = $1,811.23. Census region: South. |
| 7 | Maine | $1,770 | Calculated from FEMA data · Jul. 31, 2026 · $14,865,332 ÷ 8,400 policies = $1,769.68. Census region: Northeast. |
| 8 | Iowa | $1,694 | Calculated from FEMA data · Jul. 31, 2026 · $15,390,347 ÷ 9,086 policies = $1,693.85. Census region: Midwest. |
| 9 | Tennessee | $1,553 | Calculated from FEMA data · Jul. 31, 2026 · $34,953,733 ÷ 22,508 policies = $1,552.95. Census region: South. |
| 10 | New Hampshire | $1,537 | Calculated from FEMA data · Jul. 31, 2026 · $11,025,241 ÷ 7,175 policies = $1,536.62. Census region: Northeast. |
Each Top 10 average is calculated from FEMA’s published July 31, 2026 totals. The ranking contains no forecasts or future pricing assumptions.
Top 20 states by average NFIP policy cost
The chart compares the 20 highest state averages using the same values as the ranking table. West Virginia has the highest average annual payment in this snapshot.
Top-20 range: West Virginia averages about $2,260 per policy, while Oklahoma, ranked 20th, averages about $1,387. The full ranking extends to Alaska at about $588.
Methodology
Metric and formula
Average annual NFIP policy cost = state Total Annual Payment ÷ state Policies in Force. Both inputs come from FEMA’s July 31, 2026 NFIP policy report.
What the payment includes
FEMA defines Total Annual Payment as submitted written premium after discounts plus applicable fees, assessments and surcharges. It is broader than premium alone.
Coverage and exclusions
The ranking includes the 50 U.S. states only. Washington, D.C., U.S. territories and records not assigned to a state are excluded.
Ranking rule
States are sorted by the unrounded calculated average from highest to lowest. Dollar values are rounded only for display.
Data inputs: FEMA’s NFIP Policy Information by State and Community report supplies Policies in Force and Total Annual Payment. Community values are aggregated within each state, then the state payment total is divided by the state policy count. FEMA does not publish the resulting state average directly.
Assumptions: no weighting is added beyond the reported policy count, and non-state records are not reassigned. The calculation does not adjust for occupancy, coverage amount, flood zone, building characteristics, discounts, policy form or private flood-insurance participation.
Limits: this metric describes NFIP policies currently in force; it does not predict what a new applicant will pay. A state average can change because the policy mix changes as well as because premiums, fees or surcharges change. The ranking does not measure flood risk, affordability, claim probability, private flood-insurance prices or homeowners-insurance cost.
Regions: Northeast, Midwest, South and West follow the U.S. Census Bureau’s standard regional classification. Regions are used only for filtering and comparisons and do not affect state costs or ranks.
Main ranking: all 50 states
Search by state, filter by U.S. Census region or data basis, change the sort order, or focus on the Top 10, Top 20 or all 50 states.
Average NFIP annual payment per policy, 50 states, July 31, 2026
| Rank | State | Avg annual cost | Source / calculation |
|---|---|---|---|
| 1 | West Virginia | $2,260 | Calculated from FEMA data · Jul. 31, 2026 · $20,390,762 ÷ 9,021 policies = $2,260.37. Census region: South. |
| 2 | Vermont | $2,126 | Calculated from FEMA data · Jul. 31, 2026 · $8,269,529 ÷ 3,889 policies = $2,126.39. Census region: Northeast. |
| 3 | Pennsylvania | $1,895 | Calculated from FEMA data · Jul. 31, 2026 · $78,841,667 ÷ 41,607 policies = $1,894.91. Census region: Northeast. |
| 4 | Connecticut | $1,874 | Calculated from FEMA data · Jul. 31, 2026 · $57,488,720 ÷ 30,672 policies = $1,874.31. Census region: Northeast. |
| 5 | Missouri | $1,837 | Calculated from FEMA data · Jul. 31, 2026 · $26,323,854 ÷ 14,331 policies = $1,836.85. Census region: Midwest. |
| 6 | Kentucky | $1,811 | Calculated from FEMA data · Jul. 31, 2026 · $30,705,829 ÷ 16,953 policies = $1,811.23. Census region: South. |
| 7 | Maine | $1,770 | Calculated from FEMA data · Jul. 31, 2026 · $14,865,332 ÷ 8,400 policies = $1,769.68. Census region: Northeast. |
| 8 | Iowa | $1,694 | Calculated from FEMA data · Jul. 31, 2026 · $15,390,347 ÷ 9,086 policies = $1,693.85. Census region: Midwest. |
| 9 | Tennessee | $1,553 | Calculated from FEMA data · Jul. 31, 2026 · $34,953,733 ÷ 22,508 policies = $1,552.95. Census region: South. |
| 10 | New Hampshire | $1,537 | Calculated from FEMA data · Jul. 31, 2026 · $11,025,241 ÷ 7,175 policies = $1,536.62. Census region: Northeast. |
| 11 | South Dakota | $1,536 | Calculated from FEMA data · Jul. 31, 2026 · $3,738,248 ÷ 2,434 policies = $1,535.85. Census region: Midwest. |
| 12 | Massachusetts | $1,536 | Calculated from FEMA data · Jul. 31, 2026 · $87,627,401 ÷ 57,061 policies = $1,535.68. Census region: Northeast. |
| 13 | New York | $1,522 | Calculated from FEMA data · Jul. 31, 2026 · $248,293,997 ÷ 163,160 policies = $1,521.78. Census region: Northeast. |
| 14 | Mississippi | $1,517 | Calculated from FEMA data · Jul. 31, 2026 · $72,739,015 ÷ 47,956 policies = $1,516.79. Census region: South. |
| 15 | New Mexico | $1,488 | Calculated from FEMA data · Jul. 31, 2026 · $20,293,906 ÷ 13,642 policies = $1,487.60. Census region: West. |
| 16 | Minnesota | $1,431 | Calculated from FEMA data · Jul. 31, 2026 · $8,967,917 ÷ 6,266 policies = $1,431.20. Census region: Midwest. |
| 17 | Rhode Island | $1,412 | Calculated from FEMA data · Jul. 31, 2026 · $16,039,906 ÷ 11,358 policies = $1,412.21. Census region: Northeast. |
| 18 | New Jersey | $1,406 | Calculated from FEMA data · Jul. 31, 2026 · $271,298,777 ÷ 192,963 policies = $1,405.96. Census region: Northeast. |
| 19 | Ohio | $1,396 | Calculated from FEMA data · Jul. 31, 2026 · $30,420,921 ÷ 21,785 policies = $1,396.42. Census region: Midwest. |
| 20 | Oklahoma | $1,387 | Calculated from FEMA data · Jul. 31, 2026 · $11,381,729 ÷ 8,207 policies = $1,386.83. Census region: South. |
| 21 | Arkansas | $1,372 | Calculated from FEMA data · Jul. 31, 2026 · $15,069,071 ÷ 10,987 policies = $1,371.54. Census region: South. |
| 22 | Kansas | $1,352 | Calculated from FEMA data · Jul. 31, 2026 · $8,753,541 ÷ 6,476 policies = $1,351.69. Census region: Midwest. |
| 23 | Washington | $1,319 | Calculated from FEMA data · Jul. 31, 2026 · $38,366,487 ÷ 29,083 policies = $1,319.21. Census region: West. |
| 24 | Illinois | $1,305 | Calculated from FEMA data · Jul. 31, 2026 · $39,397,956 ÷ 30,195 policies = $1,304.78. Census region: Midwest. |
| 25 | Louisiana | $1,292 | Calculated from FEMA data · Jul. 31, 2026 · $515,735,523 ÷ 399,096 policies = $1,292.26. Census region: South. |
| 26 | California | $1,291 | Calculated from FEMA data · Jul. 31, 2026 · $218,920,008 ÷ 169,601 policies = $1,290.79. Census region: West. |
| 27 | Indiana | $1,289 | Calculated from FEMA data · Jul. 31, 2026 · $19,492,483 ÷ 15,117 policies = $1,289.44. Census region: Midwest. |
| 28 | Idaho | $1,282 | Calculated from FEMA data · Jul. 31, 2026 · $6,044,974 ÷ 4,717 policies = $1,281.53. Census region: West. |
| 29 | Nebraska | $1,280 | Calculated from FEMA data · Jul. 31, 2026 · $9,158,970 ÷ 7,153 policies = $1,280.44. Census region: Midwest. |
| 30 | Wyoming | $1,270 | Calculated from FEMA data · Jul. 31, 2026 · $1,983,790 ÷ 1,562 policies = $1,270.03. Census region: West. |
| 31 | Colorado | $1,253 | Calculated from FEMA data · Jul. 31, 2026 · $19,675,934 ÷ 15,699 policies = $1,253.32. Census region: West. |
| 32 | Oregon | $1,248 | Calculated from FEMA data · Jul. 31, 2026 · $27,836,039 ÷ 22,304 policies = $1,248.03. Census region: West. |
| 33 | Wisconsin | $1,244 | Calculated from FEMA data · Jul. 31, 2026 · $13,469,930 ÷ 10,830 policies = $1,243.76. Census region: Midwest. |
| 34 | Texas | $1,234 | Calculated from FEMA data · Jul. 31, 2026 · $697,256,268 ÷ 565,198 policies = $1,233.65. Census region: South. |
| 35 | Montana | $1,219 | Calculated from FEMA data · Jul. 31, 2026 · $4,475,455 ÷ 3,672 policies = $1,218.81. Census region: West. |
| 36 | Alabama | $1,185 | Calculated from FEMA data · Jul. 31, 2026 · $52,738,683 ÷ 44,519 policies = $1,184.63. Census region: South. |
| 37 | North Carolina | $1,179 | Calculated from FEMA data · Jul. 31, 2026 · $151,785,033 ÷ 128,772 policies = $1,178.71. Census region: South. |
| 38 | Nevada | $1,175 | Calculated from FEMA data · Jul. 31, 2026 · $10,490,050 ÷ 8,924 policies = $1,175.49. Census region: West. |
| 39 | Florida | $1,169 | Calculated from FEMA data · Jul. 31, 2026 · $2,044,712,548 ÷ 1,748,473 policies = $1,169.43. Census region: South. |
| 40 | Georgia | $1,134 | Calculated from FEMA data · Jul. 31, 2026 · $78,787,395 ÷ 69,506 policies = $1,133.53. Census region: South. |
| 41 | Arizona | $1,110 | Calculated from FEMA data · Jul. 31, 2026 · $24,367,230 ÷ 21,946 policies = $1,110.33. Census region: West. |
| 42 | North Dakota | $1,104 | Calculated from FEMA data · Jul. 31, 2026 · $6,220,741 ÷ 5,633 policies = $1,104.34. Census region: Midwest. |
| 43 | Delaware | $1,093 | Calculated from FEMA data · Jul. 31, 2026 · $27,446,085 ÷ 25,101 policies = $1,093.43. Census region: South. |
| 44 | Michigan | $1,077 | Calculated from FEMA data · Jul. 31, 2026 · $20,537,875 ÷ 19,072 policies = $1,076.86. Census region: Midwest. |
| 45 | Hawaii | $987 | Calculated from FEMA data · Jul. 31, 2026 · $63,698,861 ÷ 64,541 policies = $986.95. Census region: West. |
| 46 | Virginia | $977 | Calculated from FEMA data · Jul. 31, 2026 · $86,887,548 ÷ 88,910 policies = $977.25. Census region: South. |
| 47 | South Carolina | $973 | Calculated from FEMA data · Jul. 31, 2026 · $184,046,261 ÷ 189,194 policies = $972.79. Census region: South. |
| 48 | Utah | $882 | Calculated from FEMA data · Jul. 31, 2026 · $3,590,534 ÷ 4,069 policies = $882.41. Census region: West. |
| 49 | Maryland | $653 | Calculated from FEMA data · Jul. 31, 2026 · $40,070,825 ÷ 61,318 policies = $653.49. Census region: South. |
| 50 | Alaska | $588 | Calculated from FEMA data · Jul. 31, 2026 · $1,882,944 ÷ 3,204 policies = $587.69. Census region: West. |
FEMA supplies the policy counts and annual-payment totals used to calculate every state value. U.S. Census Bureau regions are used only for filtering and regional comparisons. Ranking values are based on unrounded calculations.
What stands out in the 50-state ranking
West Virginia and Vermont lead
West Virginia’s average is about $2,260 per policy, with Vermont next at $2,126. West Virginia is roughly 3.85 times Alaska’s $588 average, but that difference should not be read as a flood-risk ratio.
Five Top-10 states are in the Northeast
Vermont, Pennsylvania, Connecticut, Maine and New Hampshire all appear in the Top 10. The remaining five are split between the South and Midwest.
No Western state reaches the Top 10
New Mexico is the highest-ranked Western state at No. 15, with an average annual payment of about $1,488 per policy.
Ranks 10–12 are separated by less than $1
New Hampshire, South Dakota and Massachusetts all average about $1,536 per policy. The unrounded difference between ranks 10 and 12 is under $1.
What this ranking means
Use the table to compare the average annual payment across NFIP policies currently in force in each state. It provides statewide context, but it is neither a household quote nor a state flood-risk score.
State averages can differ because the underlying policies differ in coverage amounts, property and occupancy mix, flood-zone exposure, discounts, fees, assessments and other rating inputs. The data do not show which single factor explains a state’s ranking.
For homeowners, lenders and real-estate readers, a statewide average is best used as context. The cost for an individual property depends on its own NFIP rating information, and private flood insurance is outside this ranking.
Download the Average NFIP Flood Insurance Cost by State, 2026 dataset
Average NFIP Flood Insurance Cost by State, 2026
50 ranked entries · Excel + CSV + methodology + sources + chart · Snapshot: FEMA NFIP policy information as of July 31, 2026 · Version 1.0
The archive includes machine-readable data, methodology and source documentation. Quick human verification is required before the ZIP is delivered. Full Data Pack downloads require a free account. Free accounts can download 1 different Data Pack every 30 days; re-downloading the same pack does not use another slot. Annual Data Access provides unlimited manual downloads while annual access is active.
Download Excel + CSV Data PackFAQ
What exactly does “average NFIP policy cost” mean here?
It means the state’s Total Annual Payment divided by its Policies in Force. FEMA’s Total Annual Payment includes submitted written premium after discounts plus applicable fees, assessments and surcharges.
Are these state averages published directly by FEMA?
No. FEMA publishes the underlying policy counts and annual-payment totals. The state averages on this page are calculated from those official observed values using the formula disclosed in the methodology.
Are these forecasts for the rest of 2026?
No. This is a July 31, 2026 snapshot of policies in force and annual payments reported by FEMA. The ranking does not project future premiums or policy costs.
Does a higher rank mean a state has higher flood risk?
No. The ranking measures average annual NFIP policy payment, not flood probability or expected loss. Policy mix, coverage, rating characteristics, discounts, fees and other factors can affect the average.
Does this include private flood insurance?
No. The data cover the National Flood Insurance Program only. Private flood-insurance policies and their prices are outside the dataset.
Why are Washington, D.C. and U.S. territories excluded?
The subject is the 50 U.S. states. Other jurisdictions in the source are excluded rather than mixed into a state-only ranking.
Why can this differ from an “average premium” reported elsewhere?
This page uses FEMA’s Total Annual Payment, which is broader than premium alone. A source that averages written premium only, or uses a different policy population, is measuring something different.
Sources
Two sources underpin the ranking itself: FEMA supplies policy counts and annual-payment totals, while the U.S. Census Bureau supplies regional classifications. Additional FEMA references below document the NFIP data environment and definitions.
FEMA NFIP — Policy Information by State and Community
Primary numeric source for Policies in Force and Total Annual Payment as of July 31, 2026.
U.S. Census Bureau — Regions and Divisions
Source for Northeast, Midwest, South and West classifications used in filters and regional comparisons.
https://www.census.gov/data/data-tools/survey-explorer/geo.html
NFIP Flood Insurance Data
Official FEMA/NFIP data hub for policy reports and related datasets.
https://agents.floodsmart.gov/flood-maps-and-data/flood-insurance-data
NFIP Data FAQ
Official explanation of NFIP policy data and dataset limitations.
https://agents.floodsmart.gov/flood-maps-and-data/faqs-about-nfip-data
OpenFEMA NFIP Redacted Policies v3
Supporting FEMA reference for the NFIP policy-data environment; it does not replace the July 31 workbook used for the ranking.
Related rankings
Closely related StatRanker ranking and data pages selected by topic, entity scope and category. Fewer links are shown when strong matches are limited.
