

U.S. States by Fatal Workplace Injury Rate, 2026 Snapshot
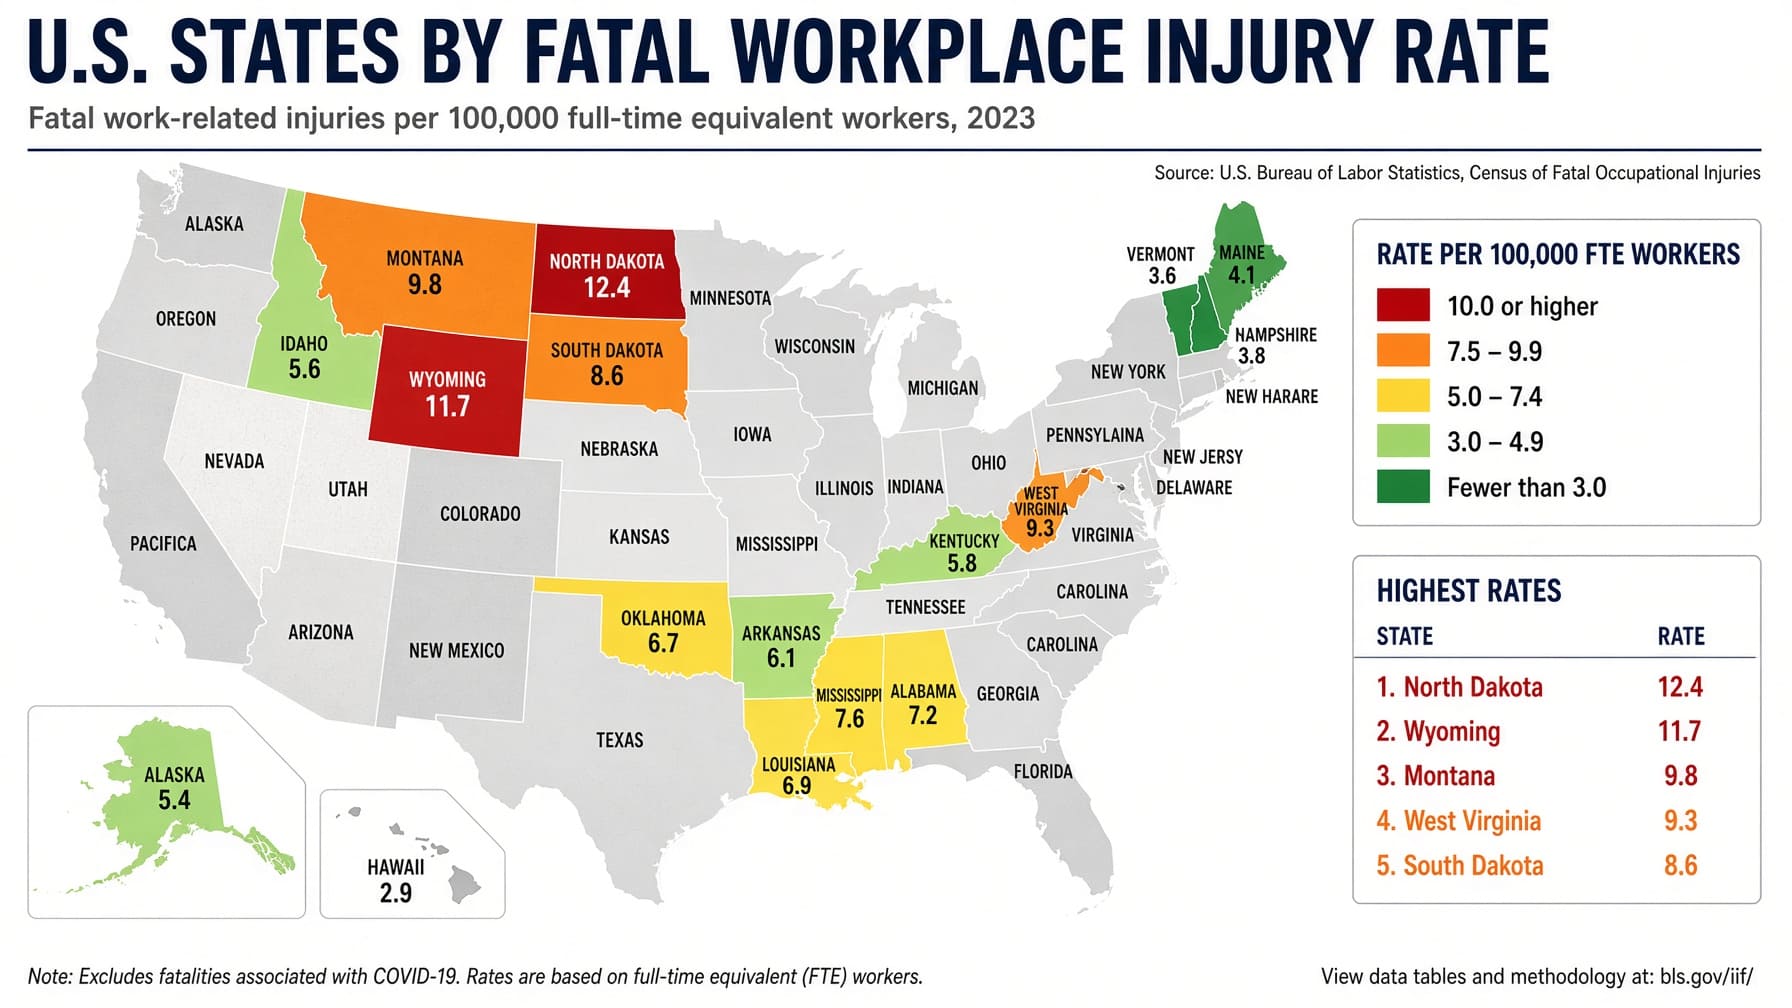
Where fatal workplace injury rates are highest across the United States
Wyoming recorded the highest fatal occupational injury rate among the 50 states in 2024, at 13.9 fatalities per 100,000 full-time equivalent workers. Mississippi followed at 8.0 and Alaska at 7.1. The nationwide rate was 3.3.
The figures come from the U.S. Bureau of Labor Statistics Census of Fatal Occupational Injuries. All states are compared using the same 2024 measure, and higher rates rank higher.
All 50 state rates are values published directly by BLS for 2024. No state values are calculated by StatRanker, and no forecasts or modeled projections are used. The rate adjusts fatal work injuries for differences in hours worked rather than simply comparing death counts.
Continue exploring
More StatRanker pages connected by topic, category or ranking theme.
Wyoming, per 100,000 full-time equivalent workers.
National fatal work injury rate reported by BLS for 2024.
Rhode Island has the lowest published rate among the 50 states.
One BLS data year and one common rate definition across the ranking.
How to read a fatal workplace injury rate
A death count and a fatal injury rate answer different questions. The count shows how many fatal occupational injuries occurred. The rate relates those deaths to the amount of work performed, making states with very different workforce sizes easier to compare.
BLS expresses the measure as fatal occupational injuries per 100,000 full-time equivalent workers. A state above the national 2024 rate of 3.3 therefore had a higher fatal work injury rate than the United States as a whole on this measure.
This is a statewide indicator, not a judgment about every employer or workplace. States have very different combinations of industries and occupations, so the overall rate identifies differences in outcomes but does not explain them by itself.
National context: BLS recorded 5,070 fatal work injuries in the United States in 2024. The national rate declined from 3.5 in 2023 to 3.3 in 2024.
States with the highest fatal workplace injury rates
Wyoming stands well above the rest of the 2024 state distribution. Mississippi, Alaska, North Dakota and Arkansas form the next group. Montana, South Dakota and West Virginia share rank 6 because each has a published rate of 5.8.
First 10 displayed states in descending order by the 2024 BLS rate
| Rank | State | Rate | Note |
|---|---|---|---|
| 1 | Wyoming | 13.9 | More than four times the U.S. rate of 3.3. |
| 2 | Mississippi | 8.0 | Above the 2024 U.S. rate. |
| 3 | Alaska | 7.1 | Above the 2024 U.S. rate. |
| 4 | North Dakota | 6.8 | Above the 2024 U.S. rate. |
| 5 | Arkansas | 6.2 | Above the 2024 U.S. rate. |
| 6 | Montana | 5.8 | Tied for rank 6. |
| 6 | South Dakota | 5.8 | Tied for rank 6. |
| 6 | West Virginia | 5.8 | Tied for rank 6. |
| 9 | Iowa | 5.2 | Above the 2024 U.S. rate. |
| 10 | Louisiana | 5.1 | Tied for rank 10 with Tennessee. |
BLS reports state rates to one decimal place. Identical published values receive the same rank. The next rank is skipped according to standard competition ranking. Alphabetical order is used only to determine the display sequence within a tied group. Tennessee also has a rate of 5.1 and therefore shares rank 10, but appears immediately after these first 10 displayed rows.
Top 20 displayed state entries
The chart uses the same BLS values as the ranking table. Wyoming is the clear high-end outlier, while several positions contain ties because the published rates are rounded to one decimal place.
Methodology
The ranking uses the Bureau of Labor Statistics table “Fatal injury rates by state of incident and industry, all ownerships, 2024.” The overall rate published for each state is used directly. No state rate is reconstructed, estimated or projected.
Measure
Fatal occupational injuries per 100,000 full-time equivalent workers. Higher rates rank higher.
Coverage
All 50 states are included. District of Columbia and the separate New York City observation in the BLS table are excluded because this page ranks states.
Data period
Every state uses 2024 data. This is a 2026 snapshot because BLS released the 2024 CFOI results in February 2026.
Ranking ties
Equal one-decimal rates receive the same rank. Standard competition ranking is used, so the next numerical rank is skipped after a tie.
How BLS calculates the rate
BLS divides the number of fatal work injuries in a state by total employee hours worked in that state and multiplies the result by 200,000,000. The multiplier represents 100,000 full-time equivalent workers working 40 hours per week for 50 weeks.
CFOI supplies the fatal injury count. BLS uses employment information from the Current Population Survey and Local Area Unemployment Statistics for the denominator because CFOI does not collect employment-hours data.
Coverage limits
Workers younger than 16, volunteer workers and members of the resident military are excluded from state rate calculations so the fatality data remain consistent with the employment measures used in the denominator.
Limits to state comparisons
State rates provide a common basis for comparing workforces of different sizes, but the numerator and denominator are not perfectly matched in every circumstance. CFOI assigns a fatality to the state where the incident occurred, while employment estimates can classify workers by state of residence. Employment data also generally describe a worker's primary job, which may differ from the job held at the time of a fatal incident.
CPS-based employment estimates are subject to sampling error. State economies also contain different mixes of industries and occupations, so the overall rate cannot identify a single reason for a state's position.
Historical comparability
BLS adopted hours-based state fatal injury rates in 2007. Earlier state rates were employment-based, and BLS cautions against directly comparing values produced under the two methodologies.
What the measure does not show
The rate does not measure nonfatal workplace injuries, workers' compensation claims, employer liability, insurance premiums or regulatory violations. It also cannot establish responsibility for an individual fatal incident.
All 50 states ranked by fatal workplace injury rate
Search for a state, change the sort order or limit the table to the first 10 or 20 displayed entries. The national 2024 benchmark is 3.3 fatal work injuries per 100,000 full-time equivalent workers.
Fatal occupational injuries per 100,000 full-time equivalent workers, 2024
| Rank | State | Rate | Note |
|---|---|---|---|
| 1 | Wyoming | 13.9 | Above U.S. rate; highest state value. |
| 2 | Mississippi | 8.0 | Above the U.S. rate of 3.3. |
| 3 | Alaska | 7.1 | Above the U.S. rate of 3.3. |
| 4 | North Dakota | 6.8 | Above the U.S. rate of 3.3. |
| 5 | Arkansas | 6.2 | Above the U.S. rate of 3.3. |
| 6 | Montana | 5.8 | Tied for rank 6. |
| 6 | South Dakota | 5.8 | Tied for rank 6. |
| 6 | West Virginia | 5.8 | Tied for rank 6. |
| 9 | Iowa | 5.2 | Above the U.S. rate of 3.3. |
| 10 | Louisiana | 5.1 | Tied for rank 10 with Tennessee. |
| 10 | Tennessee | 5.1 | Tied for rank 10 with Louisiana. |
| 12 | Idaho | 5.0 | Above the U.S. rate of 3.3. |
| 13 | South Carolina | 4.5 | Above the U.S. rate of 3.3. |
| 14 | Indiana | 4.3 | Above the U.S. rate of 3.3. |
| 15 | Missouri | 4.2 | Above the U.S. rate of 3.3. |
| 16 | Kansas | 4.1 | Tied for rank 16. |
| 16 | North Carolina | 4.1 | Tied for rank 16. |
| 16 | Oklahoma | 4.1 | Tied for rank 16. |
| 19 | Texas | 3.9 | Above the U.S. rate of 3.3. |
| 20 | Kentucky | 3.7 | Tied for rank 20. |
| 20 | Utah | 3.7 | Tied for rank 20. |
| 20 | Wisconsin | 3.7 | Tied for rank 20. |
| 23 | Alabama | 3.6 | Tied for rank 23. |
| 23 | New Mexico | 3.6 | Tied for rank 23. |
| 25 | Georgia | 3.4 | Slightly above the U.S. rate. |
| 26 | Michigan | 3.3 | Matches the U.S. rate of 3.3. |
| 27 | Colorado | 3.2 | Below U.S. rate; tied for rank 27. |
| 27 | Maryland | 3.2 | Below U.S. rate; tied for rank 27. |
| 27 | Ohio | 3.2 | Below U.S. rate; tied for rank 27. |
| 27 | Virginia | 3.2 | Below U.S. rate; tied for rank 27. |
| 31 | Pennsylvania | 3.1 | Below the U.S. rate of 3.3. |
| 32 | Maine | 3.0 | Below the U.S. rate of 3.3. |
| 33 | Florida | 2.9 | Below U.S. rate; tied for rank 33. |
| 33 | Minnesota | 2.9 | Below U.S. rate; tied for rank 33. |
| 35 | Arizona | 2.8 | Below U.S. rate; tied for rank 35. |
| 35 | Washington | 2.8 | Below U.S. rate; tied for rank 35. |
| 37 | Hawaii | 2.7 | Below U.S. rate; tied for rank 37. |
| 37 | Illinois | 2.7 | Below U.S. rate; tied for rank 37. |
| 39 | Nebraska | 2.6 | Below U.S. rate; tied for rank 39. |
| 39 | Oregon | 2.6 | Below U.S. rate; tied for rank 39. |
| 41 | California | 2.4 | Below U.S. rate; tied for rank 41. |
| 41 | New York | 2.4 | Below U.S. rate; tied for rank 41. |
| 43 | Connecticut | 2.3 | Below U.S. rate; tied for rank 43. |
| 43 | Nevada | 2.3 | Below U.S. rate; tied for rank 43. |
| 45 | Vermont | 2.2 | Below the U.S. rate of 3.3. |
| 46 | Massachusetts | 2.1 | Below the U.S. rate of 3.3. |
| 47 | Delaware | 2.0 | Below the U.S. rate of 3.3. |
| 48 | New Jersey | 1.9 | Below the U.S. rate of 3.3. |
| 49 | New Hampshire | 1.7 | Below the U.S. rate of 3.3. |
| 50 | Rhode Island | 1.1 | Lowest published state rate. |
Source for every row: U.S. Bureau of Labor Statistics, Census of Fatal Occupational Injuries, 2024 state fatal injury rates. Equal published values receive the same rank. Alphabetical ordering within a tied group affects only display order.
What stands out in the state data
Wyoming is the clear high-end outlier
At 13.9, Wyoming's rate is 5.9 points above Mississippi's 8.0 and more than four times the national rate of 3.3.
Twelve states are at 5.0 or higher
The group extends from Wyoming at 13.9 through Idaho at 5.0. South Carolina follows at 4.5.
Michigan matches the national rate
Michigan's published rate is 3.3, the same as the nationwide BLS figure. Twenty-five states have higher published rates.
The statewide range is wide
Wyoming's 13.9 and Rhode Island's 1.1 are separated by 12.8 points. The ranking identifies that gap but does not attribute it to a single cause.
What these numbers can and cannot show
The state rate is most useful for comparing fatal occupational risk after accounting for the amount of work performed. That makes it more informative for cross-state comparisons than raw fatality counts, which are strongly affected by workforce size.
State economies do not contain the same mix of jobs. Agriculture, extraction, construction, transportation and other higher-risk activities account for different shares of employment from one state to another. A statewide rate therefore describes an outcome rather than a single explanation for that outcome.
The figures also do not establish employer fault or legal liability in an individual case. Those questions depend on the circumstances of the incident and the law that applies to it.
FAQ
Which state has the highest fatal workplace injury rate?
Wyoming has the highest published 2024 state rate at 13.9 fatal occupational injuries per 100,000 full-time equivalent workers.
What was the U.S. fatal work injury rate in 2024?
The national rate was 3.3 fatalities per 100,000 full-time equivalent workers. BLS recorded 5,070 fatal work injuries nationwide in 2024.
Are these 2026 fatality figures?
No. This is a 2026 snapshot using 2024 CFOI data released by BLS in February 2026. The ranking does not estimate workplace fatalities for 2025 or 2026.
Why use a rate instead of workplace death counts?
A rate adjusts for differences in hours worked. That makes it more suitable than a raw count for comparing states with very different workforce sizes.
How does BLS calculate the state fatality rate?
BLS divides fatal work injuries by total employee hours worked and multiplies by 200,000,000, representing 100,000 full-time equivalent workers working 40 hours per week for 50 weeks.
How are tied state rates ranked?
States with the same published BLS rate receive the same rank. Standard competition ranking is used, so the rank after a tied group skips the positions occupied by that group. Alphabetical order only determines how tied states are displayed.
Can 2024 rates be compared directly with state rates before 2007?
No. BLS switched to an hours-based state fatal injury rate in 2007. Earlier employment-based rates use a different methodology.
Does a high state rate prove employer negligence?
No. The statewide rate is an aggregate occupational safety measure. It does not identify the cause of an individual death or establish negligence, regulatory violations or legal liability.
Sources
U.S. Bureau of Labor Statistics — Fatal injury rates by state and industry, 2024
Primary source for all 50 state rates and for the BLS state-rate methodology, including the hours-based formula, worker exclusions and limitations of state comparisons.
Purpose: State values, unit definition and methodology.
https://www.bls.gov/iif/state-data/fatal-injury-rates-by-state-and-industry-2024.htm
U.S. Bureau of Labor Statistics — Census of Fatal Occupational Injuries Summary, 2024
National CFOI release reporting 5,070 fatal work injuries and a national fatal work injury rate of 3.3 per 100,000 full-time equivalent workers in 2024.
Purpose: National benchmark and release context.
U.S. Bureau of Labor Statistics — State fatal injury rates, 2007–2024
Historical BLS series documenting the modern hours-based state rate period and supporting comparisons within the post-2007 methodology.
Purpose: Historical comparability.
https://www.bls.gov/iif/state-data/fatal-injury-rates-by-state-2007-2024.htm
Related rankings
More StatRanker pages connected by topic, category or ranking theme.
California Cities by Wildfire Risk, 2026
Open rankingUS States by Job Growth in 2026
Open rankingUS States by Gasoline Prices, 2026 Snapshot
Open rankingTop Retail Companies by Revenue: 2026 Snapshot Based on Latest Available Data
Open ranking
StatRanker (Website)
administrator
