

Sugarcane Production by Country 2026: Official FAOSTAT 2024 Ranking
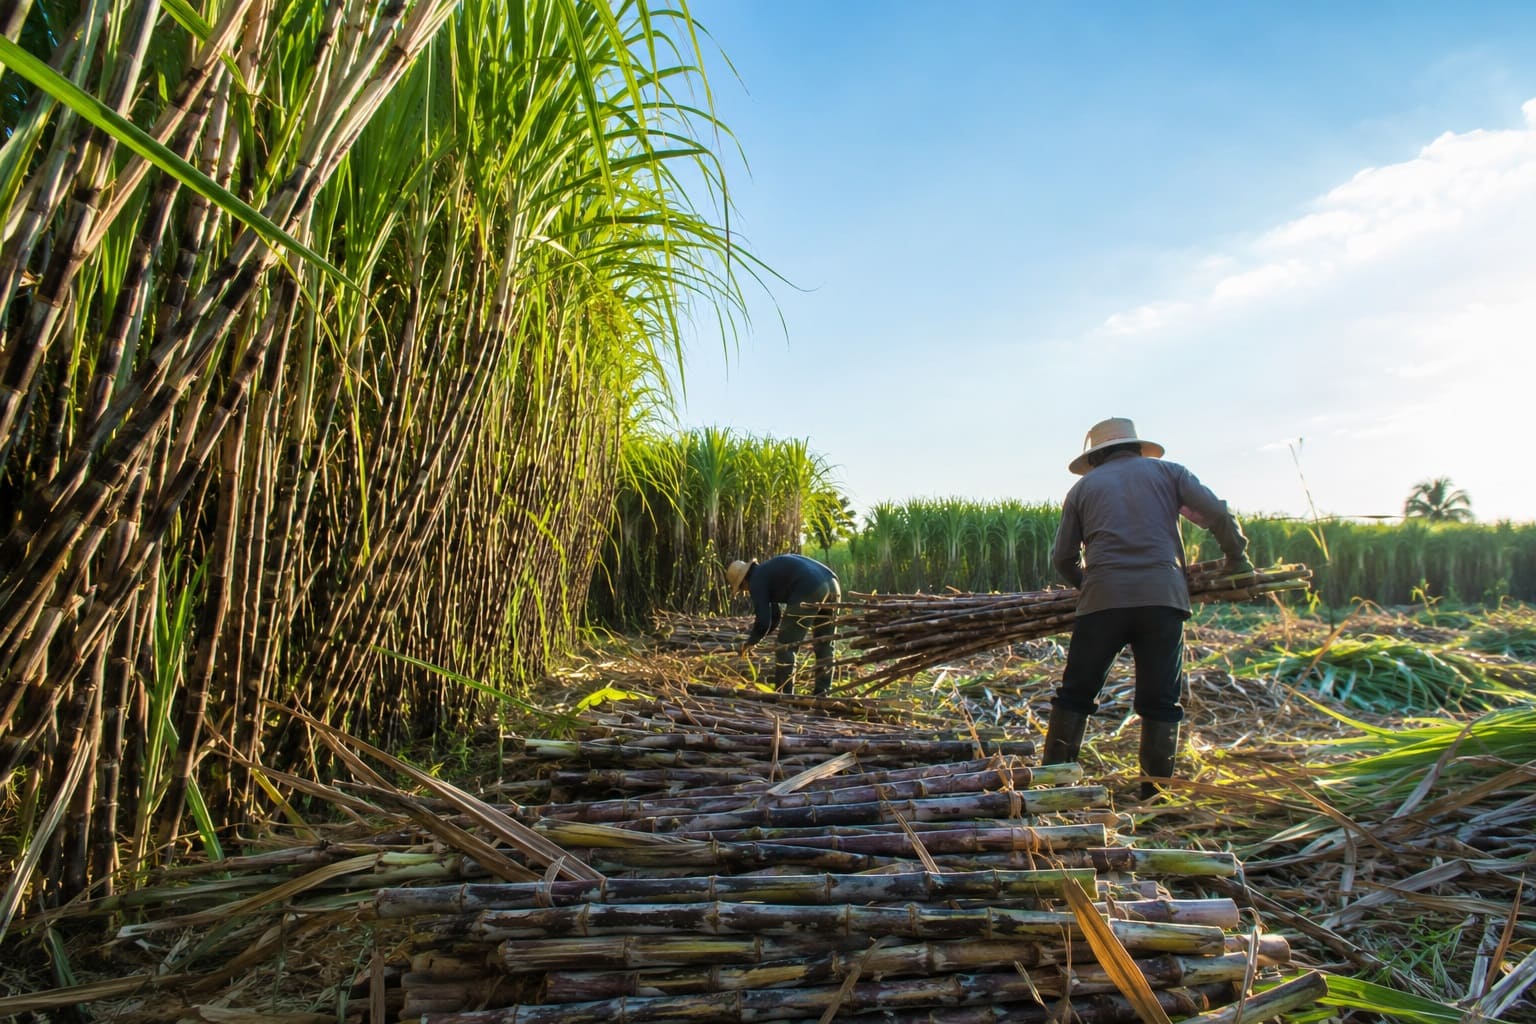
Sugarcane Production by Country: 2026 Snapshot Based on FAOSTAT 2024 Data
Brazil is the world's largest sugarcane producer in the 2024 FAOSTAT data used for this ranking, followed by India, China, Pakistan and Thailand. The metric is annual Sugar cane production, measured in tonnes and ranked from highest to lowest.
This is a 2026 snapshot based on official 2024 FAOSTAT data. The table covers the 50 largest confirmed country entries in the selected dataset. It does not combine sugar cane with sugar beet, raw sugar, refined sugar, exports, harvested area or yield.
All 50 rows are official_value observations for target year 2024. There are 0 official_forecast rows and 0 modeled_projection rows. Numeric ranking values come from FAOSTAT Crops and Livestock Products (Production).
Brazil ranks first with 759,662,482 tonnes in 2024.
India ranks second with 453,158,494 tonnes.
Fifty country entries are included in the published ranking.
50 official values · 0 forecasts · 0 modeled projections.
What sugarcane production measures
Agricultural output
Sugarcane production measures the harvested quantity of sugar cane produced during the year. FAOSTAT reports production in tonnes of the basic agricultural product.
Not processed sugar
The metric is different from raw or refined sugar output. Cane is an agricultural input to mills, while sugar is a processed commodity that can also be produced from sugar beet.
Not yield
A high production total does not automatically mean high productivity. Total output depends on harvested area and yield, so tonnes per hectare require a separate comparison.
How to read the rank
Higher tonnage ranks higher. The ranking uses the underlying numeric values before display rounding, so abbreviated million-tonne labels do not determine position.
Top 10 sugarcane-producing countries in 2024
Brazil and India form a clear top tier. China ranks third, while Pakistan and Thailand complete the five largest producers. The gap between India and China is especially large.
Top 10 countries by sugar cane production
| Rank | Entity | Value | Region / note |
|---|---|---|---|
| 1 | Brazil | 759.66M t | Americas; Official value; FAOSTAT; 2024. |
| 2 | India | 453.16M t | Asia; Official value; FAOSTAT; 2024. |
| 3 | China | 102.09M t | Asia; Official value; FAOSTAT; 2024. |
| 4 | Pakistan | 84.24M t | Asia; Official value; FAOSTAT; 2024. |
| 5 | Thailand | 82.44M t | Asia; Official value; FAOSTAT; 2024. |
| 6 | Mexico | 53.05M t | Americas; Official value; FAOSTAT; 2024. |
| 7 | Indonesia | 32.00M t | Asia; Official value; FAOSTAT; 2024. |
| 8 | Colombia | 31.86M t | Americas; Official value; FAOSTAT; 2024. |
| 9 | United States | 31.61M t | Americas; Official value; FAOSTAT; 2024. |
| 10 | Australia | 29.86M t | Oceania; Official value; FAOSTAT; 2024. |
Values are displayed in million tonnes. Rank is calculated from the full tonne value in descending order.
Top 20 sugarcane producers in 2024
The horizontal bars use Brazil as the 100% reference. India produces roughly three-fifths as much cane as Brazil, while the bars narrow sharply from China onward.
Methodology
Metric and unit
FAOSTAT item: Sugar cane. Element: Production. Unit: tonnes. The metric represents harvested crop production, not processed sugar output.
Target year
The target year is 2024. The page is labeled as a 2026 snapshot because 2024 is the latest available year used for this ranking.
Coverage and ranking
The page publishes the 50 largest confirmed country entries. Values are sorted from highest to lowest. Regional aggregates are not included as ranked entities.
Status treatment
All rows are official_value because the ranking uses published values from the official FAOSTAT source for the stated year. No future values are generated.
Conflict policy
The numeric ranking is single-source. Values are not averaged with other databases. FAO metadata is used to document the dataset definition and scope.
What the metric excludes
The ranking does not measure sugar beet, raw sugar, refined sugar, yield, harvested area, exports, domestic consumption, per-capita output or profitability.
Display formula: million tonnes = tonnes / 1,000,000. Rounding is applied after ranking.
Sugarcane production by country: Top 50
Search the ranking, filter by broad region or status, change the display order, or limit the results to the original Top 10 or Top 20 ranks.
Visible rows: 50
Top 50 countries by sugar cane production, 2024
| Rank | Entity | Value | Region / note |
|---|---|---|---|
| 1 | Brazil | 759.66M t | Americas; Official value; FAOSTAT; 2024. |
| 2 | India | 453.16M t | Asia; Official value; FAOSTAT; 2024. |
| 3 | China | 102.09M t | Asia; Official value; FAOSTAT; 2024. |
| 4 | Pakistan | 84.24M t | Asia; Official value; FAOSTAT; 2024. |
| 5 | Thailand | 82.44M t | Asia; Official value; FAOSTAT; 2024. |
| 6 | Mexico | 53.05M t | Americas; Official value; FAOSTAT; 2024. |
| 7 | Indonesia | 32.00M t | Asia; Official value; FAOSTAT; 2024. |
| 8 | Colombia | 31.86M t | Americas; Official value; FAOSTAT; 2024. |
| 9 | United States | 31.61M t | Americas; Official value; FAOSTAT; 2024. |
| 10 | Australia | 29.86M t | Oceania; Official value; FAOSTAT; 2024. |
| 11 | Guatemala | 22.91M t | Americas; Official value; FAOSTAT; 2024. |
| 12 | Philippines | 18.69M t | Asia; Official value; FAOSTAT; 2024. |
| 13 | South Africa | 16.74M t | Africa; Official value; FAOSTAT; 2024. |
| 14 | Egypt | 13.31M t | Africa; Official value; FAOSTAT; 2024. |
| 15 | Argentina | 12.26M t | Americas; Official value; FAOSTAT; 2024. |
| 16 | Peru | 12.04M t | Americas; Official value; FAOSTAT; 2024. |
| 17 | Myanmar | 12.00M t | Asia; Official value; FAOSTAT; 2024. |
| 18 | Vietnam | 11.84M t | Asia; Official value; FAOSTAT; 2024. |
| 19 | Bolivia | 11.45M t | Americas; Official value; FAOSTAT; 2024. |
| 20 | Kenya | 9.37M t | Africa; Official value; FAOSTAT; 2024. |
| 21 | Iran | 9.15M t | Asia; Official value; FAOSTAT; 2024. |
| 22 | Cuba | 9.05M t | Americas; Official value; FAOSTAT; 2024. |
| 23 | El Salvador | 7.31M t | Americas; Official value; FAOSTAT; 2024. |
| 24 | Nicaragua | 7.04M t | Americas; Official value; FAOSTAT; 2024. |
| 25 | Paraguay | 6.86M t | Americas; Official value; FAOSTAT; 2024. |
| 26 | Zimbabwe | 6.62M t | Africa; Official value; FAOSTAT; 2024. |
| 27 | Ecuador | 6.38M t | Americas; Official value; FAOSTAT; 2024. |
| 28 | Uganda | 6.10M t | Africa; Official value; FAOSTAT; 2024. |
| 29 | Honduras | 5.75M t | Americas; Official value; FAOSTAT; 2024. |
| 30 | Eswatini | 5.53M t | Africa; Official value; FAOSTAT; 2024. |
| 31 | Dominican Republic | 4.95M t | Americas; Official value; FAOSTAT; 2024. |
| 32 | Zambia | 4.89M t | Africa; Official value; FAOSTAT; 2024. |
| 33 | Sudan | 4.22M t | Africa; Official value; FAOSTAT; 2024. |
| 34 | Costa Rica | 4.14M t | Americas; Official value; FAOSTAT; 2024. |
| 35 | Venezuela | 3.66M t | Americas; Official value; FAOSTAT; 2024. |
| 36 | Tanzania | 3.34M t | Africa; Official value; FAOSTAT; 2024. |
| 37 | Madagascar | 3.16M t | Africa; Official value; FAOSTAT; 2024. |
| 38 | Malawi | 2.97M t | Africa; Official value; FAOSTAT; 2024. |
| 39 | Bangladesh | 2.93M t | Asia; Official value; FAOSTAT; 2024. |
| 40 | Nepal | 2.76M t | Asia; Official value; FAOSTAT; 2024. |
| 41 | DR Congo | 2.51M t | Africa; Official value; FAOSTAT; 2024. |
| 42 | Mauritius | 2.20M t | Africa; Official value; FAOSTAT; 2024. |
| 43 | Côte d'Ivoire | 2.16M t | Africa; Official value; FAOSTAT; 2024. |
| 44 | Panama | 1.85M t | Americas; Official value; FAOSTAT; 2024. |
| 45 | Mozambique | 1.79M t | Africa; Official value; FAOSTAT; 2024. |
| 46 | Belize | 1.67M t | Americas; Official value; FAOSTAT; 2024. |
| 47 | Laos | 1.64M t | Asia; Official value; FAOSTAT; 2024. |
| 48 | Haiti | 1.54M t | Americas; Official value; FAOSTAT; 2024. |
| 49 | Nigeria | 1.51M t | Africa; Official value; FAOSTAT; 2024. |
| 50 | Fiji | 1.33M t | Oceania; Official value; FAOSTAT; 2024. |
Top 10 and Top 20 always refer to the original ranking positions. Changing the sort order changes display order only; it does not redefine which countries belong to the Top 10 or Top 20.
Insights from the ranking
Key insight
Brazil and India dominate the ranking. Their 2024 output is on a different scale from the rest of the table, with a very large drop between India in second place and China in third.
Notable pattern
Four of the five largest producers are in Asia: India, China, Pakistan and Thailand. Brazil is the only non-Asian country in the Top 5.
Regional concentration
The Americas and Asia dominate the upper ranks, while African producers become more numerous through the middle of the Top 50. Australia and Fiji represent Oceania.
Outlier
Brazil is the strongest scale outlier. Its 759.66 million tonnes are more than seven times China's third-place output and more than 25 times Australia's tenth-place total.
What the ranking means
A measure of scale
A higher rank means a country harvested more sugar cane in 2024. It does not automatically mean higher yield, better processing efficiency or greater profitability.
Sugarcane is not sugar
Cane can be processed into sugar, ethanol, molasses and other products. Different processing choices mean cane output rankings need not match finished sugar rankings.
Annual values can move
Weather, harvested area, irrigation, pests and harvest conditions can shift crop output materially from one year to another.
Use separate metrics for productivity
For farming efficiency, compare tonnes per hectare. For market importance, use separate trade, processing or value indicators instead of total crop tonnage.
Download the Sugarcane Production by Country 2026: Official FAOSTAT 2024 Ranking dataset
Sugarcane Production by Country 2026: Official FAOSTAT 2024 Ranking
50 ranked entries · Excel + CSV + methodology + sources + chart · Snapshot: August 11, 2026 · Version 1.0
No signup required. The archive includes machine-readable data, methodology and source documentation. Quick human verification is required before the ZIP is delivered.
Download Excel + CSV Data PackFAQ
Which country produces the most sugarcane?
Brazil ranks first with 759,662,482 tonnes of sugar cane production in the 2024 values used for this ranking.
Which country is the second-largest sugarcane producer?
India ranks second with 453,158,494 tonnes in 2024.
Are these 2026 production figures?
No. This is a 2026 snapshot based on official FAOSTAT 2024 data. No modeled 2026 production values are included.
Is sugarcane production the same as sugar production?
No. Sugarcane production measures the harvested agricultural crop, while sugar production measures a processed product.
What unit is used?
The source unit is tonnes. Large values are abbreviated in million tonnes in the summary cards, Top 10 table and chart.
Does a higher production total mean a higher yield?
No. Total production combines harvested area and productivity. Yield requires a separate tonnes-per-hectare comparison.
Why does the table stop at 50?
This page is intentionally published as a Top 50 ranking and includes exactly 50 confirmed country entries rather than presenting an unsupported Top 100 label.
Sources
FAOSTAT — Crops and Livestock Products
Primary numeric source for Sugar cane, Production, 2024, measured in tonnes.
FAO Data Catalog — Crop production metadata
Official metadata reference for production definitions, units, dataset coverage and methodology.
https://data.fao.org/catalog/dataset/d24a448b-3b62-4c09-8c1d-4a39bb599876
Download data archive
ZIP archive with CSV and HTML copies of the tables published on this page, plus external source links, a manifest and README. The archive does not add new estimates or recalculate ranking values.
Related rankings
More StatRanker pages connected by topic, category or ranking theme.
