

Blueberry Production by Country 2026: Official FAOSTAT 2024 Ranking
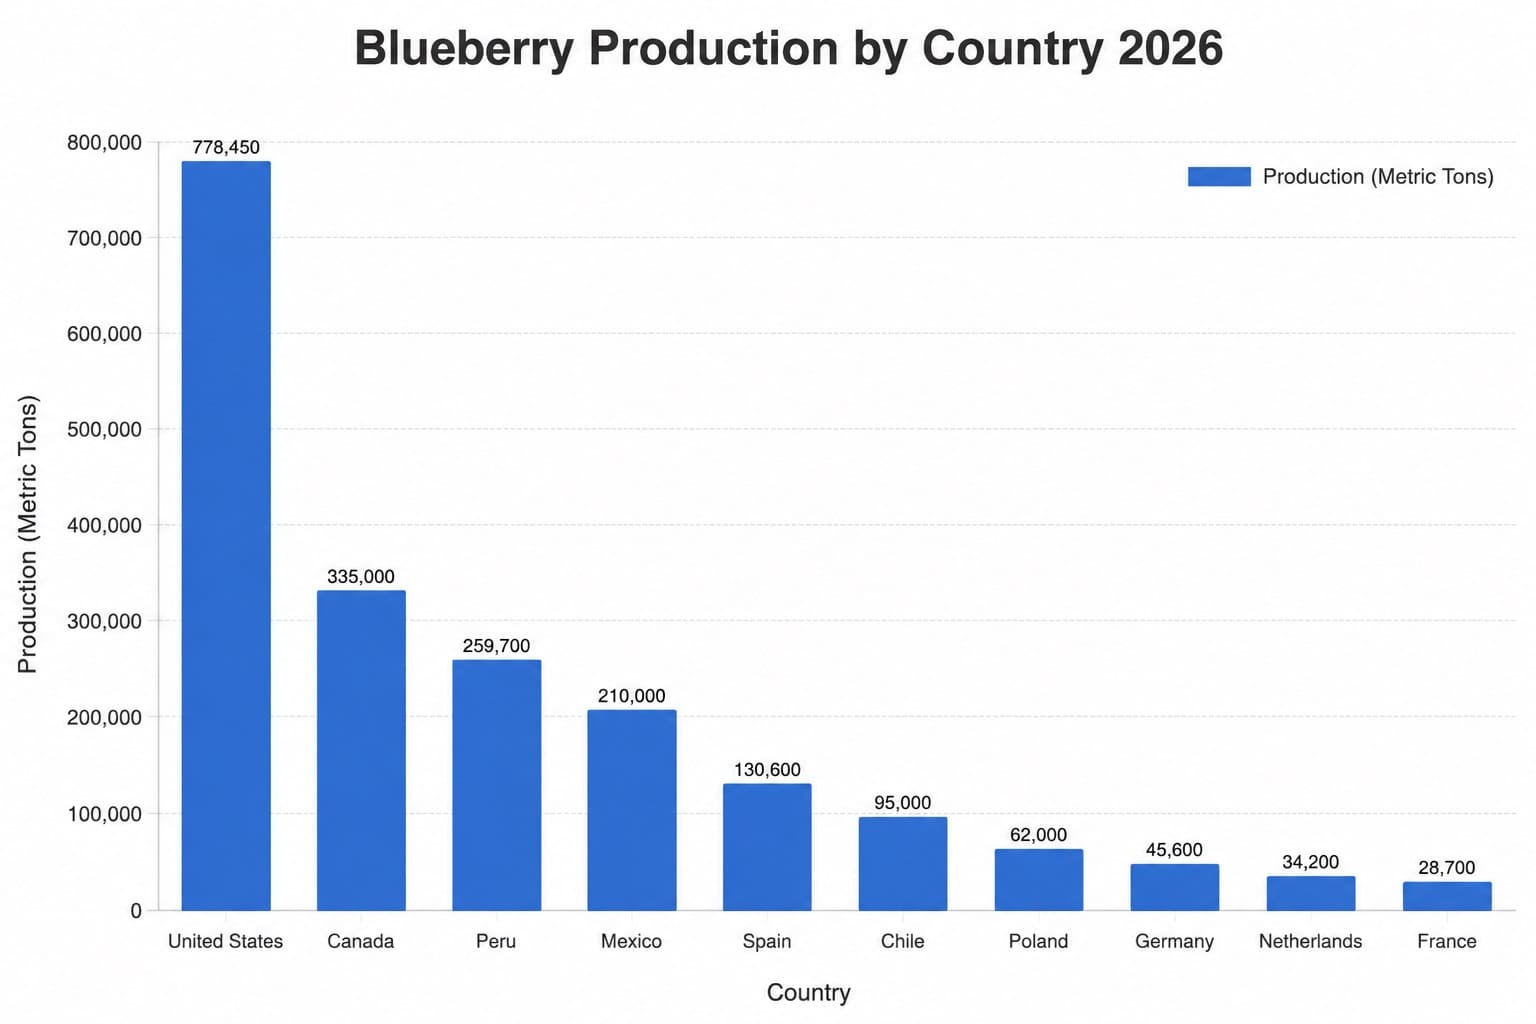
Blueberry Production Ranking Using FAOSTAT 2024 Data
The United States recorded the largest blueberry production value in FAOSTAT for 2024 at 401,970 tonnes. Peru ranked second with 353,600 tonnes, followed by Canada with 165,608 tonnes. The ranking uses the FAOSTAT item “Blueberries” and the element “Production Quantity,” with countries ordered from highest to lowest reported output.
This is a 2026 snapshot based on the latest FAOSTAT production year available, 2024. It is not a forecast for the 2026 harvest. The table includes 35 country-level rows with a positive published value; World, regional and economic-group aggregates are excluded from the ranking.
Unit: tonnes. Reference year: 2024. Direction: higher production ranks higher. “Official FAOSTAT ranking” means that FAOSTAT is the source database. Individual observations may carry different source flags.
Continue exploring
More StatRanker pages connected by topic, category or ranking theme.
The United States accounts for 28.9% of the sum of the included country rows.
Norway has the smallest positive value among the 35 ranked country rows.
Countries without a published 2024 value are not treated as zero-production countries.
The sum of the 35 displayed country values matches the FAOSTAT World row at whole-tonne precision.
Zimbabwe is the middle observation in the descending 35-country ranking.
The United States, Peru and Canada contribute 921,178 tonnes combined.
What the ranking measures
Production Quantity is the physical volume attributed to blueberry production during the reference year. The source unit is tonnes. The ranking therefore compares absolute output, not harvested area, yield per hectare, farm-gate value, profitability, exports or production per person.
Output is concentrated among a small group of countries. The United States and Peru contribute 755,570 tonnes together, or 54.3% of the included total. Adding Canada raises the top-three share to 66.2%, while the five largest values account for 78.9%.
The dataset should not be used as a direct measure of export power or domestic availability. Production can be consumed locally, processed, lost after harvest or exported, and those uses are not separated here. The dataset may not capture informal collection of wild berries that falls outside national agricultural reporting systems.
Top 10 countries by blueberry production
The five largest values are all in the Americas. Poland and Spain are the highest-ranked European countries, Morocco has the largest value among the African rows included, and Australia is the highest-ranked country from Oceania.
Top 10 country-level Production Quantity values, 2024
| Rank | Country | Production | Source note |
|---|---|---|---|
| 1 | United States | 401,970 tonnes | Americas · FAOSTAT 2024 |
| 2 | Peru | 353,600 tonnes | Americas · FAOSTAT 2024 |
| 3 | Canada | 165,608 tonnes | Americas · FAOSTAT 2024 |
| 4 | Chile | 97,219 tonnes | Americas · FAOSTAT 2024 |
| 5 | Mexico | 80,534 tonnes | Americas · FAOSTAT 2024 |
| 6 | Poland | 62,000 tonnes | Europe · FAOSTAT 2024 |
| 7 | Spain | 60,950 tonnes | Europe · FAOSTAT 2024 |
| 8 | Morocco | 53,751 tonnes | Africa · FAOSTAT 2024 |
| 9 | Australia | 27,540 tonnes | Oceania · FAOSTAT 2024 |
| 10 | Portugal | 22,850 tonnes | Europe · FAOSTAT 2024 |
Rank is calculated from the unrounded numeric value in descending order. Region labels are editorial groupings used only for navigation and are not FAOSTAT aggregate rows.
Chart: Top 20 reported production values
The bar chart uses the same values as the tables. The steep decline after the first three positions shows how concentrated the reported 2024 distribution is.
Methodology
The numeric ranking is drawn from one source: the FAOSTAT Crops and livestock products domain (QCL). The selection uses item Blueberries, item code 552, element Production Quantity, reference year 2024 and unit tonnes. No country value is projected to 2026.
Metric and direction
Metric: blueberry Production Quantity in tonnes. Countries are ranked in descending order, so a larger reported volume receives a higher rank.
Source year and retrieval date
The article is a 2026 presentation of the 2024 source year. FAO’s agricultural-production release dated December 31, 2025 confirms coverage through 2024. Data were retrieved from FAOSTAT on August 4, 2026.
Coverage
Included: 35 country-level rows with a positive published value for 2024. Excluded: World, continents, regions, income groups and other aggregates.
Missing values
A missing country row is not converted to zero. The ranking describes the published selection, not a claim that only 35 countries produced blueberries.
FAOSTAT flags
FAOSTAT maintains a separate observation flag that may identify an official figure, estimate, imputation or another source condition. The article does not overwrite that metadata or present every row as a nationally reported figure.
Data type
The table uses published 2024 FAOSTAT values. It contains no 2026 forecast and no article-created projection.
Region labels
Americas, Europe, Africa, Asia and Oceania are editorial major-region labels used for filtering. They are not added to the country values and do not affect rank.
Validation and rounding
Displayed values use whole tonnes. Their sum is 1,392,534 tonnes, equal to the FAOSTAT World value at this precision. Percentage shares are calculated from that total and rounded to one decimal place.
Ties and revisions
No equal values occur in this table. Future FAOSTAT revisions can change values and ranks, so comparisons with another page should use the same extraction year and database edition.
What the metric excludes
The ranking does not measure cultivar, quality, planted area, yield, cost, price, revenue, consumption, exports, environmental impact or informal collection outside the reporting framework.
Full ranking: blueberry production by country
Search for a country, filter by major region, change the order or limit the view to the Top 10 or Top 20.
35 entries shown
Country-level blueberry Production Quantity values, 2024
| Rank | Country | Production | Source note |
|---|---|---|---|
| 1 | United States | 401,970 tonnes | Americas · FAOSTAT 2024 |
| 2 | Peru | 353,600 tonnes | Americas · FAOSTAT 2024 |
| 3 | Canada | 165,608 tonnes | Americas · FAOSTAT 2024 |
| 4 | Chile | 97,219 tonnes | Americas · FAOSTAT 2024 |
| 5 | Mexico | 80,534 tonnes | Americas · FAOSTAT 2024 |
| 6 | Poland | 62,000 tonnes | Europe · FAOSTAT 2024 |
| 7 | Spain | 60,950 tonnes | Europe · FAOSTAT 2024 |
| 8 | Morocco | 53,751 tonnes | Africa · FAOSTAT 2024 |
| 9 | Australia | 27,540 tonnes | Oceania · FAOSTAT 2024 |
| 10 | Portugal | 22,850 tonnes | Europe · FAOSTAT 2024 |
| 11 | Germany | 15,090 tonnes | Europe · FAOSTAT 2024 |
| 12 | Italy | 10,360 tonnes | Europe · FAOSTAT 2024 |
| 13 | France | 8,621 tonnes | Europe · FAOSTAT 2024 |
| 14 | Netherlands | 6,910 tonnes | Europe · FAOSTAT 2024 |
| 15 | Romania | 5,000 tonnes | Europe · FAOSTAT 2024 |
| 16 | Russian Federation | 4,314 tonnes | Europe · FAOSTAT 2024 |
| 17 | New Zealand | 3,847 tonnes | Oceania · FAOSTAT 2024 |
| 18 | Zimbabwe | 3,631 tonnes | Africa · FAOSTAT 2024 |
| 19 | Austria | 1,910 tonnes | Europe · FAOSTAT 2024 |
| 20 | Lithuania | 1,070 tonnes | Europe · FAOSTAT 2024 |
| 21 | Croatia | 830 tonnes | Europe · FAOSTAT 2024 |
| 22 | Czechia | 740 tonnes | Europe · FAOSTAT 2024 |
| 23 | Switzerland | 703 tonnes | Europe · FAOSTAT 2024 |
| 24 | Uzbekistan | 666 tonnes | Asia · FAOSTAT 2024 |
| 25 | Belgium | 580 tonnes | Europe · FAOSTAT 2024 |
| 26 | Latvia | 500 tonnes | Europe · FAOSTAT 2024 |
| 27 | Slovenia | 400 tonnes | Europe · FAOSTAT 2024 |
| 28 | Bulgaria | 360 tonnes | Europe · FAOSTAT 2024 |
| 29 | Slovakia | 230 tonnes | Europe · FAOSTAT 2024 |
| 30 | Finland | 210 tonnes | Europe · FAOSTAT 2024 |
| 31 | Ukraine | 200 tonnes | Europe · FAOSTAT 2024 |
| 32 | Sweden | 120 tonnes | Europe · FAOSTAT 2024 |
| 33 | Denmark | 100 tonnes | Europe · FAOSTAT 2024 |
| 34 | Hungary | 80 tonnes | Europe · FAOSTAT 2024 |
| 35 | Norway | 40 tonnes | Europe · FAOSTAT 2024 |
Source selection: QCL · Blueberries · Production Quantity · 2024 · tonnes. FAOSTAT observation flags may differ by country and should be checked in the source dataset.
Insights from the ranking
Key insight
The United States leads Peru by 48,370 tonnes, but the two countries are much closer to each other than either is to third-ranked Canada.
Notable pattern
The five values from the Americas sum to 1,098,931 tonnes, or 78.9% of the included total. This concentration explains why the chart falls sharply after fifth place.
Regional concentration
Europe contributes 25 of the 35 country rows but 204,168 tonnes, or 14.7% of the included total. Poland and Spain provide 60.2% of Europe’s combined value.
Outlier
The largest value is about 10,049 times the smallest included value, showing that the table spans very different production scales.
How to interpret the ranking
The table is a comparison of reported production scale. A higher position means a larger 2024 Production Quantity value in the selected FAOSTAT dataset. It does not establish that a country is more profitable, more efficient or more important in international blueberry trade.
Production is not the same as market supply. The source does not divide output into fresh consumption, processing, post-harvest losses and exports. Separate trade datasets are required to compare exporters, while harvested area and yield are needed to study land use and productivity.
Annual agricultural values can move because of weather, mature acreage, yields, collection methods and database revisions. Long-term conclusions should therefore use a consistent multi-year series rather than one snapshot.
FAQ
Which country has the largest 2024 blueberry production value?
The United States ranks first with 401,970 tonnes, followed by Peru with 353,600 tonnes and Canada with 165,608 tonnes.
Are these production values for 2026?
No. The page is a 2026 snapshot of the latest available FAOSTAT production year, 2024. It does not estimate the 2026 harvest.
What does Production Quantity measure?
It measures the physical amount attributed to blueberry production during the reference year, expressed in tonnes. It is different from harvested area, yield, production value and exports.
Why are only 35 countries ranked?
The selection contains 35 country-level rows with a positive published 2024 value. A country not shown is not automatically assigned zero production.
Does FAOSTAT mark every row as an official national figure?
Not necessarily. FAOSTAT uses observation flags that can distinguish official figures, estimates, imputations and other source conditions. “Official FAOSTAT ranking” on this page refers to the database used, not a claim that all rows share the same flag.
Does the ranking include blueberry exports?
No. Production and exports are separate metrics. A country can be a major grower without exporting the same quantity, and a trading hub can rank differently in an export table.
Why are World and regional totals excluded?
They are aggregates rather than countries. Excluding them prevents mixed geographic levels and double counting. The World row is used only as a total-value check.
Why might another ranking show different numbers?
Common reasons include a different source year, a later FAOSTAT revision, another commodity definition, trade data instead of production, or the inclusion of regional aggregates.
Sources
FAOSTAT — Crops and livestock products
Primary numeric source for the country values, item, element, year and unit used in the ranking.
FAO — Agricultural production statistics 2010–2024
Release notice confirming that the agricultural production domain includes data through 2024.
FAOSTAT definitions and standards
Reference environment for item, element, unit and observation-flag definitions used when interpreting FAOSTAT records.
Related rankings
More StatRanker pages connected by topic, category or ranking theme.
Wheat Production by Country 2026: Official FAOSTAT 2024 Ranking
Open rankingCorn (Maize) Production by Country 2026: Top 50 Ranking
Open rankingTop 10 Radish Production Countries in 2025: A Comprehensive Analysis
Open rankingWorld leaders in fig production: Top 10 Countries in 2025
Open ranking
StatRanker (Website)
administrator
