

Tax-to-GDP Ratio by Country: 2026 Snapshot Based on OECD 2024 Provisional Data
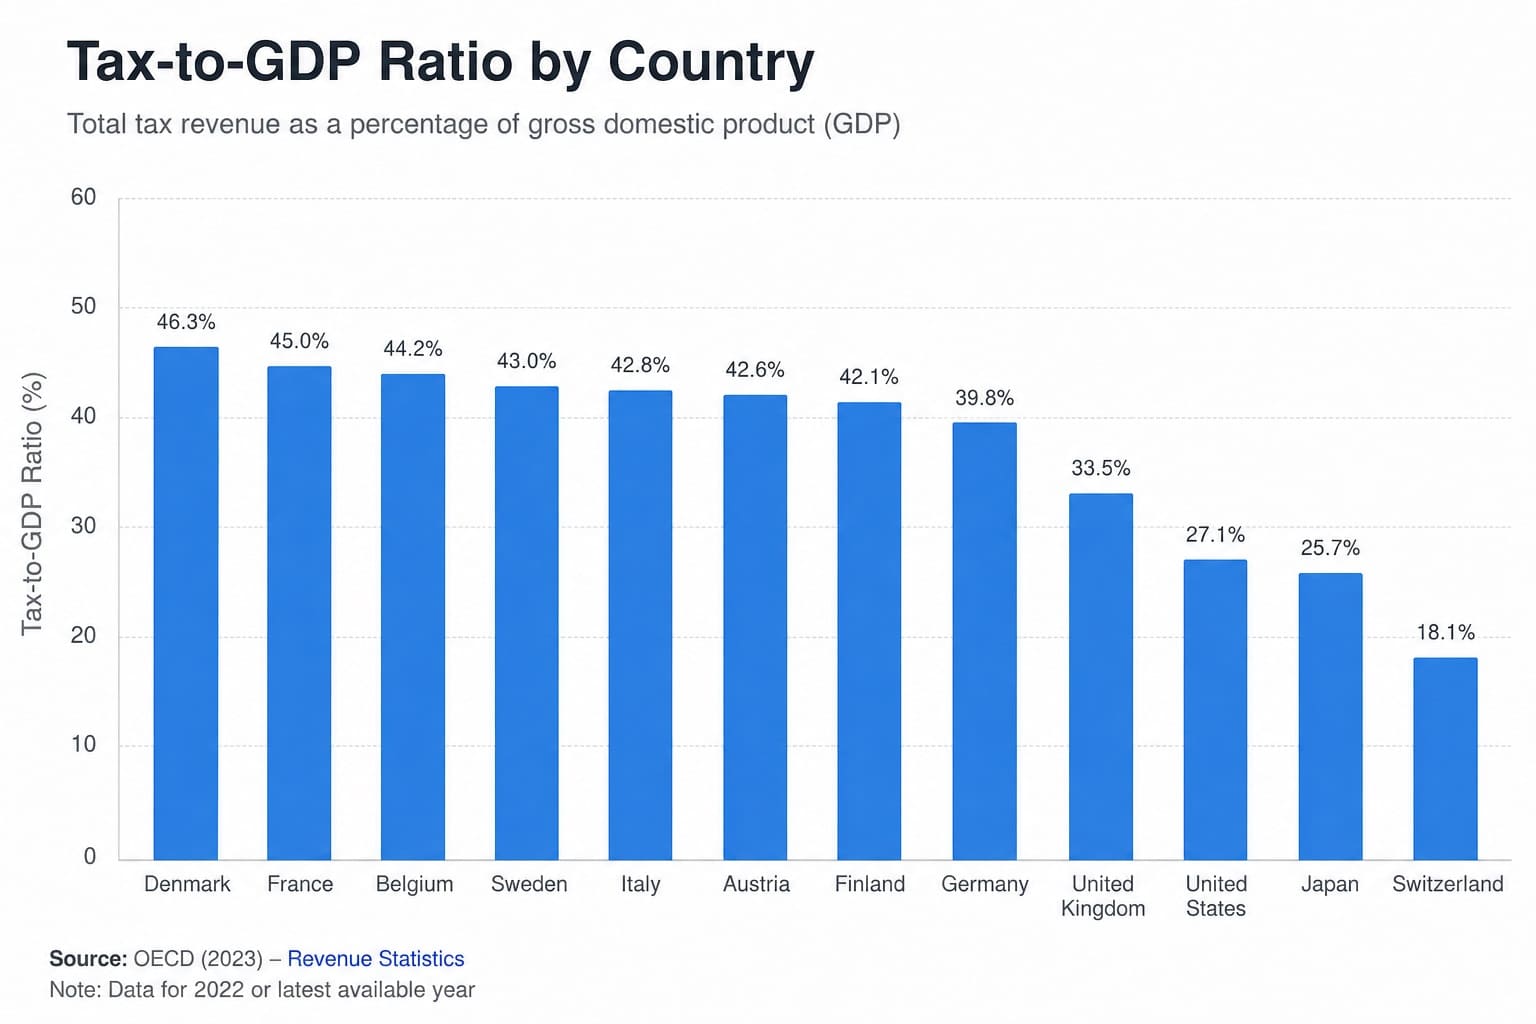
OECD Tax-to-GDP Ratios Based on Preliminary 2024 Results
Denmark recorded the highest preliminary tax-to-GDP ratio among the 36 OECD countries with complete 2024 results, at 45.2% of GDP. France followed at 43.5%, while Austria ranked third at 43.4%. Mexico recorded the lowest ratio in the confirmed dataset, at 18.3%.
The metric is total tax revenue collected by general government as a percentage of gross domestic product. Countries are ordered from the highest ratio to the lowest. The ranking describes the relative scale of tax collection and does not assume that a higher ratio represents a better tax system.
This is a 2026 StatRanker page snapshot based on OECD Revenue Statistics 2025 and its preliminary observations for 2024. Australia and Japan are excluded because complete preliminary 2024 ratios were unavailable. No older-year country values are substituted into the 2024 ranking, and no third-party estimates are used.
Continue exploring
More StatRanker rankings on public finance, tax burden, debt and government spending.
Top OECD Countries by Tax Wedge on Labor, 2025
Open rankingTOP 30 Countries by Tax-to-GDP Ratio (2025)
Open rankingCountries by Government Debt-to-GDP Ratio 2025
Open rankingDenmark recorded the highest preliminary 2024 tax-to-GDP ratio in the confirmed OECD dataset.
Mexico recorded the lowest ratio among the 36 countries with complete preliminary 2024 values.
The OECD estimated that the average ratio increased by 0.3 percentage point in 2024.
Australia and Japan are omitted because their complete preliminary 2024 ratios were unavailable.
Every included row is an official OECD preliminary observation for 2024. No forecasts or modeled estimates are included.
What the Tax-to-GDP Ratio Measures
The tax-to-GDP ratio compares aggregate tax revenue with the total value of economic output. Under the OECD definition, taxes are compulsory, unrequited payments to general government or a supranational authority. Compulsory social security contributions paid to general government are included.
The ratio provides a standardized measure of the size of tax revenues relative to the economy. It does not show the tax rate faced by a particular household or company. It also does not measure how evenly the tax burden is distributed, how effectively revenue is collected, how efficiently public funds are spent or what services residents receive in return.
OECD Revenue Statistics 2025 reports that the preliminary OECD average reached 34.1% of GDP in 2024, an increase of 0.3 percentage point from 2023. Ratios increased in 22 countries, declined in 13 and remained unchanged in one.
OECD average calculation: the preliminary OECD average of 34.1% is not a simple average of only the 36 country values shown in this ranking. The OECD calculated the preliminary 2024 average by applying the unweighted average percentage change for the 36 reporting countries to the overall OECD average tax-to-GDP ratio for 2023.
Top 10 OECD Countries by Tax Revenue Share of GDP
Nine countries recorded preliminary tax-to-GDP ratios of at least 40%. Denmark led at 45.2%, while only 0.1 percentage point separated France and Austria in second and third place.
Top 10 confirmed OECD tax-to-GDP ratios, preliminary 2024 values
| Rank | Country | Ratio | Source / note |
|---|---|---|---|
| 1 | Denmark | 45.2% | OECD Revenue Statistics 2025; preliminary 2024 value. |
| 2 | France | 43.5% | OECD Revenue Statistics 2025; preliminary 2024 value. |
| 3 | Austria | 43.4% | OECD Revenue Statistics 2025; preliminary 2024 value. |
| 4 | Italy | 42.8% | OECD Revenue Statistics 2025; preliminary 2024 value. |
| 5 | Belgium | 42.6% | OECD Revenue Statistics 2025; preliminary 2024 value. |
| 6 | Finland | 42.2% | OECD Revenue Statistics 2025; preliminary 2024 value. |
| 7 | Luxembourg | 41.5% | OECD Revenue Statistics 2025; preliminary 2024 value. |
| 8 | Sweden | 41.4% | OECD Revenue Statistics 2025; preliminary 2024 value. |
| 9 | Norway | 40.2% | OECD Revenue Statistics 2025; preliminary 2024 value. |
| 10 | Greece | 39.8% | OECD Revenue Statistics 2025; preliminary 2024 value. |
Countries are sorted by the reported percentage in descending order. Where two countries have the same one-decimal value, alphabetical order determines their sequential display position.
Top 20 Preliminary Tax-to-GDP Ratios
The chart uses the same values as the ranking table. Bar lengths are scaled against Denmark's 45.2% ratio, while the labels show the reported percentage of GDP.
Methodology and Data Limits
The source is OECD Revenue Statistics 2025. The metric is total tax revenue as a percentage of GDP, the reference year is 2024 and the ranking direction is descending. All included observations are official OECD figures identified as preliminary.
Metric and Formula
The tax-to-GDP ratio equals aggregate tax revenue divided by gross domestic product, multiplied by 100. Values are presented to one decimal place, following the OECD table.
Included Countries
The ranking contains every OECD member for which the publication provides a complete preliminary 2024 tax-to-GDP ratio. This produces 36 confirmed country rows.
Excluded Countries
Australia is excluded because preliminary tax data for 2024 were unavailable. Japan is excluded because preliminary compulsory social security contribution data were unavailable. Their 2023 values are not substituted.
Preliminary Status
The values may be revised when national authorities update tax receipts, social security contributions or GDP. The ranking should therefore be read as a dated preliminary comparison.
Ties and Display Order
Countries are sorted by the reported ratio. Equal one-decimal values are shown in alphabetical order to maintain a stable sequential table without implying a measurable difference.
OECD Average
The preliminary OECD average of 34.1% was calculated by applying the unweighted average percentage change for the 36 reporting countries to the overall OECD average tax-to-GDP ratio for 2023.
Reporting Periods
Most country observations follow calendar-year reporting. New Zealand's tax reporting year does not coincide fully with the calendar year, which should be considered when interpreting annual comparisons.
Source Boundary
Only OECD-reported preliminary observations for 2024 are used in the country ranking.
The OECD tax definition includes taxes on income and profits, compulsory social security contributions, payroll, property, goods and services, and other taxes covered by the OECD classification. The ratio does not measure statutory tax rates, household tax burdens, corporate effective tax rates, tax incidence, public spending, fiscal balance or service quality.
Complete OECD Ranking and Country Values
The complete table below covers all 36 OECD countries with available preliminary 2024 values.
OECD members ranked by preliminary 2024 tax revenue as a percentage of GDP
| Rank | Country | Ratio | Source / note |
|---|---|---|---|
| 1 | Denmark | 45.2% | OECD Revenue Statistics 2025; preliminary 2024 value. |
| 2 | France | 43.5% | OECD Revenue Statistics 2025; preliminary 2024 value. |
| 3 | Austria | 43.4% | OECD Revenue Statistics 2025; preliminary 2024 value. |
| 4 | Italy | 42.8% | OECD Revenue Statistics 2025; preliminary 2024 value. |
| 5 | Belgium | 42.6% | OECD Revenue Statistics 2025; preliminary 2024 value. |
| 6 | Finland | 42.2% | OECD Revenue Statistics 2025; preliminary 2024 value. |
| 7 | Luxembourg | 41.5% | OECD Revenue Statistics 2025; preliminary 2024 value. |
| 8 | Sweden | 41.4% | OECD Revenue Statistics 2025; preliminary 2024 value. |
| 9 | Norway | 40.2% | OECD Revenue Statistics 2025; preliminary 2024 value. |
| 10 | Greece | 39.8% | OECD Revenue Statistics 2025; preliminary 2024 value. |
| 11 | Netherlands | 38.5% | OECD Revenue Statistics 2025; preliminary 2024 value. |
| 12 | Slovenia | 38.3% | OECD Revenue Statistics 2025; preliminary 2024 value. |
| 13 | Germany | 38.0% | OECD Revenue Statistics 2025; preliminary 2024 value. |
| 14 | Iceland | 36.9% | OECD Revenue Statistics 2025; preliminary 2024 value. |
| 15 | Spain | 36.7% | OECD Revenue Statistics 2025; preliminary 2024 value. |
| 16 | Poland | 36.6% | OECD Revenue Statistics 2025; preliminary 2024 value. |
| 17 | Slovak Republic | 35.6% | OECD Revenue Statistics 2025; preliminary 2024 value. |
| 18 | Estonia | 35.2% | OECD Revenue Statistics 2025; preliminary 2024 value. |
| 19 | Portugal | 35.1% | OECD Revenue Statistics 2025; preliminary 2024 value. |
| 20 | Canada | 34.9% | OECD Revenue Statistics 2025; preliminary 2024 value; tied value ordered alphabetically. |
| 21 | Latvia | 34.9% | OECD Revenue Statistics 2025; preliminary 2024 value; tied value ordered alphabetically. |
| 22 | Hungary | 34.4% | OECD Revenue Statistics 2025; preliminary 2024 value; tied value ordered alphabetically. |
| 23 | United Kingdom | 34.4% | OECD Revenue Statistics 2025; preliminary 2024 value; tied value ordered alphabetically. |
| 24 | Czechia | 34.0% | OECD Revenue Statistics 2025; preliminary 2024 value. |
| 25 | Lithuania | 33.1% | OECD Revenue Statistics 2025; preliminary 2024 value. |
| 26 | New Zealand | 32.9% | OECD Revenue Statistics 2025; preliminary 2024 value; reporting-year caveat applies. |
| 27 | Israel | 30.9% | OECD Revenue Statistics 2025; preliminary 2024 value. |
| 28 | Switzerland | 27.2% | OECD Revenue Statistics 2025; preliminary 2024 value. |
| 29 | United States | 25.6% | OECD Revenue Statistics 2025; preliminary 2024 value. |
| 30 | Korea | 25.3% | OECD Revenue Statistics 2025; preliminary 2024 value. |
| 31 | Costa Rica | 24.8% | OECD Revenue Statistics 2025; preliminary 2024 value. |
| 32 | Türkiye | 24.0% | OECD Revenue Statistics 2025; preliminary 2024 value. |
| 33 | Ireland | 21.7% | OECD Revenue Statistics 2025; preliminary 2024 value. |
| 34 | Chile | 20.5% | OECD Revenue Statistics 2025; preliminary 2024 value. |
| 35 | Colombia | 19.9% | OECD Revenue Statistics 2025; preliminary 2024 value. |
| 36 | Mexico | 18.3% | OECD Revenue Statistics 2025; preliminary 2024 value. |
All 36 values are preliminary OECD observations for 2024. Australia and Japan are not included because complete preliminary ratios were unavailable.
Key Findings From the OECD Data
Largest Annual Increase
Latvia recorded the largest increase in the OECD's preliminary comparison, rising by 2.4 percentage points from 2023 to 2024.
Largest Annual Decline
Colombia recorded the largest decrease, falling by 2.2 percentage points. Its 2024 ratio was 19.9%, the second-lowest value in the table.
Distribution Around the Average
Twenty-three of the 36 countries recorded ratios above the 34.1% preliminary OECD average, while 13 were below it.
Wide OECD Range
The difference between Denmark's 45.2% and Mexico's 18.3% was 26.9 percentage points, reflecting major differences in national tax structures and revenue systems.
How to Interpret the Ranking
A country's position reflects the amount of tax revenue collected relative to GDP. A higher ratio may result from broader tax bases, higher effective collection, larger compulsory social security contributions or a greater public-sector role. The ranking alone cannot identify which factor is responsible.
The ratio should not be treated as a direct measure of tax competitiveness or household burden. Two countries with similar tax-to-GDP ratios can rely on very different combinations of personal income taxes, corporate taxes, social security contributions, consumption taxes and property taxes.
The 2026 label refers to the date of this StatRanker page snapshot. The underlying OECD publication was released in 2025 and reports preliminary results for 2024. The values are historical observations subject to revision, not forecasts for 2026.
Frequently Asked Questions
Which OECD country had the highest tax-to-GDP ratio in 2024?
Denmark recorded the highest preliminary ratio at 45.2% of GDP, followed by France at 43.5% and Austria at 43.4%.
Which country had the lowest ratio?
Mexico recorded the lowest confirmed preliminary ratio at 18.3% of GDP. Colombia was second-lowest at 19.9%.
Is this a worldwide ranking?
No. The table covers only OECD member countries with complete preliminary 2024 values in OECD Revenue Statistics 2025.
Why are Australia and Japan missing?
Australia lacked preliminary 2024 tax data, while Japan lacked preliminary compulsory social security contribution data. Their older values were not inserted into the 2024 comparison.
What was the OECD average in 2024?
The OECD reported a preliminary average of 34.1% of GDP, 0.3 percentage point higher than in 2023.
Does a higher ratio mean that a country has higher personal tax rates?
No. The ratio combines many tax categories and compares their total revenue with GDP. It does not directly show personal income tax rates or the burden on a specific taxpayer.
Are social security contributions included?
Yes. Compulsory social security contributions paid to general government are classified as taxes in the OECD Revenue Statistics framework.
Are the 2024 figures final?
No. The included values are preliminary and may change after revisions to national revenue or GDP statistics.
Were any forecasts or outside estimates added?
No. Every country value comes from OECD Revenue Statistics 2025. The ranking contains no modeled 2026 figures or third-party estimates.
Sources
OECD Revenue Statistics 2025
Primary OECD publication for the tax-to-GDP framework, country coverage and preliminary 2024 results.
https://www.oecd.org/en/publications/revenue-statistics-2025_3a264267-en.html
Tax Revenue Trends, 1965–2024
Official chapter containing the country values, OECD average methodology, annual changes and availability notes.
OECD Data Explorer
Official OECD data environment for Revenue Statistics indicators and longer country time series.
OECD Press Release on 2024 Tax Revenue
Official summary of the 2024 OECD average, country coverage and main annual movements.
Related rankings
More StatRanker rankings on public finance, tax burden, debt and government spending.
Top 99 Countries by Net Average Salary After Tax, 2026
Open rankingCountries and Territories with the Lowest Corporate Tax Headline Rates: 2026 Snapshot
Open rankingTop Retail Companies by Revenue: 2026 Snapshot Based on Latest Available Data
Open rankingTop 100 Insurance Companies by Revenue, 2026
Open ranking
StatRanker (Website)
administrator
