

Potato Production by Country 2026: FAOSTAT 2024 Ranking
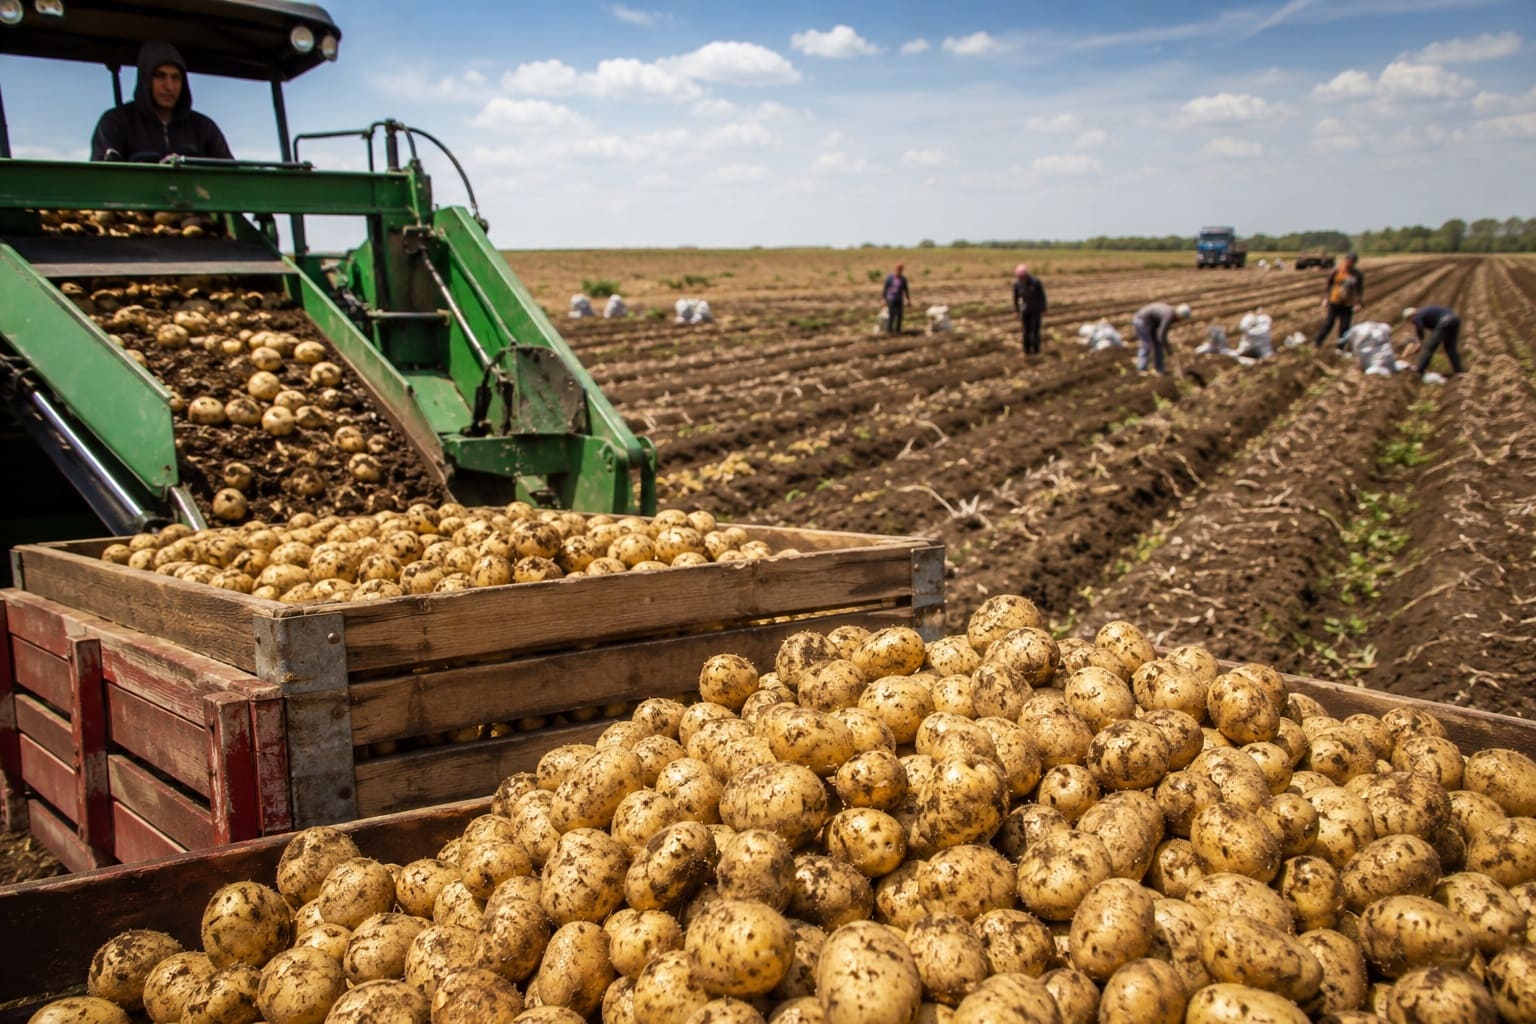
Potato production by country: 2026 snapshot based on 2024 FAOSTAT data
China is the largest potato producer in the 2024 FAOSTAT-based series, followed by India and Ukraine. The ranking measures annual production of the FAOSTAT item Potatoes, expressed in tonnes and ordered from highest to lowest output.
This is a 2026 snapshot based on 2024 historical production data, not a forecast of 2026 output. Sweet potatoes are excluded because FAOSTAT records them as a separate commodity.
The table is a compiled research dataset based on five cited sources. FAOSTAT is the original statistical source, while the processed Our World in Data series is used to retrieve and standardize the 2024 values. FAO and OWID documentation provide definitions, source information and processing notes. Row-level source, year and analytical-region notes are shown in the ranking table.
Continue exploring
More StatRanker pages connected by topic, category or ranking theme.
Coverage: Top 100 included 2024 entries · Unit: tonnes · Direction: higher production ranks higher · Historical rows: 100 · Official forecasts: 0 · Modeled projections: 0.
China recorded 94,806,520 tonnes in 2024.
India recorded 57,053,344 tonnes.
Lesotho is the 100th entry in the ranking.
All ranked observations use the same reference year and production unit.
No forecast or modeled 2026 values are mixed into the ranking.
Overview: what potato production measures
Potato production measures the quantity produced during the year. This ranking compares absolute agricultural output rather than yield, harvested area, exports, consumption or production per person.
China and India form a clear leading group. Together they account for 151,859,864 tonnes among the Top 100 entries shown here. Ukraine ranks third with 21,128,900 tonnes, followed by the United States and the Russian Federation.
The ten largest producers in the table total about 259.6 million tonnes. The sharp difference between India and Ukraine shows that production is especially concentrated in the first two positions.
Production should not be confused with yield. A country can record a large harvest because it cultivates a large area, because yields are high, or because both factors contribute.
Sweet potatoes are excluded from every value, chart and calculation on this page.
Top 10 potato-producing countries in 2024
China produced about 1.66 times as many potatoes as India and roughly 4.49 times Ukraine's output. The United States and the Russian Federation complete the Top 5.
Top 10 producers by potato production quantity, 2024
| Rank | Entity | Value | Source / Method Note |
|---|---|---|---|
| 1 | China | 94,806,520 t | Status: historical value; source: FAOSTAT via OWID; year: 2024; region: Asia. |
| 2 | India | 57,053,344 t | Status: historical value; source: FAOSTAT via OWID; year: 2024; region: Asia. |
| 3 | Ukraine | 21,128,900 t | Status: historical value; source: FAOSTAT via OWID; year: 2024; region: Europe. |
| 4 | United States | 19,061,860 t | Status: historical value; source: FAOSTAT via OWID; year: 2024; region: Americas. |
| 5 | Russian Federation | 18,448,002 t | Status: historical value; source: FAOSTAT via OWID; year: 2024; region: Europe. |
| 6 | Germany | 12,703,300 t | Status: historical value; source: FAOSTAT via OWID; year: 2024; region: Europe. |
| 7 | Bangladesh | 10,601,182 t | Status: historical value; source: FAOSTAT via OWID; year: 2024; region: Asia. |
| 8 | France | 9,237,460 t | Status: historical value; source: FAOSTAT via OWID; year: 2024; region: Europe. |
| 9 | Pakistan | 8,434,370 t | Status: historical value; source: FAOSTAT via OWID; year: 2024; region: Asia. |
| 10 | Egypt | 8,082,291 t | Status: historical value; source: FAOSTAT via OWID; year: 2024; region: Africa. |
Values are ranked from highest to lowest production. Broad region labels are analytical filters used on this page and are not FAO statistical classifications.
Top 20 potato producers
The chart uses the same 2024 production values as the ranking table. China is the reference for bar length.
Methodology
Metric and unit
The metric is annual production for the FAOSTAT item Potatoes. Values are expressed in tonnes.
Reference year
Every ranked row uses 2024. Missing 2024 values are not replaced with observations from earlier years, and no 2026 estimate is added.
Ranking rule
Higher production ranks higher. Rank is calculated from the underlying numeric value before display rounding.
Primary statistical source
FAOSTAT Crops and livestock products is the original statistical source for the potato-production series used in this ranking.
Data access
The 2024 values are accessed through the Our World in Data potato-production series. OWID identifies the Food and Agriculture Organization of the United Nations as the original producer and applies processing before publication.
Value status
Each row is marked as historical_value. This means the number is an observed historical production value from the FAOSTAT-based dataset used for the ranking. It is not an official forecast and not a modeled projection.
FAOSTAT observation flags
FAOSTAT maintains a separate flag field for observation provenance and statistical treatment. Depending on the observation, a value can be identified as an official figure, estimate, imputation, provisional value or another source treatment. Those individual flags are not reproduced in the ranking table and are therefore not inferred here.
Regional grouping
Asia, Europe, Africa, the Americas and Oceania are broad analytical labels used only for filtering and summary comparisons on this page. They should not be interpreted as official FAO statistical classifications.
Country labels
Some geographic names are standardized for readable display. Label harmonization does not change the numeric production value used for ranking.
Coverage
The table publishes the 100 largest included 2024 country and territory values. World, regional and income-group aggregates are excluded from the country ranking.
Missing values
Only entries with a 2024 production value in the selected series are eligible. A missing 2024 observation is not replaced with a value from another year.
Conflicts
Competing values from different providers are not averaged. FAOSTAT remains the original numeric source, while FAO and OWID documentation are used for definitions and processing context.
Rounding
Fractional tonnes are rounded to the nearest whole tonne for display.
Commodity boundary
Sweet potatoes are excluded. Harvested area, yield, exports, imports, consumption and processed potato products are also outside the ranking metric.
Interpretation limits
Absolute production does not measure farm efficiency, crop quality, profitability, food availability or output per person.
Source hierarchy: FAOSTAT production statistics → official FAO definitions and metadata → OWID processed FAOSTAT series and processing documentation.
Potato production ranking: Top 100
Top 100 potato producers by 2024 production quantity
| Rank | Entity | Value | Source / Method Note |
|---|---|---|---|
| 1 | China | 94,806,520 t | Status: historical value; source: FAOSTAT via OWID; year: 2024; region: Asia. |
| 2 | India | 57,053,344 t | Status: historical value; source: FAOSTAT via OWID; year: 2024; region: Asia. |
| 3 | Ukraine | 21,128,900 t | Status: historical value; source: FAOSTAT via OWID; year: 2024; region: Europe. |
| 4 | United States | 19,061,860 t | Status: historical value; source: FAOSTAT via OWID; year: 2024; region: Americas. |
| 5 | Russian Federation | 18,448,002 t | Status: historical value; source: FAOSTAT via OWID; year: 2024; region: Europe. |
| 6 | Germany | 12,703,300 t | Status: historical value; source: FAOSTAT via OWID; year: 2024; region: Europe. |
| 7 | Bangladesh | 10,601,182 t | Status: historical value; source: FAOSTAT via OWID; year: 2024; region: Asia. |
| 8 | France | 9,237,460 t | Status: historical value; source: FAOSTAT via OWID; year: 2024; region: Europe. |
| 9 | Pakistan | 8,434,370 t | Status: historical value; source: FAOSTAT via OWID; year: 2024; region: Asia. |
| 10 | Egypt | 8,082,291 t | Status: historical value; source: FAOSTAT via OWID; year: 2024; region: Africa. |
| 11 | Türkiye | 6,900,000 t | Status: historical value; source: FAOSTAT via OWID; year: 2024; region: Asia. |
| 12 | Peru | 6,579,754 t | Status: historical value; source: FAOSTAT via OWID; year: 2024; region: Americas. |
| 13 | Canada | 6,511,540 t | Status: historical value; source: FAOSTAT via OWID; year: 2024; region: Americas. |
| 14 | Netherlands | 6,366,750 t | Status: historical value; source: FAOSTAT via OWID; year: 2024; region: Europe. |
| 15 | Poland | 5,920,170 t | Status: historical value; source: FAOSTAT via OWID; year: 2024; region: Europe. |
| 16 | United Kingdom | 5,515,533 t | Status: historical value; source: FAOSTAT via OWID; year: 2024; region: Europe. |
| 17 | Algeria | 4,596,493 t | Status: historical value; source: FAOSTAT via OWID; year: 2024; region: Africa. |
| 18 | Brazil | 4,183,933 t | Status: historical value; source: FAOSTAT via OWID; year: 2024; region: Americas. |
| 19 | Ethiopia | 4,089,166 t | Status: historical value; source: FAOSTAT via OWID; year: 2024; region: Africa. |
| 20 | Belgium | 3,977,850 t | Status: historical value; source: FAOSTAT via OWID; year: 2024; region: Europe. |
| 21 | Uzbekistan | 3,716,862 t | Status: historical value; source: FAOSTAT via OWID; year: 2024; region: Asia. |
| 22 | Nepal | 3,521,794 t | Status: historical value; source: FAOSTAT via OWID; year: 2024; region: Asia. |
| 23 | Belarus | 3,110,894 t | Status: historical value; source: FAOSTAT via OWID; year: 2024; region: Europe. |
| 24 | Denmark | 2,997,600 t | Status: historical value; source: FAOSTAT via OWID; year: 2024; region: Europe. |
| 25 | Iran | 2,921,904 t | Status: historical value; source: FAOSTAT via OWID; year: 2024; region: Asia. |
| 26 | Kazakhstan | 2,634,610 t | Status: historical value; source: FAOSTAT via OWID; year: 2024; region: Asia. |
| 27 | South Africa | 2,623,499 t | Status: historical value; source: FAOSTAT via OWID; year: 2024; region: Africa. |
| 28 | Colombia | 2,492,099 t | Status: historical value; source: FAOSTAT via OWID; year: 2024; region: Americas. |
| 29 | Japan | 2,236,459 t | Status: historical value; source: FAOSTAT via OWID; year: 2024; region: Asia. |
| 30 | Morocco | 2,194,126 t | Status: historical value; source: FAOSTAT via OWID; year: 2024; region: Africa. |
| 31 | Kenya | 2,188,110 t | Status: historical value; source: FAOSTAT via OWID; year: 2024; region: Africa. |
| 32 | Mexico | 2,123,718 t | Status: historical value; source: FAOSTAT via OWID; year: 2024; region: Americas. |
| 33 | Argentina | 2,111,561 t | Status: historical value; source: FAOSTAT via OWID; year: 2024; region: Americas. |
| 34 | Spain | 1,971,170 t | Status: historical value; source: FAOSTAT via OWID; year: 2024; region: Europe. |
| 35 | Australia | 1,530,163 t | Status: historical value; source: FAOSTAT via OWID; year: 2024; region: Oceania. |
| 36 | Malawi | 1,457,542 t | Status: historical value; source: FAOSTAT via OWID; year: 2024; region: Africa. |
| 37 | Italy | 1,412,700 t | Status: historical value; source: FAOSTAT via OWID; year: 2024; region: Europe. |
| 38 | Bolivia | 1,382,383 t | Status: historical value; source: FAOSTAT via OWID; year: 2024; region: Americas. |
| 39 | Indonesia | 1,270,449 t | Status: historical value; source: FAOSTAT via OWID; year: 2024; region: Asia. |
| 40 | Tajikistan | 1,263,948 t | Status: historical value; source: FAOSTAT via OWID; year: 2024; region: Asia. |
| 41 | Chile | 1,246,278 t | Status: historical value; source: FAOSTAT via OWID; year: 2024; region: Americas. |
| 42 | Nigeria | 1,228,588 t | Status: historical value; source: FAOSTAT via OWID; year: 2024; region: Africa. |
| 43 | Kyrgyzstan | 1,190,214 t | Status: historical value; source: FAOSTAT via OWID; year: 2024; region: Asia. |
| 44 | Romania | 1,053,300 t | Status: historical value; source: FAOSTAT via OWID; year: 2024; region: Europe. |
| 45 | Azerbaijan | 954,005 t | Status: historical value; source: FAOSTAT via OWID; year: 2024; region: Asia. |
| 46 | Afghanistan | 908,218 t | Status: historical value; source: FAOSTAT via OWID; year: 2024; region: Asia. |
| 47 | Sweden | 879,800 t | Status: historical value; source: FAOSTAT via OWID; year: 2024; region: Europe. |
| 48 | Rwanda | 827,355 t | Status: historical value; source: FAOSTAT via OWID; year: 2024; region: Africa. |
| 49 | Turkmenistan | 824,320 t | Status: historical value; source: FAOSTAT via OWID; year: 2024; region: Asia. |
| 50 | Austria | 693,640 t | Status: historical value; source: FAOSTAT via OWID; year: 2024; region: Europe. |
| 51 | Zimbabwe | 673,484 t | Status: historical value; source: FAOSTAT via OWID; year: 2024; region: Africa. |
| 52 | Syrian Arab Republic | 671,811 t | Status: historical value; source: FAOSTAT via OWID; year: 2024; region: Asia. |
| 53 | Czechia | 655,510 t | Status: historical value; source: FAOSTAT via OWID; year: 2024; region: Europe. |
| 54 | Saudi Arabia | 625,071 t | Status: historical value; source: FAOSTAT via OWID; year: 2024; region: Asia. |
| 55 | Lebanon | 610,700 t | Status: historical value; source: FAOSTAT via OWID; year: 2024; region: Asia. |
| 56 | Serbia | 608,907 t | Status: historical value; source: FAOSTAT via OWID; year: 2024; region: Europe. |
| 57 | Guinea | 607,049 t | Status: historical value; source: FAOSTAT via OWID; year: 2024; region: Africa. |
| 58 | Republic of Korea | 568,625 t | Status: historical value; source: FAOSTAT via OWID; year: 2024; region: Asia. |
| 59 | United Republic of Tanzania | 560,929 t | Status: historical value; source: FAOSTAT via OWID; year: 2024; region: Africa. |
| 60 | Finland | 553,100 t | Status: historical value; source: FAOSTAT via OWID; year: 2024; region: Europe. |
| 61 | Mozambique | 552,561 t | Status: historical value; source: FAOSTAT via OWID; year: 2024; region: Africa. |
| 62 | Guatemala | 550,783 t | Status: historical value; source: FAOSTAT via OWID; year: 2024; region: Americas. |
| 63 | Sudan | 542,795 t | Status: historical value; source: FAOSTAT via OWID; year: 2024; region: Africa. |
| 64 | New Zealand | 531,438 t | Status: historical value; source: FAOSTAT via OWID; year: 2024; region: Oceania. |
| 65 | Angola | 528,284 t | Status: historical value; source: FAOSTAT via OWID; year: 2024; region: Africa. |
| 66 | Venezuela | 520,567 t | Status: historical value; source: FAOSTAT via OWID; year: 2024; region: Americas. |
| 67 | Israel | 475,010 t | Status: historical value; source: FAOSTAT via OWID; year: 2024; region: Asia. |
| 68 | Tunisia | 466,090 t | Status: historical value; source: FAOSTAT via OWID; year: 2024; region: Africa. |
| 69 | Uganda | 461,361 t | Status: historical value; source: FAOSTAT via OWID; year: 2024; region: Africa. |
| 70 | Myanmar | 422,111 t | Status: historical value; source: FAOSTAT via OWID; year: 2024; region: Asia. |
| 71 | Burundi | 420,224 t | Status: historical value; source: FAOSTAT via OWID; year: 2024; region: Africa. |
| 72 | Democratic People's Republic of Korea | 413,319 t | Status: historical value; source: FAOSTAT via OWID; year: 2024; region: Asia. |
| 73 | Bosnia and Herzegovina | 387,349 t | Status: historical value; source: FAOSTAT via OWID; year: 2024; region: Europe. |
| 74 | Switzerland | 370,665 t | Status: historical value; source: FAOSTAT via OWID; year: 2024; region: Europe. |
| 75 | Cameroon | 370,206 t | Status: historical value; source: FAOSTAT via OWID; year: 2024; region: Africa. |
| 76 | Libya | 369,147 t | Status: historical value; source: FAOSTAT via OWID; year: 2024; region: Africa. |
| 77 | Ireland | 368,340 t | Status: historical value; source: FAOSTAT via OWID; year: 2024; region: Europe. |
| 78 | Portugal | 357,550 t | Status: historical value; source: FAOSTAT via OWID; year: 2024; region: Europe. |
| 79 | Norway | 354,900 t | Status: historical value; source: FAOSTAT via OWID; year: 2024; region: Europe. |
| 80 | Viet Nam | 354,657 t | Status: historical value; source: FAOSTAT via OWID; year: 2024; region: Asia. |
| 81 | Armenia | 337,683 t | Status: historical value; source: FAOSTAT via OWID; year: 2024; region: Asia. |
| 82 | Greece | 332,910 t | Status: historical value; source: FAOSTAT via OWID; year: 2024; region: Europe. |
| 83 | Niger | 328,900 t | Status: historical value; source: FAOSTAT via OWID; year: 2024; region: Africa. |
| 84 | Yemen | 312,755 t | Status: historical value; source: FAOSTAT via OWID; year: 2024; region: Asia. |
| 85 | Albania | 277,824 t | Status: historical value; source: FAOSTAT via OWID; year: 2024; region: Europe. |
| 86 | Lithuania | 265,330 t | Status: historical value; source: FAOSTAT via OWID; year: 2024; region: Europe. |
| 87 | Mongolia | 251,405 t | Status: historical value; source: FAOSTAT via OWID; year: 2024; region: Asia. |
| 88 | Madagascar | 248,208 t | Status: historical value; source: FAOSTAT via OWID; year: 2024; region: Africa. |
| 89 | Hungary | 234,350 t | Status: historical value; source: FAOSTAT via OWID; year: 2024; region: Europe. |
| 90 | Mali | 234,244 t | Status: historical value; source: FAOSTAT via OWID; year: 2024; region: Africa. |
| 91 | Georgia | 221,500 t | Status: historical value; source: FAOSTAT via OWID; year: 2024; region: Asia. |
| 92 | Ecuador | 221,187 t | Status: historical value; source: FAOSTAT via OWID; year: 2024; region: Americas. |
| 93 | North Macedonia | 200,983 t | Status: historical value; source: FAOSTAT via OWID; year: 2024; region: Europe. |
| 94 | Iraq | 195,785 t | Status: historical value; source: FAOSTAT via OWID; year: 2024; region: Asia. |
| 95 | Slovakia | 170,630 t | Status: historical value; source: FAOSTAT via OWID; year: 2024; region: Europe. |
| 96 | Jordan | 161,367 t | Status: historical value; source: FAOSTAT via OWID; year: 2024; region: Asia. |
| 97 | Senegal | 146,775 t | Status: historical value; source: FAOSTAT via OWID; year: 2024; region: Africa. |
| 98 | Republic of Moldova | 135,372 t | Status: historical value; source: FAOSTAT via OWID; year: 2024; region: Europe. |
| 99 | Croatia | 133,860 t | Status: historical value; source: FAOSTAT via OWID; year: 2024; region: Europe. |
| 100 | Lesotho | 132,750 t | Status: historical value; source: FAOSTAT via OWID; year: 2024; region: Africa. |
Compiled research dataset based on FAOSTAT production statistics and supporting FAO/OWID documentation. The status label identifies a historical observation used in the ranking and does not replace FAOSTAT's separate observation-level flag field.
Insights from the Top 100
Key Insight
China and India form a separate production tier. Together they account for about 151.9 million tonnes among the entries in this ranking.
Notable Pattern
The gap between India and Ukraine is larger than Ukraine's entire annual production, showing how sharply output falls after the first two positions.
Regional Pattern
Within this Top 100, Europe has 31 entries, Asia 30, Africa 25, the Americas 12 and Oceania 2. These are analytical groupings used by this page rather than FAO regional classifications.
Outlier
China's output is about 66% higher than India's and more than four times Ukraine's production, making China the strongest scale outlier in the ranking.
What this ranking means
The ranking measures agricultural production scale. A high position means that a country produced a large absolute quantity of potatoes in 2024; it does not establish that farms are more efficient or that yields are higher.
Yield and harvested area should be analyzed separately when comparing productivity. A country can reach high total production through extensive cultivation, high yield per hectare or a combination of both.
Production is also different from trade. Potatoes can be consumed domestically, retained as seed, processed, stored or exported. A large producer therefore does not automatically rank among the largest potato exporters.
Individual FAOSTAT observations can differ in source provenance and statistical treatment. The status used here simply identifies each row as a historical value rather than a forecast or a modeled projection.
FAQ
Which country produces the most potatoes?
China ranks first in the 2024 series with 94,806,520 tonnes, followed by India with 57,053,344 tonnes.
Are these 2026 potato production figures?
No. This is a 2026 snapshot based on 2024 historical production data. No 2026 production forecast is included.
Are sweet potatoes included?
No. Sweet potatoes are excluded because FAOSTAT reports them separately from the Potatoes commodity used for this ranking.
What does potato production measure?
The ranking measures the annual quantity of potatoes produced, expressed in tonnes.
Is production the same as potato yield?
No. Production is total output. Yield measures output relative to harvested area and answers a different agricultural question.
Does high production mean high exports?
No. Production and exports are separate metrics. A large share of a country's crop can be consumed, processed, stored or used domestically.
Why is the ranking limited to 100 entries?
This page ranks the 100 largest included 2024 production values. Countries or territories outside the table are not assumed to have zero production.
How are regions assigned?
The region filter uses broad analytical groupings for navigation and comparison. These labels are not presented as official FAO regional classifications.
Does the row status reproduce the FAOSTAT flag?
No. The row status marks each entry as a historical value in this ranking. FAOSTAT observation flags are a separate metadata field describing the provenance or statistical treatment of individual observations.
Sources
FAOSTAT — Crops and livestock products
Original statistical source for potato production quantities.
FAO Data Catalog — Crop production, yield and harvested area
Official metadata used for production definitions, units, source hierarchy and observation-provenance context.
https://data.fao.org/catalog/dataset/d24a448b-3b62-4c09-8c1d-4a39bb599876
FAO — Agricultural production statistics 2010–2024
Official FAO release confirming the 2024 production-data horizon.
Our World in Data — Potato production
Processed FAO-derived series used to retrieve and cross-check the 2024 production values.
Our World in Data — FAOSTAT processing documentation
Documentation covering FAOSTAT processing, code handling and geographic-name harmonization.
Related rankings
More StatRanker pages connected by topic, category or ranking theme.
Wheat Production by Country 2026: Official FAOSTAT 2024 Ranking
Open rankingCorn (Maize) Production by Country 2026: Top 50 Ranking
Open rankingTop 100 Sweet Potato Producing Countries in 2025
Open rankingTop 10 Radish Production Countries in 2025: A Comprehensive Analysis
Open ranking
StatRanker (Website)
administrator
