

Corn (Maize) Production by Country 2026: Top 50 Ranking
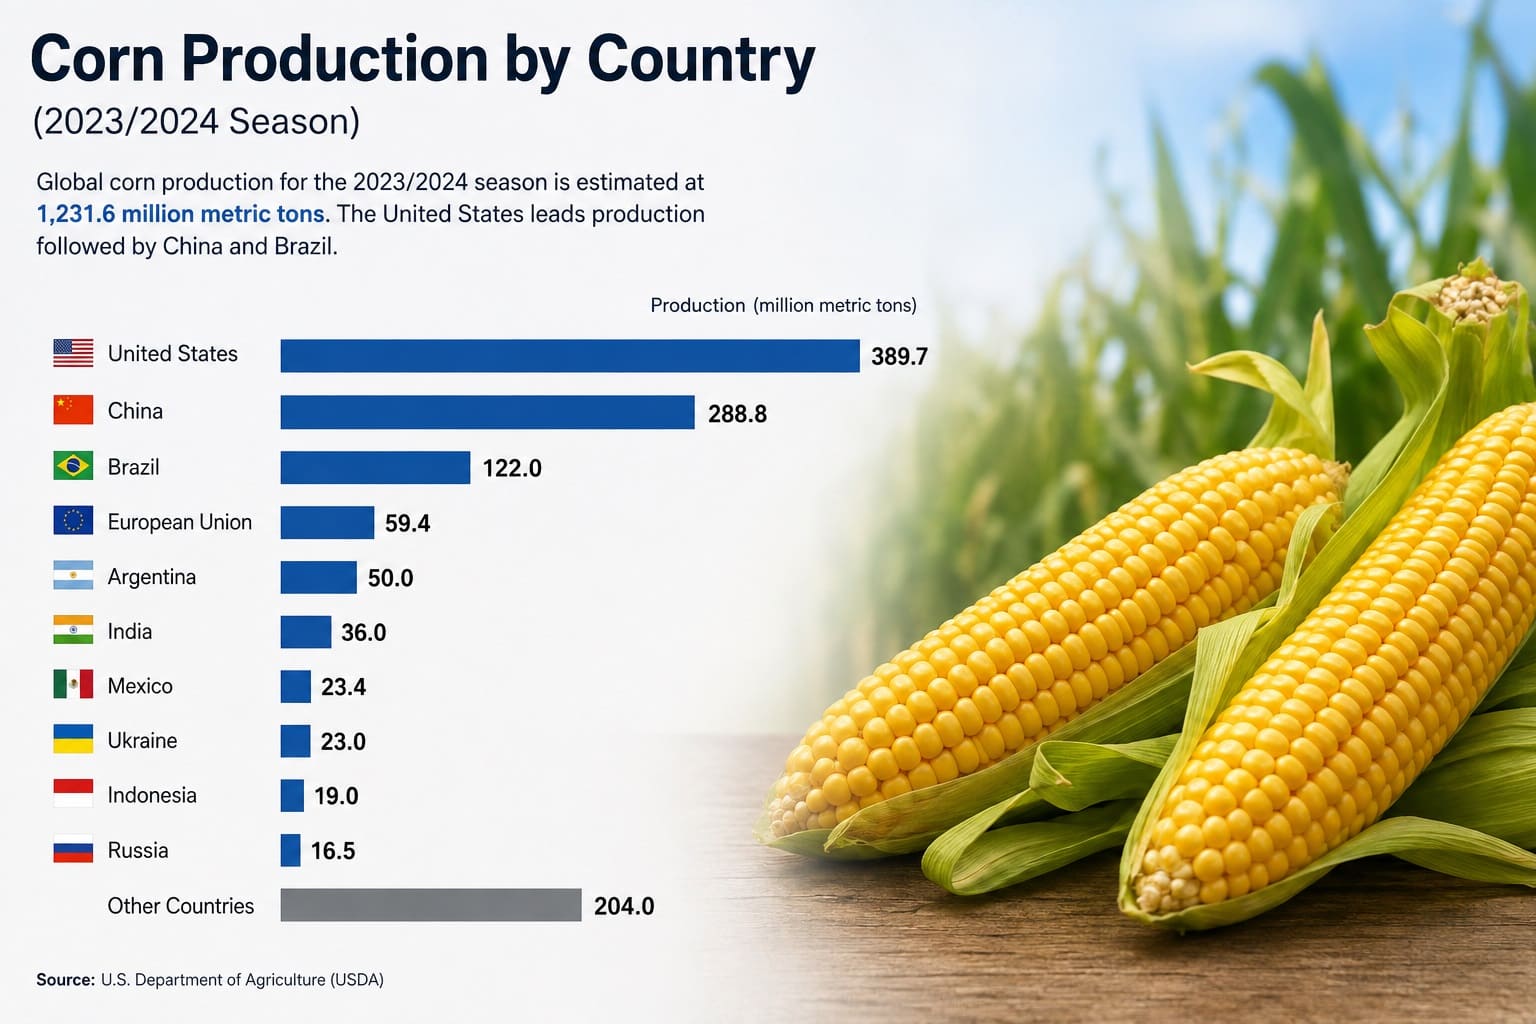
Corn (Maize) Production by Country: 2026 Snapshot Based on Official 2024 FAOSTAT Data
The United States was the largest producer of Corn (Maize) in 2024, followed by China and Brazil. The metric is production quantity for the FAOSTAT item “Maize (corn),” measured in tonnes. Higher production ranks higher.
This is a 2026 snapshot of the latest available 2024 FAOSTAT maize production series, not a 2026 forecast. The table is a compiled research dataset based on four references, with FAOSTAT as the underlying statistical source and the OWID processed series used to standardize country names and values.
Coverage: 50 countries. Unit: tonnes of dry-grain maize. All rows are historical 2024 values; the ranking contains no forecasts or modeled projections. Sweet corn, green maize, exports, yields, harvested area and per-capita output are excluded.
Continue exploring
More StatRanker pages connected by topic, category or ranking theme.
United States, 377,632,700 tonnes.
FAOSTAT-published world aggregate for 2024.
United States, China and Brazil combined.
Share of the 2024 world aggregate represented by the ranked countries.
Calculated from the 50 ranked country values.
No forecast rows and no modeled projections.
Overview: what this production ranking measures
The ranking measures the physical quantity of Corn (Maize) produced for dry grain during 2024. It compares national production scale rather than trade performance, farm productivity or consumption.
FAOSTAT cereal production covers crops harvested for dry grain. Maize harvested green for food, feed or silage, maize used for grazing and sweet corn classified with vegetables are outside the selected item.
Total output can rise because of larger harvested area, higher yield, multiple cropping or a combination of these factors. A high position therefore does not automatically mean that a country has the highest yield per hectare.
Top 10 Corn (Maize) producers in 2024
The first three countries produced 64.6% of the world total. The Top 10 accounted for 80.6%, showing that global maize production is concentrated among a relatively small group of large producers.
Top 10 countries by 2024 Corn (Maize) production quantity
| Rank | Country | Production | Source / note |
|---|---|---|---|
| 1 | United States | 377,632,700 t | North & Central America; FAOSTAT/OWID; 2024 historical value. |
| 2 | China | 294,920,000 t | Asia-Pacific; FAOSTAT/OWID; 2024 historical value. |
| 3 | Brazil | 114,953,304 t | South America; FAOSTAT/OWID; 2024 historical value. |
| 4 | Argentina | 57,494,500 t | South America; FAOSTAT/OWID; 2024 historical value. |
| 5 | India | 40,230,572 t | Asia-Pacific; FAOSTAT/OWID; 2024 historical value. |
| 6 | Ukraine | 26,863,740 t | Europe & Central Asia; FAOSTAT/OWID; 2024 historical value. |
| 7 | Mexico | 24,326,508 t | North & Central America; FAOSTAT/OWID; 2024 historical value. |
| 8 | Canada | 15,344,938 t | North & Central America; FAOSTAT/OWID; 2024 historical value. |
| 9 | Indonesia | 15,138,912 t | Asia-Pacific; FAOSTAT/OWID; 2024 historical value. |
| 10 | France | 14,670,620 t | Europe & Central Asia; FAOSTAT/OWID; 2024 historical value. |
Ranks are calculated from unrounded tonnes in descending order. Display values preserve the published precision.
Chart: Top 20 Corn (Maize) producers
The chart uses the same 2024 production values as the ranking table. The United States is the 100% reference bar.
Methodology
The primary statistical concept is FAOSTAT domain QCL, Production: Crops and livestock products. The selected item is “Maize (corn),” the element is production quantity, the unit is tonnes and the target year is 2024. Country rows are sorted from highest to lowest.
Metric and direction
Production quantity in tonnes. Larger values receive higher ranks.
Coverage
Top 50 countries with a published 2024 value. World and regional aggregates are excluded from the ranking.
Source method
FAOSTAT is the underlying statistical source. The OWID processed series was used to align country names and retrieve the 2024 values in a consistent format.
Data type
Every ranked value refers to 2024 production already published in the FAOSTAT system. The table contains no future estimates or calculated projections.
FAOSTAT flags
FAOSTAT distinguishes nationally reported figures from estimates and imputed records through dataset flags. This ranking reproduces the published values; readers who need that distinction should consult the official normalized bulk file.
Regions
Broad regions are editorial navigation categories used only for filtering. They do not alter country values or ranks.
Missing values and conflicts
Older years are not substituted for missing 2024 values, and conflicting values are not averaged.
Rounding and limits
Ranks use raw tonnes. Summary and chart labels are rounded. The metric does not measure exports, yield, quality, profitability or domestic use.
No synthetic 2026 values, growth rates or projections are calculated. The year 2026 describes the publication snapshot; all ranked values refer to 2024.
Main ranking: Top 50 countries by Corn (Maize) production
Use the controls to search by country, filter by broad region or data type, change the sort order, or limit the table to the Top 10 or Top 20.
Top 50 countries by 2024 Corn (Maize) production quantity
| Rank | Country | Production | Source / note |
|---|---|---|---|
| 1 | United States | 377,632,700 t | North & Central America; FAOSTAT/OWID; 2024 historical value. |
| 2 | China | 294,920,000 t | Asia-Pacific; FAOSTAT/OWID; 2024 historical value. |
| 3 | Brazil | 114,953,304 t | South America; FAOSTAT/OWID; 2024 historical value. |
| 4 | Argentina | 57,494,500 t | South America; FAOSTAT/OWID; 2024 historical value. |
| 5 | India | 40,230,572 t | Asia-Pacific; FAOSTAT/OWID; 2024 historical value. |
| 6 | Ukraine | 26,863,740 t | Europe & Central Asia; FAOSTAT/OWID; 2024 historical value. |
| 7 | Mexico | 24,326,508 t | North & Central America; FAOSTAT/OWID; 2024 historical value. |
| 8 | Canada | 15,344,938 t | North & Central America; FAOSTAT/OWID; 2024 historical value. |
| 9 | Indonesia | 15,138,912 t | Asia-Pacific; FAOSTAT/OWID; 2024 historical value. |
| 10 | France | 14,670,620 t | Europe & Central Asia; FAOSTAT/OWID; 2024 historical value. |
| 11 | Russia | 13,954,000 t | Europe & Central Asia; FAOSTAT/OWID; 2024 historical value. |
| 12 | South Africa | 12,850,000 t | Africa; FAOSTAT/OWID; 2024 historical value. |
| 13 | Ethiopia | 11,701,131 t | Africa; FAOSTAT/OWID; 2024 historical value. |
| 14 | Nigeria | 11,164,000 t | Africa; FAOSTAT/OWID; 2024 historical value. |
| 15 | Tanzania | 10,084,000 t | Africa; FAOSTAT/OWID; 2024 historical value. |
| 16 | Poland | 9,223,230 t | Europe & Central Asia; FAOSTAT/OWID; 2024 historical value. |
| 17 | Pakistan | 9,200,000 t | Asia-Pacific; FAOSTAT/OWID; 2024 historical value. |
| 18 | Philippines | 8,138,178 t | Asia-Pacific; FAOSTAT/OWID; 2024 historical value. |
| 19 | Turkey | 8,100,000 t | Europe & Central Asia; FAOSTAT/OWID; 2024 historical value. |
| 20 | Egypt | 7,206,000 t | Africa; FAOSTAT/OWID; 2024 historical value. |
| 21 | Romania | 5,971,850 t | Europe & Central Asia; FAOSTAT/OWID; 2024 historical value. |
| 22 | Hungary | 5,297,730 t | Europe & Central Asia; FAOSTAT/OWID; 2024 historical value. |
| 23 | Serbia | 5,107,308.5 t | Europe & Central Asia; FAOSTAT/OWID; 2024 historical value. |
| 24 | Germany | 5,010,500 t | Europe & Central Asia; FAOSTAT/OWID; 2024 historical value. |
| 25 | Uganda | 5,000,000 t | Africa; FAOSTAT/OWID; 2024 historical value. |
| 26 | Italy | 4,940,530 t | Europe & Central Asia; FAOSTAT/OWID; 2024 historical value. |
| 27 | Bangladesh | 4,592,508 t | Asia-Pacific; FAOSTAT/OWID; 2024 historical value. |
| 28 | Thailand | 4,558,192 t | Asia-Pacific; FAOSTAT/OWID; 2024 historical value. |
| 29 | Vietnam | 4,402,173 t | Asia-Pacific; FAOSTAT/OWID; 2024 historical value. |
| 30 | Kenya | 4,023,000 t | Africa; FAOSTAT/OWID; 2024 historical value. |
| 31 | Mali | 3,952,763 t | Africa; FAOSTAT/OWID; 2024 historical value. |
| 32 | Paraguay | 3,942,500 t | South America; FAOSTAT/OWID; 2024 historical value. |
| 33 | Ghana | 3,794,000 t | Africa; FAOSTAT/OWID; 2024 historical value. |
| 34 | Spain | 3,500,060 t | Europe & Central Asia; FAOSTAT/OWID; 2024 historical value. |
| 35 | Angola | 3,352,459 t | Africa; FAOSTAT/OWID; 2024 historical value. |
| 36 | Nepal | 3,193,869 t | Asia-Pacific; FAOSTAT/OWID; 2024 historical value. |
| 37 | Malawi | 3,000,000 t | Africa; FAOSTAT/OWID; 2024 historical value. |
| 38 | Venezuela | 2,832,021.5 t | South America; FAOSTAT/OWID; 2024 historical value. |
| 39 | Democratic Republic of Congo | 2,387,753 t | Africa; FAOSTAT/OWID; 2024 historical value. |
| 40 | Mozambique | 2,318,945 t | Africa; FAOSTAT/OWID; 2024 historical value. |
| 41 | North Korea | 2,300,000 t | Asia-Pacific; FAOSTAT/OWID; 2024 historical value. |
| 42 | Guatemala | 2,261,090 t | North & Central America; FAOSTAT/OWID; 2024 historical value. |
| 43 | Cameroon | 2,200,000 t | Africa; FAOSTAT/OWID; 2024 historical value. |
| 44 | Benin | 2,094,824.4 t | Africa; FAOSTAT/OWID; 2024 historical value. |
| 45 | Croatia | 2,067,100 t | Europe & Central Asia; FAOSTAT/OWID; 2024 historical value. |
| 46 | Austria | 2,059,360 t | Europe & Central Asia; FAOSTAT/OWID; 2024 historical value. |
| 47 | Myanmar | 2,050,000 t | Asia-Pacific; FAOSTAT/OWID; 2024 historical value. |
| 48 | Burkina Faso | 1,850,000 t | Africa; FAOSTAT/OWID; 2024 historical value. |
| 49 | Belarus | 1,700,000 t | Europe & Central Asia; FAOSTAT/OWID; 2024 historical value. |
| 50 | Peru | 1,686,076.8 t | South America; FAOSTAT/OWID; 2024 historical value. |
The 50 ranked countries represent 97.2% of the 2024 world aggregate. Country values come from the OWID processed FAOSTAT series and were checked against the FAOSTAT item, element, year and unit definitions.
Insights from the Top 50 ranking
Key insight
The United States, China and Brazil supplied 64.6% of global production. The ranking is highly concentrated at the top.
Notable pattern
Only four countries produced more than 50 million tonnes: the United States, China, Brazil and Argentina.
Regional concentration
North & Central America contributed 35.4% and Asia-Pacific 32.8% of the Top 50 total. Africa placed 16 countries in the ranking but contributed 7.3% of the Top 50 output.
Outlier
The United States exceeded China by 82.7M t and produced more than three times Brazil’s output.
What this ranking means
The table identifies where the largest physical volumes of dry-grain maize were produced in 2024. That scale matters for feed markets, food processing, starch, industrial uses and biofuel supply, but it does not show how much maize entered international trade.
A country can rank highly because it harvests a very large area, achieves high yields or combines both. Yield and harvested-area statistics are therefore needed to explain the production result.
The ranking should not be read as a measure of food availability, export power or farm efficiency. Domestic feed demand, processing, inventories, trade policy and crop quality can lead countries with similar production volumes to play very different market roles.
FAQ
Which country produced the most Corn (Maize) in 2024?
The United States ranked first with 377,632,700 tonnes, followed by China with 294,920,000 tonnes.
Are these 2026 production figures?
No. This is a 2026 snapshot based on the latest available official 2024 FAOSTAT data. No 2026 forecast is used.
What does the FAOSTAT maize item include?
The selected item covers maize harvested for dry grain. Green maize harvested for food, feed or silage is outside the metric.
Is sweet corn included?
No. Sweet corn is excluded because it is classified separately from dry-grain maize production.
Does this ranking show the largest corn exporters?
No. Production and exports are different measures. A large producer may consume most of its crop domestically.
Does a higher rank mean a higher maize yield?
No. Production is total tonnes. Yield measures output per unit of harvested area.
Why does the table use Corn (Maize)?
“Corn” is common usage in North America, while “maize” is the international crop name used in FAOSTAT. The combined label makes the metric clear to both audiences.
Are all country values nationally reported figures?
Not necessarily. FAOSTAT uses record flags to distinguish official submissions, estimates and imputed values. This table reproduces the published 2024 series; the official bulk file should be consulted when the flag for a specific country is important.
Sources
FAOSTAT — Production: Crops and livestock products
Primary official source environment for the item definition, production element, unit and country observations.
FAOSTAT normalized bulk download
Official record-level file for country values and detailed FAOSTAT flags.
https://bulks-faostat.fao.org/production/Production_Crops_Livestock_E_All_Data_(Normalized).zip
Our World in Data — Maize production
Processed FAOSTAT series used to align country names and retrieve the 2024 observations in a consistent table.
FAO — Agricultural production statistics 2010–2024
Official contextual release confirming the scale and latest update of global agricultural production through 2024.
Related rankings
More StatRanker pages connected by topic, category or ranking theme.
Banana Production by Country 2026: Official FAOSTAT 2024 Ranking
Open rankingChicken Meat Production by Country 2026: FAOSTAT 2024 Ranking
Open rankingPotato Production by Country 2026: FAOSTAT 2024 Ranking
Open rankingBlueberry Production by Country 2026: Official FAOSTAT 2024 Ranking
Open ranking
StatRanker (Website)
administrator
