

Gold Production by Country 2026: 2025 USGS Mine-Production Estimates
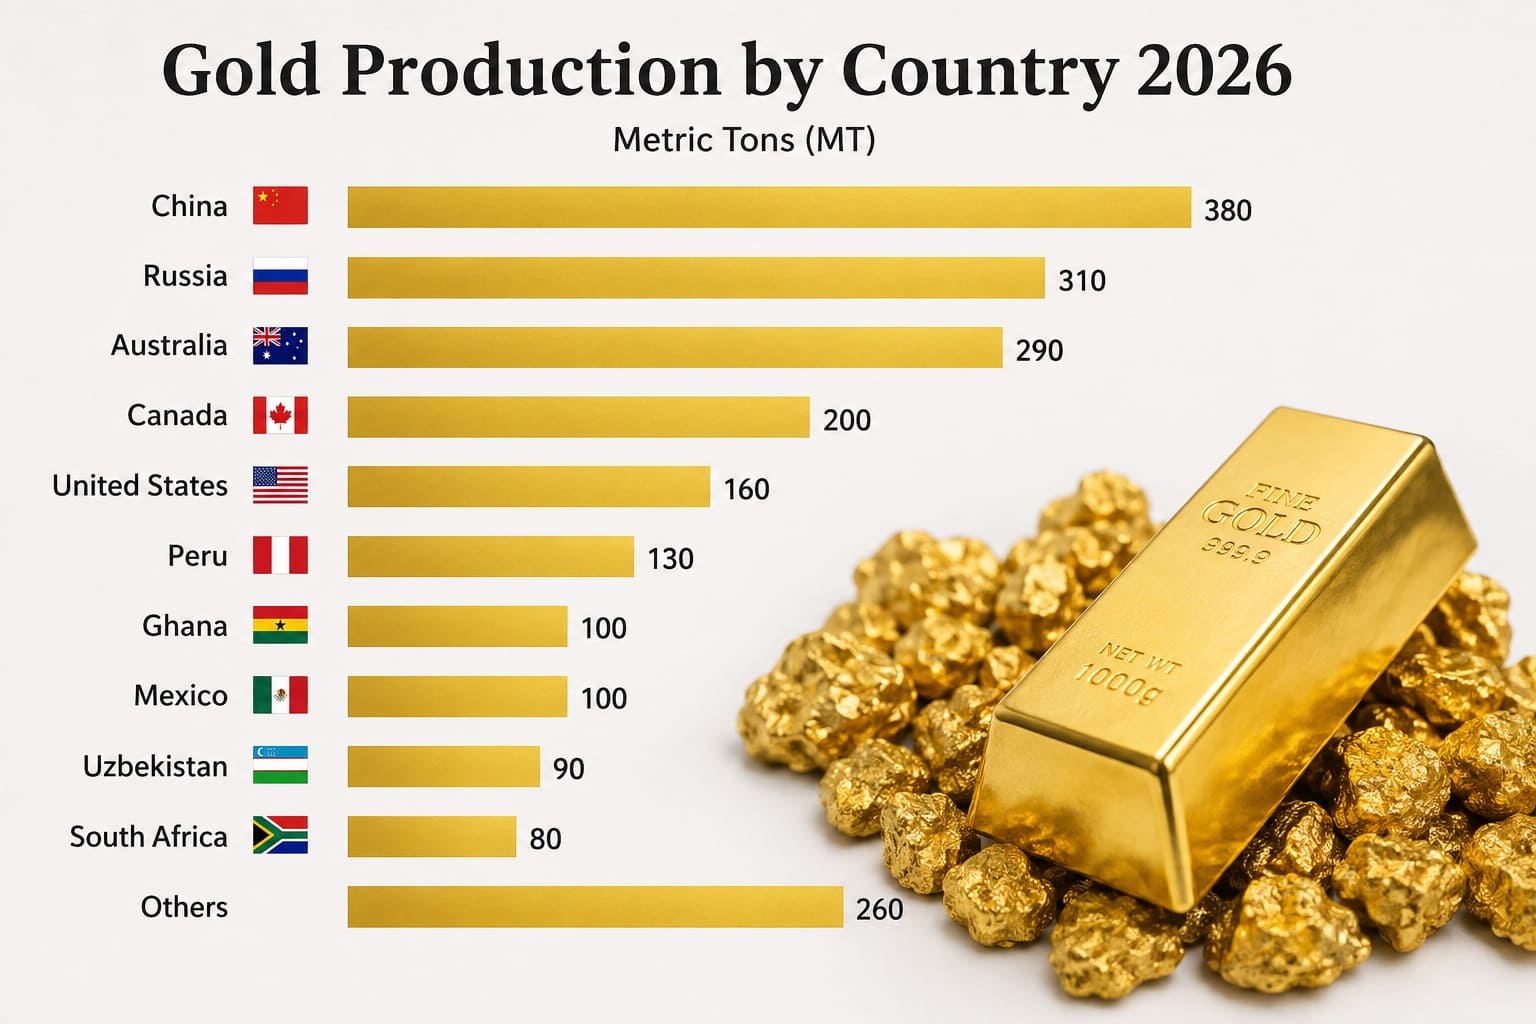
Which Countries Produced the Most Gold in 2025?
China leads the countries reported separately in the U.S. Geological Survey’s 2025 gold mine-production estimates, with 380 metric tons. Russia follows with 310 metric tons, while Australia ranks third at 280 metric tons.
This ranking measures gold produced from mines during 2025. It does not measure geological reserves, central-bank holdings, refinery output, recycled gold, exports or the market value of production.
The table covers 13 countries listed individually in the gold chapter of USGS Mineral Commodity Summaries 2026. Higher estimated production ranks higher. Every row is an official USGS estimate; no forecasts or modeled projections are included.
Continue exploring
More StatRanker pages connected by topic, category or ranking theme.
Iron Ore Mine Production by Country 2026: 2025 USGS Estimates
Open rankingNatural Graphite Mine Production by Country, 2025: USGS Ranking
Open rankingTop 20 Countries by Rare Earth Mine Production, 2025
Open rankingEstimated 2025 mine production.
Russia ranks second and Australia ranks third.
Countries reported individually in the USGS table.
Approximate 2025 world mine-production estimate.
Calculated from the 13 values in the ranking.
13 official estimates, 0 forecasts and 0 modeled projections.
Overview: what gold mine production measures
Gold mine production is an annual flow measure. It records the estimated quantity of gold recovered from mining operations during the reference year and expresses that output in metric tons of contained gold.
This differs from gold reserves, which estimate economically recoverable metal remaining in the ground. It also differs from central-bank holdings, which are above-ground financial assets, and from refined supply, which can include imported material and recycled gold.
The distinction matters because the leading mining countries are not necessarily the countries with the largest official gold holdings, the largest geological reserves or the largest refining industries.
Estimated gold recovered from mines during 2025, measured in metric tons.
Reserves, resources, central-bank holdings, recycled gold, refining, exports and monetary value.
“2026” refers to the publication snapshot. The production values describe 2025 and should be read as USGS estimates rather than final audited national totals.
Top 10 gold-producing countries in the 2025 USGS estimates
China, Russia and Australia form the leading group. Their combined estimated production is 970 metric tons, or about 29.4% of the approximate world total.
Top 10 countries by estimated 2025 gold mine production
| Rank | Entity | Value | Region / note |
|---|---|---|---|
| 1 | China | 380 t | East Asia; official USGS estimate for 2025 mine production. |
| 2 | Russia | 310 t | Eurasia; official USGS estimate for 2025 mine production. |
| 3 | Australia | 280 t | Oceania; official USGS estimate for 2025 mine production. |
| 4 | Canada | 200 t | North America; official USGS estimate for 2025 mine production. |
| 5 | United States | 160 t | North America; official USGS estimate for 2025 mine production. |
| 6 | Ghana | 150 t | West Africa; official USGS estimate for 2025 mine production. |
| 7 | Mexico | 140 t | North America; official USGS estimate for 2025 mine production. |
| 8 | Kazakhstan | 130 t | Central Asia; official USGS estimate for 2025 mine production. |
| 8 | Uzbekistan | 130 t | Central Asia; official USGS estimate for 2025 mine production. |
| 10 | Peru | 110 t | South America; official USGS estimate for 2025 mine production. |
Countries with equal published values share the same rank. The figures are rounded USGS estimates, so the table does not create unsupported precision to separate ties.
Chart: 13 countries reported separately by USGS
The bar lengths are indexed to China’s 380-metric-ton estimate. The chart shows a clear leading group, followed by a closer cluster of producers between 110 and 160 metric tons.
Methodology
The ranking uses the country values published in the gold chapter of USGS Mineral Commodity Summaries 2026. The reference year is 2025, the unit is metric tons, and the direction is descending because higher mine production ranks higher.
Metric
Estimated gold recovered from mining operations during 2025.
Unit
Metric tons of contained gold. No currency conversion is applied.
Coverage
Thirteen countries reported individually in the USGS world-production table.
Excluded aggregate
The combined entry for other producing countries is excluded because it is not an individual country.
Ties
Countries with equal published estimates share a rank and remain alphabetically ordered for display.
Missing values
No missing country value is estimated, modeled, replaced or imported from another database.
Percentage shares use the approximate USGS world total of 3,300 metric tons. The calculation is country production divided by 3,300 and multiplied by 100. Shares are rounded to one decimal place because both the country figures and the world total are estimates.
No conflicting estimates are averaged. No forecast is created for 2026, and no gold price is used to estimate production value. The ranking therefore remains a physical-output comparison rather than a revenue, reserve or investment-return ranking.
The metric does not measure ore grade, production cost, mine ownership, recovery rate, environmental performance, mine life, project profitability, refined supply or official gold holdings.
Main ranking: 13 countries reported separately by USGS
Search by country, filter by region, change the sort order or switch between the Top 10 and all 13 countries.
Showing 13 of 13 countries.
Gold mine production by country, USGS 2025 estimates
| Rank | Entity | Value | Region / note |
|---|---|---|---|
| 1 | China | 380 t | East Asia; official USGS estimate for 2025 mine production. |
| 2 | Russia | 310 t | Eurasia; official USGS estimate for 2025 mine production. |
| 3 | Australia | 280 t | Oceania; official USGS estimate for 2025 mine production. |
| 4 | Canada | 200 t | North America; official USGS estimate for 2025 mine production. |
| 5 | United States | 160 t | North America; official USGS estimate for 2025 mine production. |
| 6 | Ghana | 150 t | West Africa; official USGS estimate for 2025 mine production. |
| 7 | Mexico | 140 t | North America; official USGS estimate for 2025 mine production. |
| 8 | Kazakhstan | 130 t | Central Asia; official USGS estimate for 2025 mine production. |
| 8 | Uzbekistan | 130 t | Central Asia; official USGS estimate for 2025 mine production. |
| 10 | Peru | 110 t | South America; official USGS estimate for 2025 mine production. |
| 11 | Indonesia | 90 t | Southeast Asia; official USGS estimate for 2025 mine production. |
| 11 | South Africa | 90 t | Southern Africa; official USGS estimate for 2025 mine production. |
| 13 | Brazil | 80 t | South America; official USGS estimate for 2025 mine production. |
Source: USGS Mineral Commodity Summaries 2026, Gold. The aggregate for other producing countries is not ranked because it does not represent one country.
Insights from the 2025 gold mine-production estimates
Key insight
China’s 380-metric-ton estimate is 70 metric tons above Russia and 100 metric tons above Australia.
Concentration at the top
The five leading producers total 1,330 metric tons, approximately 40.3% of estimated world mine production.
Broad geographic spread
The leading producers span East Asia, Eurasia, Oceania, North America, West Africa, Central Asia and South America.
Notable gap
Australia’s 280-metric-ton estimate is 80 metric tons above Canada, creating the largest adjacent gap below the top two positions.
What the ranking means for markets and geopolitical analysis
The ranking shows where estimated mine output was produced during 2025. It can help identify national exposure in mining companies, royalty businesses, equipment demand, taxation, permitting and infrastructure.
Production is distributed across countries with different regulatory systems, ownership structures and geopolitical relationships. China, Russia, Australia, Canada and the United States together account for about 40.3% of the approximate world total, but no single region contains all leading mine output.
Mine production should not be treated as a direct measure of control over global gold markets. Refining capacity, international trade, company ownership, recycled supply, official-sector purchases and above-ground inventories can follow different geographic patterns.
The table also does not show profitability. Countries with similar output can differ substantially in ore grades, energy costs, taxes, mine depth, recovery rates, capital requirements and political risk.
FAQ
Which country produced the most gold in the 2025 USGS estimates?
China ranks first with estimated mine production of 380 metric tons.
Are these production figures for 2026?
No. The ranking is a 2026 publication snapshot based on USGS estimates for production during 2025.
Are the figures final national statistics?
No. They are USGS estimates and may differ from later revisions or national statistical releases.
Does the ranking include gold reserves?
No. Reserves estimate economically recoverable gold remaining in the ground, while this table measures estimated annual mine output.
Does the ranking include central-bank gold?
No. Central-bank holdings are above-ground financial assets and are separate from mine production.
Are recycled and refined gold included?
No. The ranking covers mine production only. Refineries can process imported or recycled material that was not mined domestically during 2025.
Why are only 13 countries included?
The USGS table reports these countries separately and combines the remaining producers into one aggregate category, which is not suitable for a country ranking.
Why do some countries share a rank?
Kazakhstan and Uzbekistan each have an estimate of 130 metric tons, while Indonesia and South Africa each have 90 metric tons. Equal published values receive equal ranks.
Sources
USGS Mineral Commodity Summaries 2026 — Gold
Primary source for country-level 2025 gold mine-production estimates and the approximate world total.
USGS Mineral Commodity Summaries 2026
Official publication record with report scope, citation details and supporting files. Current edition: version 1.3, May 2026.
USGS Gold Statistics and Information
Official USGS commodity page for gold statistics, annual summaries and related mineral information.
https://www.usgs.gov/centers/national-minerals-information-center/gold-statistics-and-information
Related rankings
More StatRanker pages connected by topic, category or ranking theme.
Countries by Phosphate Rock Mine Production, 2025
Open rankingTop 50 Countries by Uranium Mine Production (2025 Edition)
Open rankingTop 100 Countries by Bauxite Mine Production (2025) — Ranking, Concentration, and Aluminium Linkages
Open rankingTop 12 Countries by Cobalt Mine Production, 2025
Open ranking
StatRanker (Website)
administrator
