

Iron Ore Mine Production by Country 2026: 2025 USGS Estimates
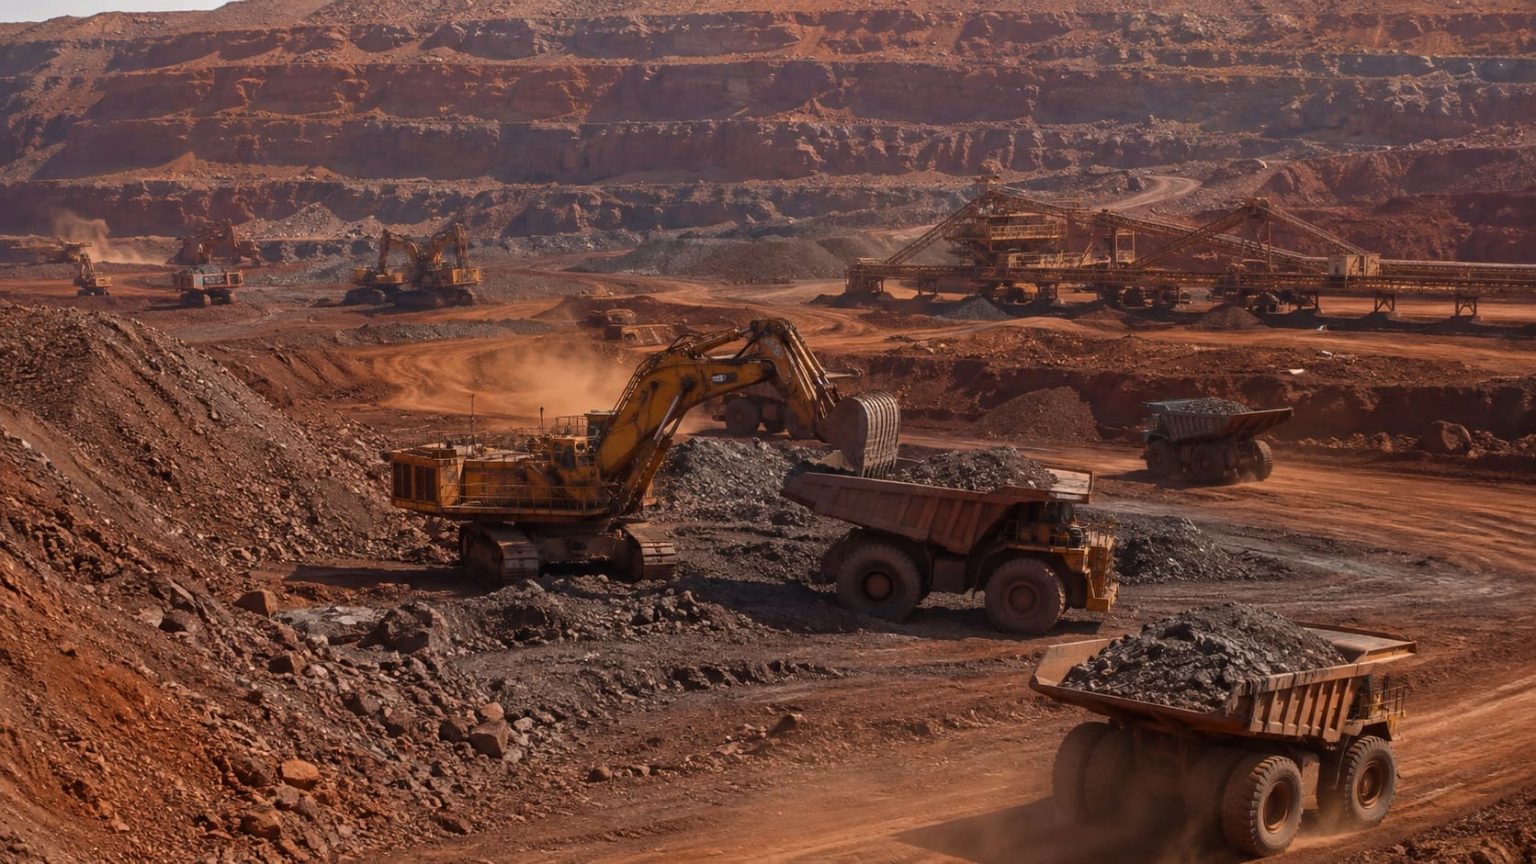
2025 Iron Ore Production at a Glance
Australia was the world's largest iron ore producer in the latest U.S. Geological Survey estimates, with 980 million metric tons of usable ore mined in 2025. Brazil ranked second at 420 million metric tons, followed by India at 310 million and China at 290 million.
This 2026 snapshot is based on the Iron Ore chapter of the USGS Mineral Commodity Summaries 2026, the first comprehensive USGS publication covering world mineral-production estimates for 2025. Every country is ranked using the same measure: mine production of usable iron ore.
USGS individually reports 17 countries in the 2025 table. All ranked figures are USGS estimates for 2025. No future production forecasts or modeled projections are used. Higher usable-ore production ranks higher.
Australia leads the 2025 USGS usable-ore production estimates.
Mexico is the smallest individually listed producer in the 2025 USGS table.
The ranking includes every country individually identified in the USGS table.
Million metric tons of usable iron ore produced from mines.
All ranked figures are published USGS estimates for the 2025 production year; no forecasts or projections are included.
Australia, Brazil, India and China account for 2,000 Mt of the 2,545.7 Mt subtotal across the 17 named countries.
How USGS Measures Iron Ore Output
Iron ore is the main source of iron used in steelmaking. Mine production therefore provides a useful measure of the upstream raw-material base supporting construction, machinery, vehicles, infrastructure and other steel-intensive industries.
The key definition in this ranking is usable ore. USGS distinguishes usable ore from crude ore and from iron content. Crude ore is the material extracted before beneficiation. Usable ore is the material available after the processing required to prepare it for downstream use. Iron content measures the quantity of elemental iron contained in the ore.
Measure used in this ranking: estimated 2025 mine production of usable iron ore. Contained iron, crude ore, reserves and export volumes are not combined with this measure.
Keeping the definition consistent is important because ore grades differ between deposits and countries. A producer can rank differently by gross usable-ore tonnage than by contained iron. Comparing one country's crude ore with another country's usable ore would also distort the result.
Production should not be confused with exports. Australia and Brazil ship large volumes internationally, while other major producers also supply substantial domestic steel industries. The figures below describe mining output, not the amount of iron ore entering world trade.
Largest Iron Ore Producers in 2025
Australia leads by a wide margin, with estimated production of 980 million metric tons of usable ore. Brazil follows at 420 million metric tons. India and China complete a group of four countries whose combined production reaches 2.0 billion metric tons.
Top 10 countries by estimated 2025 usable iron ore mine production
| Rank | Entity | Value | Region / Note |
|---|---|---|---|
| 1 | Australia | 980 Mt | Oceania · USGS MCS 2026 · official value · 2025 estimate · usable ore. |
| 2 | Brazil | 420 Mt | South America · USGS MCS 2026 · official value · 2025 estimate · usable ore. |
| 3 | India | 310 Mt | Asia · USGS MCS 2026 · official value · 2025 estimate · usable ore. |
| 4 | China | 290 Mt | Asia · USGS MCS 2026 · official value · 2025 estimate · usable ore. |
| 5 | Iran | 93 Mt | Asia · USGS MCS 2026 · official value · 2025 estimate · usable ore. |
| 6 | Russian Federation | 86 Mt | Europe & Asia · USGS MCS 2026 · official value · 2025 estimate · usable ore. |
| 7 | Canada | 69 Mt | North America · USGS MCS 2026 · official value · 2025 estimate · usable ore. |
| 8 | South Africa | 66 Mt | Africa · USGS MCS 2026 · official value · 2025 estimate · usable ore. |
| 9 | Ukraine | 52 Mt | Europe · USGS MCS 2026 · official value · 2025 estimate · usable ore. |
| 10 | United States | 38 Mt | North America · USGS MCS 2026 · official value · 2025 estimate · usable ore. |
All values refer to usable ore. Countries are ranked from highest to lowest estimated 2025 mine production.
Top 17 Confirmed Iron Ore Producers
Iron ore production is heavily concentrated among the largest producers. Australia alone accounts for 38.5% of the subtotal across the 17 countries identified individually by USGS, and Brazil adds another 16.5%.
Methodology
The ranking uses the 2025 mine-production estimates in the usable-ore column of the Iron Ore chapter in USGS Mineral Commodity Summaries 2026. USGS reports the source figures in thousand metric tons; this page converts them to million metric tons.
Metric
Mine production of usable iron ore during 2025.
Unit
Million metric tons of usable ore. Source figures in thousand metric tons are divided by 1,000.
Ranking
Countries are ordered from highest to lowest estimated usable-ore production.
Production year
The figures refer to 2025 and were published in USGS Mineral Commodity Summaries 2026.
Coverage
Seventeen countries are individually identified in the USGS world-production table and are included here.
Data status
The figures are official USGS estimates for 2025. No later-year production forecasts are added to the ranking.
Usable Ore and Iron Content Are Different Measures
Crude ore is the material extracted from a mine before beneficiation. Usable ore is the material prepared for downstream use and may include concentrates, direct-shipping ore, pellets and sinter. Iron content represents the amount of elemental iron contained in the ore. Because grades vary, the same country can occupy different positions depending on which measure is ranked.
Calculation
Source production in thousand metric tons is divided by 1,000 to display million metric tons. Country rank is based on usable-ore production in descending order. The 17 individually identified countries total 2,545.7 Mt. Percentage shares calculated on this page use that subtotal as their denominator.
Country Coverage and Missing Values
USGS also reports an aggregate for other producing countries. That aggregate is excluded because it does not represent a single country. Countries without an individually reported value are not assigned an estimated production figure, and no missing values are imputed.
Source Consistency and Rounding
Country production values come directly from the USGS series, with no cross-source averaging. The only numerical transformation is the conversion from thousand metric tons to million metric tons. Display precision follows the source figures closely enough to preserve the published ranking.
Source hierarchy: USGS Mineral Commodity Summaries 2026 is the controlling source for every production value and country rank. Other USGS pages cited below are used only for definitions, methodology and publication context; they do not replace or modify the ranking values.
Assumptions: USGS values marked as estimated are used as published for the 2025 production year. No adjustment is made for ore grade, iron content, mine capacity or subsequent revisions outside MCS 2026. The only numerical transformation is conversion from thousand metric tons to million metric tons.
Limits of the Ranking
Usable-ore production does not measure ore grade, contained iron, reserves, exports, mine ownership, production costs, market value or steelmaking capacity. Those indicators answer different questions and should not be inferred from production tonnage alone.
Complete Country Ranking
USGS individually reports 17 producing countries in its 2025 usable-ore series. Australia is far ahead at the top, while nine of the listed countries produce less than 60 million metric tons each.
Estimated 2025 mine production of usable iron ore
| Rank | Entity | Value | Region / Note |
|---|---|---|---|
| 1 | Australia | 980 Mt | Oceania · USGS MCS 2026 · official value · 2025 estimate · usable ore. |
| 2 | Brazil | 420 Mt | South America · USGS MCS 2026 · official value · 2025 estimate · usable ore. |
| 3 | India | 310 Mt | Asia · USGS MCS 2026 · official value · 2025 estimate · usable ore. |
| 4 | China | 290 Mt | Asia · USGS MCS 2026 · official value · 2025 estimate · usable ore. |
| 5 | Iran | 93 Mt | Asia · USGS MCS 2026 · official value · 2025 estimate · usable ore. |
| 6 | Russian Federation | 86 Mt | Europe & Asia · USGS MCS 2026 · official value · 2025 estimate · usable ore. |
| 7 | Canada | 69 Mt | North America · USGS MCS 2026 · official value · 2025 estimate · usable ore. |
| 8 | South Africa | 66 Mt | Africa · USGS MCS 2026 · official value · 2025 estimate · usable ore. |
| 9 | Ukraine | 52 Mt | Europe · USGS MCS 2026 · official value · 2025 estimate · usable ore. |
| 10 | United States | 38 Mt | North America · USGS MCS 2026 · official value · 2025 estimate · usable ore. |
| 11 | Kazakhstan | 35 Mt | Asia · USGS MCS 2026 · official value · 2025 estimate · usable ore. |
| 12 | Sweden | 26 Mt | Europe · USGS MCS 2026 · official value · 2025 estimate · usable ore. |
| 13 | Peru | 21 Mt | South America · USGS MCS 2026 · official value · 2025 estimate · usable ore. |
| 14 | Chile | 19 Mt | South America · USGS MCS 2026 · official value · 2025 estimate · usable ore. |
| 15 | Türkiye | 18 Mt | Europe & Asia · USGS MCS 2026 · official value · 2025 estimate · usable ore. |
| 16 | Mauritania | 15 Mt | Africa · USGS MCS 2026 · official value · 2025 estimate · usable ore. |
| 17 | Mexico | 7.7 Mt | North America · USGS MCS 2026 · official value · 2025 estimate · usable ore. |
The 17 individually reported countries total 2,545.7 Mt. The separate USGS “Other countries” aggregate is not ranked as a country.
Patterns in the 2025 Data
Key Insight
Australia's estimated 980 Mt is about 2.3 times Brazil's output and represents 38.5% of production across the 17 individually listed countries.
Notable Pattern
Australia, Brazil, India and China together produce 2,000 Mt. Their combined share reaches 78.6% of the subtotal represented in the country ranking.
Regional or Source Concentration
The four largest producers span Oceania, South America and Asia, showing that the strongest production concentration is driven by a small number of countries rather than by a single region.
Outlier
Mexico's 7.7 Mt is less than 1% of Australia's estimated output. Thirteen of the 17 listed countries produce less than 100 Mt each.
How to Interpret the Ranking
The ranking compares the scale of iron ore mining, not exports, reserves or steel production. Australia, Brazil, India and China dominate usable-ore tonnage among the countries listed individually by USGS, but their positions in the wider iron and steel market differ.
High mine production does not automatically mean equally high exports. Domestic steel demand, ore quality, transport infrastructure, processing capacity and trade patterns influence how much mined material reaches international markets. Large steelmaking countries can consume substantial volumes at home.
Usable-ore tonnage should also not be treated as a measure of ore quality. Two countries producing the same amount of usable ore may supply different amounts of elemental iron because average grades differ. For questions about the actual quantity of iron contained in the ore, the separate USGS iron-content series is more appropriate.
Reserves answer a different question. Mine production measures annual output, while reserves represent material that can be economically recovered under prevailing technical and economic conditions. A country can therefore rank highly in production without having the largest reserve base.
Download the Iron Ore Mine Production by Country 2026: 2025 USGS Estimates dataset
Iron Ore Mine Production by Country 2026: 2025 USGS Estimates
17 ranked entries · Excel + CSV + methodology + sources + chart · Snapshot: USGS Mineral Commodity Summaries 2026, 2025 iron-ore estimates · Version 1.0
No signup required. The archive includes machine-readable data, methodology and source documentation. Quick human verification is required before the ZIP is delivered.
Download Excel + CSV Data PackFAQ
Which country produced the most iron ore in 2025?
Australia ranks first, with USGS estimating 2025 mine production at 980 million metric tons of usable ore. Brazil ranks second at 420 Mt.
Why does the ranking say 2026 when the production figures are for 2025?
The figures refer to production during 2025 and were published in Mineral Commodity Summaries 2026. The page therefore uses the latest 2025 USGS estimates available for the 2026 snapshot.
What is usable iron ore?
Usable ore is iron ore prepared for downstream use after the processing required for the deposit. Depending on the operation, it can include concentrates, direct-shipping ore, pellets and sinter.
Is usable ore the same as contained iron?
No. Usable ore measures the tonnage of the ore product. Iron content measures the quantity of elemental iron contained in that material.
Are the 2025 production figures forecasts?
They are USGS estimates of production during 2025, published in Mineral Commodity Summaries 2026. No estimates for future production years are included.
Why are only 17 countries included?
USGS individually identifies 17 countries in the world-production table used here. Additional production is grouped into an “Other countries” category, which cannot be ranked as a single country.
Does this ranking show the largest iron ore exporters?
No. It measures mine production. Export rankings can differ because countries consume different shares of their iron ore domestically.
Does the ranking include iron ore reserves?
No. Reserves represent an economically recoverable stock of material, while mine production measures output during a specific year.
Why do iron ore production figures for China differ between sources?
Some historical datasets reported China's crude ore production while other countries were reported on a usable-ore basis. USGS revised its reporting approach to improve international comparability. This ranking uses usable ore for every country.
Sources
USGS Mineral Commodity Summaries 2026 — Iron Ore
Source for the 2025 usable-ore mine-production estimates, country coverage and iron ore market context used in this ranking.
https://pubs.usgs.gov/periodicals/mcs2026/mcs2026-iron-ore.pdf
USGS Mineral Commodity Summaries 2026
Official publication record for the 2026 edition and its coverage of 2025 world mineral-production data.
USGS Iron Ore Statistics and Information
Commodity reference for iron ore statistics, annual publications and industry definitions.
USGS Mineral Commodity Summaries 2026 Data Release
Supporting USGS data release associated with the 2026 Mineral Commodity Summaries.
https://data.usgs.gov/datacatalog/data/USGS%3A69837e43b66b01367d7ec7c7
USGS Revision of Global Iron Ore Production Data
Methodological reference explaining why crude ore, usable ore and iron content should not be mixed in international production comparisons.
Download data archive
ZIP archive with CSV and HTML copies of the tables published on this page, plus external source links, a manifest and README. The archive does not add new estimates or recalculate ranking values.
Related rankings
More StatRanker pages connected by topic, category or ranking theme.
