

Banana Production by Country 2026: Official FAOSTAT 2024 Ranking
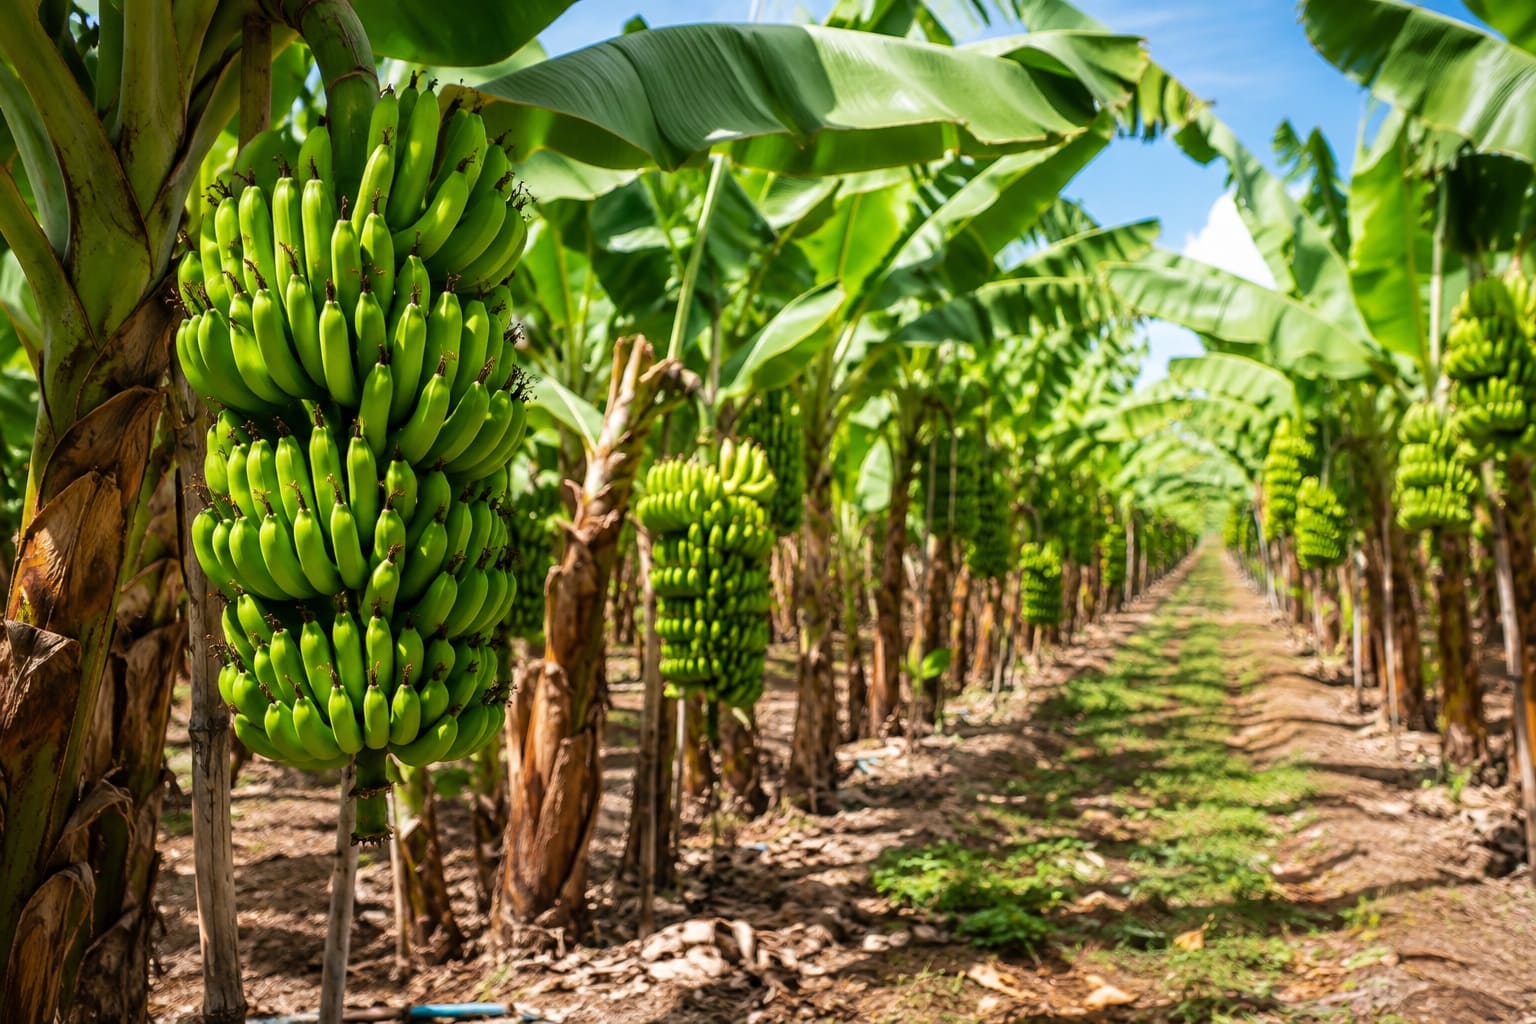
Banana Production by Country: 2026 Snapshot Based on FAOSTAT 2024 Data
India was the world’s largest banana producer in 2024, with 37.61 million tonnes. China ranked second with 11.76 million tonnes, followed by Indonesia with 9.26 million tonnes.
This ranking uses the 2024 production series published in FAOSTAT for the item “Bananas.” Production is measured in tonnes and countries are ranked from highest to lowest output. The 2026 label refers to the publication snapshot; the ranking does not estimate 2026 production.
The table covers the 50 largest country values in the 2024 FAOSTAT series. FAOSTAT is the single numerical source. Forecasts, modeled projections, export data, yields and harvested-area figures are not mixed into the ranking.
Continue exploring
More StatRanker pages connected by topic, category or ranking theme.
India accounts for about 27.0% of the 2024 FAOSTAT world total.
The 2024 world aggregate used for share calculations is 139,413,685 tonnes.
The ten largest producers account for about seven-tenths of world banana output.
The Top 50 represent about 98.1% of the 2024 world aggregate.
What the banana production ranking measures
The ranking compares the annual quantity of bananas produced in each country during 2024. The metric is physical agricultural output in tonnes. It does not rank countries by exports, harvested area, farm yield, crop value or per-capita production.
FAO states that banana figures refer, as far as possible, to edible fruit-bearing species of the genus Musa excluding plantains. FAO also notes that some countries do not fully separate bananas and plantains in their national statistics, which can affect comparability between individual country series.
FAOSTAT reports a world banana-production aggregate of approximately 139.41 million tonnes for 2024. India alone contributes about 27.0% of that total, while India, China and Indonesia together account for about 42.1%.
Top 10 banana-producing countries
India leads by a wide margin. China and Indonesia occupy second and third place, followed by Ecuador and Brazil. Nigeria, the Philippines, Angola, the United Republic of Tanzania and Guatemala complete the Top 10.
Top 10 countries by banana production, FAOSTAT 2024
| Rank | Country | Production | Region / note |
|---|---|---|---|
| 1 | India | 37,614,362 t | Asia; FAOSTAT 2024. |
| 2 | China | 11,759,700 t | Asia; FAOSTAT 2024. |
| 3 | Indonesia | 9,260,387 t | Asia; FAOSTAT 2024. |
| 4 | Ecuador | 7,585,653 t | Latin America & Caribbean; FAOSTAT 2024. |
| 5 | Brazil | 7,046,345 t | Latin America & Caribbean; FAOSTAT 2024. |
| 6 | Nigeria | 6,907,142 t | Africa; FAOSTAT 2024. |
| 7 | Philippines | 5,641,130 t | Asia; FAOSTAT 2024. |
| 8 | Angola | 5,213,106 t | Africa; FAOSTAT 2024. |
| 9 | United Republic of Tanzania | 3,269,970 t | Africa; FAOSTAT 2024. |
| 10 | Guatemala | 2,843,487 t | Latin America & Caribbean; FAOSTAT 2024. |
Values are displayed to the nearest tonne. Rank is determined from the underlying 2024 production value in descending order.
Top 20 banana producers in 2024
The distribution is strongly concentrated at the top. India produced more than three times China’s output and more than four times Indonesia’s production.
Methodology
Metric and unit
The metric is annual production of the FAOSTAT item “Bananas.” The element is Production and the unit is tonnes.
Reference year
Every ranking row uses 2024. The page is a 2026 snapshot of the 2024 FAOSTAT series, not a 2026 production forecast.
Ranking direction
Countries are sorted from highest to lowest production. Higher output therefore produces a higher rank.
Primary numerical source
All country values come from FAOSTAT Production: Crops and livestock products. No commercial or secondary database is blended into the numerical ranking.
Bananas and plantains
FAO states that banana figures refer, as far as possible, to edible fruit-bearing Musa species excluding plantains. Some national statistics do not fully distinguish between the two.
Observation status
The rows are historical values published in FAOSTAT, not forecasts. FAOSTAT maintains its own observation flags for reported, estimated or imputed values; those source flags are distinct from this page’s historical-value classification.
Coverage
The ranking contains the 50 largest confirmed country entries in the 2024 series. Regional and world aggregates are excluded from the country ranking.
Share calculations
Country and group shares are calculated against the 2024 world aggregate of 139,413,685 tonnes.
Display rounding
Table values are shown to the nearest tonne. Summary and chart values are abbreviated to millions or thousands of tonnes where appropriate.
What the metric does not measure
The ranking does not measure exports, harvested area, yield per hectare, crop value, domestic consumption, profitability or production per person.
FAO notes that country banana statistics are not perfectly comparable in every case. Some national systems do not clearly distinguish bananas from plantains, and reporting conventions can differ between countries.
For that reason, the ranking is best interpreted as an internationally harmonized FAOSTAT production comparison rather than as the result of one identical farm-level survey conducted in every country.
Banana production by country: Top 50
The ranking can be searched by country and filtered by broad region or source status. Sorting can also be changed without altering the underlying rank values.
Top 50 countries by banana production, FAOSTAT 2024
| Rank | Country | Production | Region / note |
|---|---|---|---|
| 1 | India | 37,614,362 t | Asia; FAOSTAT 2024. |
| 2 | China | 11,759,700 t | Asia; FAOSTAT 2024. |
| 3 | Indonesia | 9,260,387 t | Asia; FAOSTAT 2024. |
| 4 | Ecuador | 7,585,653 t | Latin America & Caribbean; FAOSTAT 2024. |
| 5 | Brazil | 7,046,345 t | Latin America & Caribbean; FAOSTAT 2024. |
| 6 | Nigeria | 6,907,142 t | Africa; FAOSTAT 2024. |
| 7 | Philippines | 5,641,130 t | Asia; FAOSTAT 2024. |
| 8 | Angola | 5,213,106 t | Africa; FAOSTAT 2024. |
| 9 | United Republic of Tanzania | 3,269,970 t | Africa; FAOSTAT 2024. |
| 10 | Guatemala | 2,843,487 t | Latin America & Caribbean; FAOSTAT 2024. |
| 11 | Mexico | 2,670,291 t | Latin America & Caribbean; FAOSTAT 2024. |
| 12 | Viet Nam | 2,640,250 t | Asia; FAOSTAT 2024. |
| 13 | Colombia | 2,638,064 t | Latin America & Caribbean; FAOSTAT 2024. |
| 14 | Costa Rica | 2,630,020 t | Latin America & Caribbean; FAOSTAT 2024. |
| 15 | Rwanda | 2,437,236 t | Africa; FAOSTAT 2024. |
| 16 | Peru | 2,343,311 t | Latin America & Caribbean; FAOSTAT 2024. |
| 17 | Kenya | 2,061,285 t | Africa; FAOSTAT 2024. |
| 18 | Dominican Republic | 2,038,905 t | Latin America & Caribbean; FAOSTAT 2024. |
| 19 | Thailand | 1,298,998 t | Asia; FAOSTAT 2024. |
| 20 | Papua New Guinea | 1,272,779 t | Oceania; FAOSTAT 2024. |
| 21 | Egypt | 1,251,943 t | Africa; FAOSTAT 2024. |
| 22 | Burundi | 1,207,926 t | Africa; FAOSTAT 2024. |
| 23 | Ethiopia | 1,190,101 t | Africa; FAOSTAT 2024. |
| 24 | Malawi | 1,131,259 t | Africa; FAOSTAT 2024. |
| 25 | Sudan | 952,279 t | Africa; FAOSTAT 2024. |
| 26 | Türkiye | 875,000 t | Asia; FAOSTAT 2024. |
| 27 | Bangladesh | 813,560 t | Asia; FAOSTAT 2024. |
| 28 | Democratic Republic of the Congo | 811,021 t | Africa; FAOSTAT 2024. |
| 29 | Cameroon | 805,353 t | Africa; FAOSTAT 2024. |
| 30 | Lao People's Democratic Republic | 766,200 t | Asia; FAOSTAT 2024. |
| 31 | Mali | 629,820 t | Africa; FAOSTAT 2024. |
| 32 | Honduras | 550,869 t | Latin America & Caribbean; FAOSTAT 2024. |
| 33 | Côte d'Ivoire | 534,243 t | Africa; FAOSTAT 2024. |
| 34 | Venezuela (Bolivarian Republic of) | 533,896 t | Latin America & Caribbean; FAOSTAT 2024. |
| 35 | South Africa | 430,925 t | Africa; FAOSTAT 2024. |
| 36 | Spain | 421,320 t | Europe; FAOSTAT 2024. |
| 37 | Madagascar | 399,940 t | Africa; FAOSTAT 2024. |
| 38 | Mozambique | 387,740 t | Africa; FAOSTAT 2024. |
| 39 | Panama | 387,690 t | Latin America & Caribbean; FAOSTAT 2024. |
| 40 | Nepal | 383,285 t | Asia; FAOSTAT 2024. |
| 41 | Cambodia | 374,923 t | Asia; FAOSTAT 2024. |
| 42 | Australia | 368,735 t | Oceania; FAOSTAT 2024. |
| 43 | China, Taiwan Province of | 341,390 t | Asia; FAOSTAT 2024. |
| 44 | Malaysia | 335,444 t | Asia; FAOSTAT 2024. |
| 45 | Zimbabwe | 325,400 t | Africa; FAOSTAT 2024. |
| 46 | Pakistan | 311,166 t | Asia; FAOSTAT 2024. |
| 47 | Morocco | 310,110 t | Africa; FAOSTAT 2024. |
| 48 | Bolivia (Plurinational State of) | 301,638 t | Latin America & Caribbean; FAOSTAT 2024. |
| 49 | Haiti | 264,881 t | Latin America & Caribbean; FAOSTAT 2024. |
| 50 | Guinea | 231,171 t | Africa; FAOSTAT 2024. |
All rows use the same metric, unit and reference year: FAOSTAT Bananas production, tonnes, 2024. The internal page status identifies historical values published by the official source and should not be confused with FAOSTAT’s separate observation flags.
What stands out in the ranking
India produces about 27% of the world total
India’s 37.61 million tonnes represent approximately 27.0% of the 2024 world banana-production aggregate.
The Top 10 account for nearly 70%
The ten largest producers together generated about 69.7% of world banana production in the 2024 FAOSTAT series.
The leading three account for about 42%
India, China and Indonesia together produced approximately 58.63 million tonnes, or about 42.1% of the world total.
India exceeds China and Indonesia combined
China and Indonesia together produced about 21.02 million tonnes. India alone produced roughly 16.59 million tonnes more.
How to interpret banana production rankings
A high production rank does not automatically mean that a country is a leading banana exporter. Production measures crops grown within a country, including bananas sold and consumed domestically. Export statistics measure only international trade.
This distinction is particularly important when comparing India with Ecuador. India dominates production volume, while Ecuador has a far more export-oriented banana industry. Production and trade rankings therefore answer different questions.
The table also does not measure productivity. A country may produce more bananas because it cultivates a larger area even if another country records a higher yield per hectare.
Small differences between countries should be interpreted with the source methodology in mind. FAOSTAT harmonizes national agricultural statistics, but reporting practices and observation flags can differ across country series.
FAQ
Which country produces the most bananas?
India ranks first in the 2024 FAOSTAT series with 37.61 million tonnes, equivalent to about 27.0% of world banana production.
Which are the three largest banana-producing countries?
India ranks first, China second and Indonesia third. Together they produced approximately 58.63 million tonnes in 2024.
Are these 2026 banana-production figures?
No. This is a 2026 publication snapshot based on 2024 FAOSTAT production data. No 2026 production forecast is included.
Does the ranking include plantains?
The FAOSTAT banana series refers, as far as possible, to edible fruit-bearing Musa species excluding plantains. FAO notes that some national statistics do not fully separate the two categories.
How much banana production was recorded worldwide in 2024?
The world aggregate used for this ranking is approximately 139.41 million tonnes.
Is the largest banana producer also the largest exporter?
Not necessarily. Production measures total crop output, while exports measure the quantity sold internationally. A large producer may consume most of its crop domestically.
Does the ranking measure banana yield?
No. Yield measures production relative to harvested area. This ranking measures total production quantity in tonnes.
Why can FAOSTAT observations have different flags?
FAOSTAT uses source flags to distinguish characteristics of individual observations, including reported, estimated or imputed values. Those flags are part of the source metadata and are separate from the ranking order.
Sources
FAOSTAT — Production: Crops and livestock products
Primary numerical source for country production values, the Bananas item, production element, unit and reference year.
FAOSTAT QCL methodology
Methodological reference for banana and plantain definitions, country reporting practices and comparability limitations.
https://files-faostat.fao.org/production/QCL/QCL_methodology_e.pdf
FAOSTAT bulk dataset catalog
Official dataset catalog confirming the QCL domain, dataset description, update date and bulk-data source.
Related rankings
More StatRanker pages connected by topic, category or ranking theme.
Wheat Production by Country 2026: Official FAOSTAT 2024 Ranking
Open rankingCorn (Maize) Production by Country 2026: Top 50 Ranking
Open rankingTop Countries by Tungsten Production in the World
Open rankingDry Natural Gas Production by Country 2026: EIA 2024 Ranking
Open ranking
StatRanker (Website)
administrator
