

Paddy Rice Production by Country: 2026 Snapshot Based on FAOSTAT 2024 Data
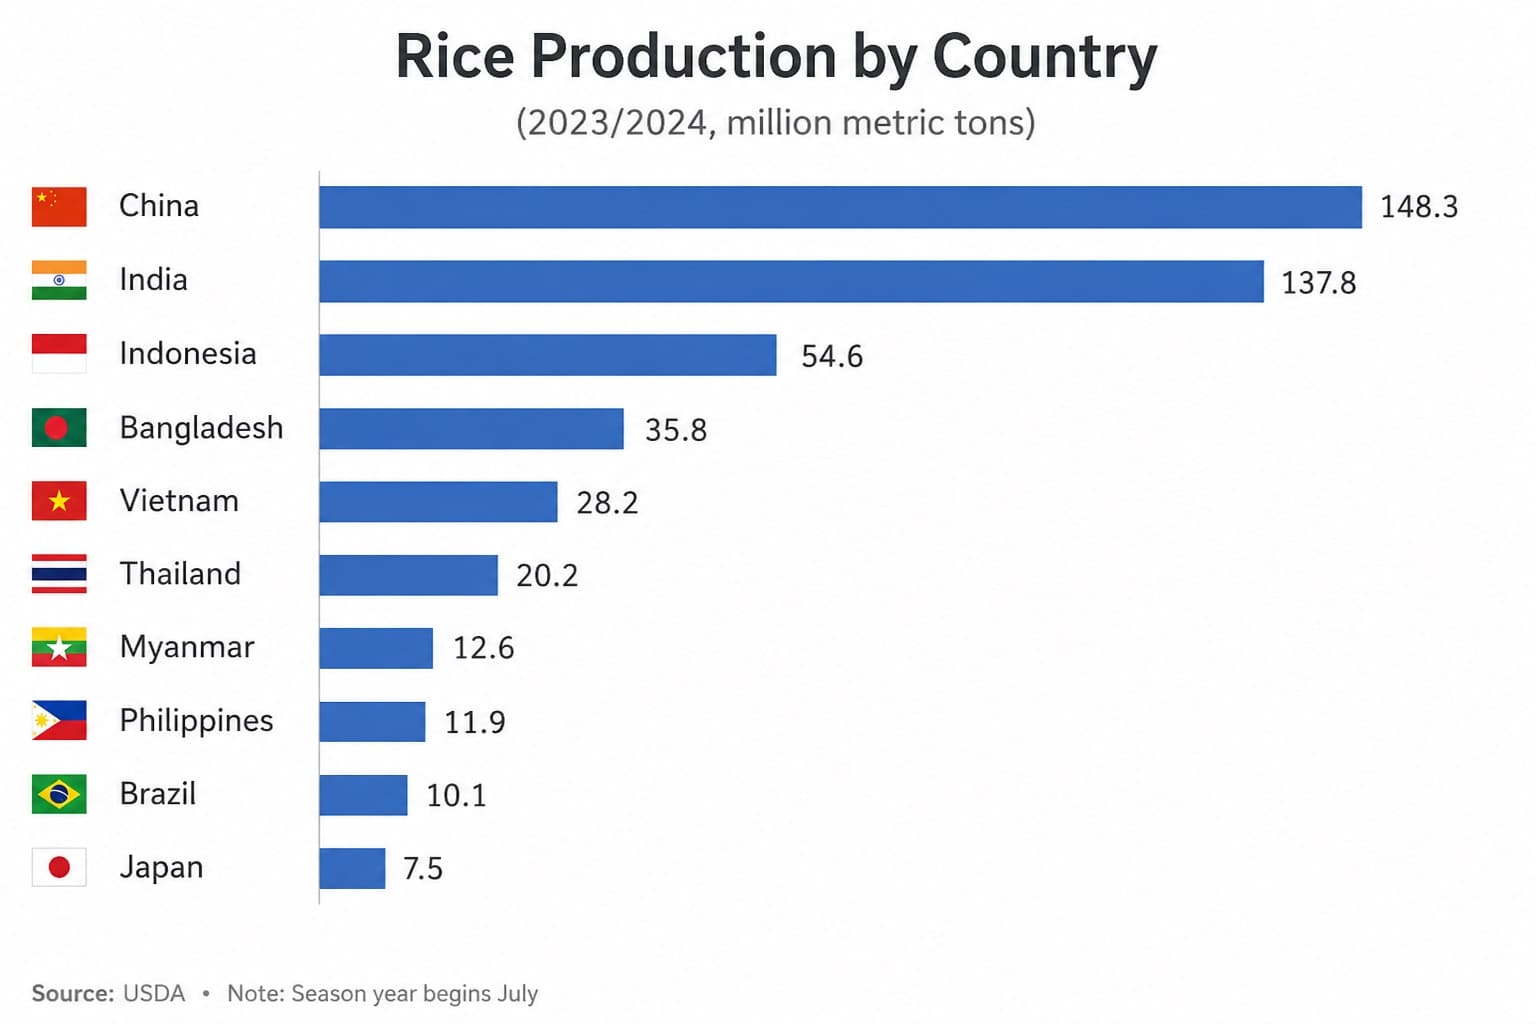
India and China Lead Global Paddy Rice Production in 2024
India was the world’s largest producer of paddy rice in 2024, with 217.868 million tonnes, followed by China, mainland at 207.530 million tonnes. The figures come from the official FAOSTAT Crops and livestock products database. “2026 snapshot” identifies when this ranking was prepared; every production value in the table is for 2024.
Paddy rice is rice with the husk still attached. Removing the husk produces brown rice; further removal of the bran layers and polishing produces milled or white rice. For that reason, the tonnes in this ranking must not be interpreted as milled-rice equivalent.
The ranking reproduces the 2024 Rice, paddy production series published in FAOSTAT QCL. The table covers 50 countries, uses tonnes as the unit, ranks larger output higher, and includes no forecasts or modeled projections. Rice exports, imports, consumption, harvested area and yield are outside the metric.
Continue exploring
More StatRanker pages connected by topic, category or ranking theme.
India ranked first in the 2024 country comparison.
Bolivia is the final country included in this Top 50.
World and regional aggregates and separate reporting areas are excluded.
Production quantity for the FAOSTAT item Rice, paddy.
Combined share of the FAOSTAT world paddy rice total.
Share of the FAOSTAT world total produced by the ten leaders.
What the ranking measures
The ranking compares the annual production quantity of the FAOSTAT item Rice, paddy. It measures the physical weight harvested before milling, not the market value of the crop and not the amount available as finished rice after processing.
Production is also different from harvested area and yield. A country may produce a large crop because it plants more land, records higher output per hectare, harvests more than once within the reference year, or combines these factors. None of those drivers is ranked here.
FAOSTAT assigns crop production to the calendar year in which the entire harvest or the largest part of it took place. A crop reported nationally by agricultural or marketing year can therefore be allocated to a different calendar-year label in the international series.
Top 10 paddy rice producers in 2024
The leading group is concentrated in Asia. India and China, mainland together produced 425.398 million tonnes, while Bangladesh ranked third with 60.570 million tonnes.
Top 10 countries by paddy rice production quantity
| Rank | Country | Paddy output | Region / year |
|---|---|---|---|
| 1 | India | 217.868 million t | Asia · 2024 |
| 2 | China, mainland | 207.530 million t | Asia · 2024 |
| 3 | Bangladesh | 60.570 million t | Asia · 2024 |
| 4 | Indonesia | 53.143 million t | Asia · 2024 |
| 5 | Viet Nam | 43.450 million t | Asia · 2024 |
| 6 | Thailand | 33.551 million t | Asia · 2024 |
| 7 | Myanmar | 27.650 million t | Asia · 2024 |
| 8 | Philippines | 19.087 million t | Asia · 2024 |
| 9 | Pakistan | 14.585 million t | Asia · 2024 |
| 10 | Cambodia | 14.200 million t | Asia · 2024 |
Ranks are calculated from unrounded tonnes. Values of at least one million tonnes are displayed in millions to three decimal places.
Top 20 paddy rice producers
India is the reference bar. The chart shows the sharp drop from the two largest producers to the rest of the ranking without converting the data into percentages or milled-rice equivalents.
Methodology and data limits
The underlying numeric source is FAOSTAT QCL: item Rice, paddy; element Production; year 2024; unit tonnes. Countries are sorted from highest to lowest raw value. FAO released this production update on December 31, 2025, and the source was accessed on August 1, 2026.
Metric
Production quantity of paddy rice in tonnes. The table does not convert output into brown, milled or white rice.
Country scope
The ranking uses 50 country series. World, regional and income-group aggregates are excluded. The CHN series is displayed as China, mainland to match FAOSTAT area naming. The separately reported China, Taiwan Province of series is not merged into the mainland value and is excluded from this country-only table.
Value status
All entries are published 2024 observations from the FAOSTAT database. The ranking contains no forecasts or modeled projections. FAOSTAT's separate Flag field provides additional information about the provenance of individual observations.
FAOSTAT flags
FAOSTAT maintains a separate Flag field for nationally reported, estimated and otherwise qualified observations. Because those row-level flags are not reproduced in this table, the visible notes do not label any country as an “Official figure” or “FAO estimate.”
Calendar-year rule
FAOSTAT allocates production to the calendar year in which the whole harvest or its largest part occurred, even when national statistics use another reporting period.
Regions
The broad region labels are editorial filters added for navigation. They do not alter the production values and should not be treated as FAOSTAT regional classifications.
Rounding
Ranking uses raw tonnes. Display labels are rounded only after sorting, so rounding does not change any position.
Revisions
FAOSTAT can revise historical observations when country submissions or validation change. A later database release may therefore differ from this snapshot.
Only country series with a non-null 2024 production value in the selected FAOSTAT series were eligible. No 2026 production value was estimated. The metric does not measure crop value, harvested area, yield, milling recovery, quality, exports, imports, stocks, consumption, losses or food security.
Top 50 countries by paddy rice production
Use the controls to locate a country or compare selected parts of the ranking.
FAOSTAT paddy rice production quantity, 2024
| Rank | Country | Paddy output | Region / year |
|---|---|---|---|
| 1 | India | 217.868 million t | Asia · 2024 |
| 2 | China, mainland | 207.530 million t | Asia · 2024 |
| 3 | Bangladesh | 60.570 million t | Asia · 2024 |
| 4 | Indonesia | 53.143 million t | Asia · 2024 |
| 5 | Viet Nam | 43.450 million t | Asia · 2024 |
| 6 | Thailand | 33.551 million t | Asia · 2024 |
| 7 | Myanmar | 27.650 million t | Asia · 2024 |
| 8 | Philippines | 19.087 million t | Asia · 2024 |
| 9 | Pakistan | 14.585 million t | Asia · 2024 |
| 10 | Cambodia | 14.200 million t | Asia · 2024 |
| 11 | Brazil | 10.671 million t | Americas · 2024 |
| 12 | Japan | 10.142 million t | Asia · 2024 |
| 13 | United States of America | 10.076 million t | Americas · 2024 |
| 14 | Nigeria | 9.130 million t | Africa · 2024 |
| 15 | Egypt | 6.430 million t | Africa · 2024 |
| 16 | Nepal | 5.955 million t | Asia · 2024 |
| 17 | Madagascar | 4.970 million t | Africa · 2024 |
| 18 | Republic of Korea | 4.783 million t | Asia · 2024 |
| 19 | Sri Lanka | 4.698 million t | Asia · 2024 |
| 20 | United Republic of Tanzania | 4.052 million t | Africa · 2024 |
| 21 | Lao People's Democratic Republic | 3.751 million t | Asia · 2024 |
| 22 | Guinea | 3.680 million t | Africa · 2024 |
| 23 | Peru | 3.640 million t | Americas · 2024 |
| 24 | Iran (Islamic Republic of) | 3.479 million t | Asia · 2024 |
| 25 | Colombia | 2.823 million t | Americas · 2024 |
| 26 | Mali | 2.756 million t | Africa · 2024 |
| 27 | Côte d’Ivoire | 2.381 million t | Africa · 2024 |
| 28 | Democratic People's Republic of Korea | 2.250 million t | Asia · 2024 |
| 29 | Malaysia | 2.103 million t | Asia · 2024 |
| 30 | Democratic Republic of the Congo | 1.941 million t | Africa · 2024 |
| 31 | Ghana | 1.721 million t | Africa · 2024 |
| 32 | Senegal | 1.580 million t | Africa · 2024 |
| 33 | Ecuador | 1.560 million t | Americas · 2024 |
| 34 | Italy | 1.449 million t | Europe · 2024 |
| 35 | Sierra Leone | 1.391 million t | Africa · 2024 |
| 36 | Uruguay | 1.306 million t | Americas · 2024 |
| 37 | Argentina | 1.265 million t | Americas · 2024 |
| 38 | Russian Federation | 1.259 million t | Europe · 2024 |
| 39 | Guyana | 1.116 million t | Americas · 2024 |
| 40 | Paraguay | 1.052 million t | Americas · 2024 |
| 41 | Türkiye | 1.019 million t | Asia · 2024 |
| 42 | Dominican Republic | 958,000 t | Americas · 2024 |
| 43 | Afghanistan | 654,000 t | Asia · 2024 |
| 44 | Australia | 619,180 t | Oceania · 2024 |
| 45 | Venezuela (Bolivarian Republic of) | 611,475 t | Americas · 2024 |
| 46 | Spain | 605,820 t | Europe · 2024 |
| 47 | Burkina Faso | 513,234 t | Africa · 2024 |
| 48 | Kazakhstan | 512,982 t | Asia · 2024 |
| 49 | Benin | 500,605 t | Africa · 2024 |
| 50 | Bolivia (Plurinational State of) | 434,028 t | Americas · 2024 |
All rows use the same item, element, unit and year. FAOSTAT QCL remains the authoritative source for the original area codes, flags and notes.
What stands out in the ranking
Production is concentrated
India and China, mainland produced 425.398 million tonnes combined, equal to 51.9% of the world total.
The Top 10 dominate
The ten largest producers generated 691.635 million tonnes, or 84.3% of global paddy output.
Asia leads the upper ranks
All Top 10 countries are in Asia. Brazil, ranked 11th with 10.671 million tonnes, is the largest producer outside Asia.
A large second-to-third gap
China, mainland produced 146.960 million tonnes more than Bangladesh. That gap exceeds the output of every country ranked third or lower.
How to interpret paddy rice production
A high position means a country harvested a large physical quantity of rice in the husk during the FAOSTAT reference year. It does not show how much rice was exported, how much remained for domestic use, or how much milled rice was ultimately recovered.
The ranking also cannot identify farming efficiency on its own. Production should be compared with harvested area and yield when the question is land use or productivity. Trade, stocks and consumption are needed for market-balance or food-security analysis.
FAOSTAT may revise historical observations after receiving or validating new information, so a later download can contain updated values.
Frequently asked questions
Which country produced the most paddy rice in 2024?
India ranked first with 217.868 million tonnes, followed by China, mainland with 207.530 million tonnes.
Are these production estimates for 2026?
No. The production year is 2024. The phrase 2026 snapshot identifies when the ranking was prepared, not a forecast year.
What is paddy rice?
Paddy rice is harvested rice with the husk attached. Dehusking produces brown rice; further bran removal and polishing produce milled or white rice.
Is paddy output the same as milled-rice equivalent?
No. Milling removes part of the harvested weight, and recovery rates vary. No milling conversion is applied in this table.
Does every FAOSTAT value have the same source flag?
No. FAOSTAT’s Flag field can distinguish nationally reported, estimated and otherwise qualified observations. The original QCL file should be consulted for the provenance of an individual country value.
Why does this ranking differ from rice export rankings?
Production records the crop harvested. Exports record cross-border trade. A large producer may consume most of its crop domestically, while another country may export a larger share.
Does the table measure yield?
No. Yield compares output with harvested area. This ranking uses total production quantity only.
Sources
FAOSTAT — Crops and livestock products
Primary authority for the item Rice, paddy; element Production; year 2024; unit tonnes. Domain release date: December 31, 2025. Accessed August 1, 2026.
FAOSTAT QCL methodology
Definitions, source limitations, calendar-year allocation and the treatment of government submissions and supplementary information. Accessed August 1, 2026.
https://files-faostat.fao.org/production/QCL/QCL_methodology_e.pdf
FAO agricultural production release
Release context confirming publication of agricultural production statistics through 2024. Accessed August 1, 2026.
FAOSTAT QCL bulk download
Machine-readable source file containing areas, items, elements, years, units, values, flags and notes.
https://bulks-faostat.fao.org/production/Production_Crops_Livestock_E_All_Data_(Normalized).zip
Related rankings
More StatRanker pages connected by topic, category or ranking theme.
Sugarcane Production by Country 2026: Official FAOSTAT 2024 Ranking
Open rankingPotato Production by Country 2026: FAOSTAT 2024 Ranking
Open rankingBanana Production by Country 2026: Official FAOSTAT 2024 Ranking
Open rankingBlueberry Production by Country 2026: Official FAOSTAT 2024 Ranking
Open ranking
StatRanker (Website)
administrator
