

Crude Oil Production by Country 2026: Top 10 EIA 2025 Ranking
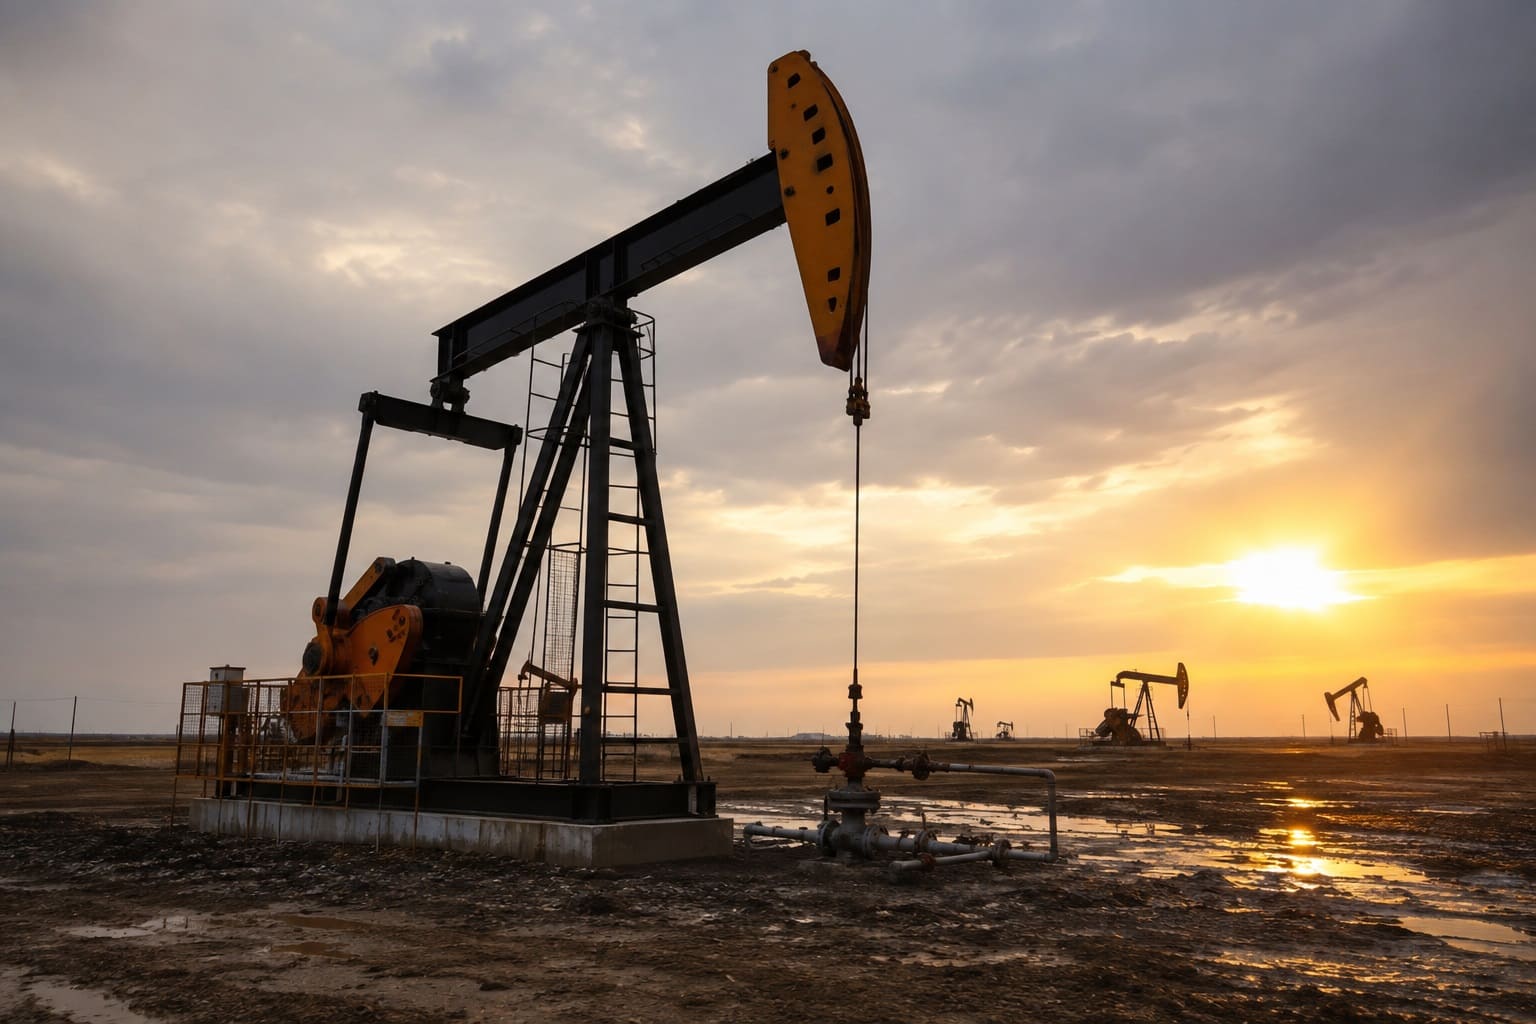
Top crude oil producing countries in the latest EIA annual ranking
The United States ranked first in EIA's 2025 international crude oil comparison, producing an annual average of 13.586 million barrels per day of crude oil including lease condensate. Russia ranked second at 9.885 million barrels per day, followed by Saudi Arabia at 9.556 million barrels per day.
The ranking uses calendar-year 2025 production and one consistent EIA metric for every country. Higher production ranks higher. Source values are published in thousand barrels per day and converted to million barrels per day for display.
Natural gas plant liquids, other petroleum liquids, refinery processing gain, finished refinery products and crude oil reserves are excluded from the metric.
Continue exploring
More StatRanker pages connected by topic, category or ranking theme.
Dry Natural Gas Production by Country 2026: EIA 2024 Ranking
Open rankingOil Reserves by Country 2026: Proven Crude Oil Reserves at End-2025
Open rankingElectricity Consumption by Country 2026: Top 50 EIA 2024 Ranking
Open rankingAll 10 rows are EIA-published 2025 observations. No forecast or modeled production values are used. The ranking is an annual 2025 comparison, not a real-time measure of production during 2026.
United States · EIA 2025 annual average.
Kuwait · rank 10 in the EIA 2025 comparison.
One reference year and one EIA crude oil production metric.
10 published observations · 0 forecasts · 0 modeled projections.
Overview: what this crude oil ranking measures
Petroleum statistics use several definitions of "oil," so country rankings are comparable only when the underlying metric is the same. This page follows EIA's international series for crude oil production including lease condensate.
Lease condensate remains part of the measure because it is included in the EIA crude oil production series. The ranking is therefore narrower than comparisons based on total petroleum and other liquids.
Crude oil and lease condensate
Production values represent crude oil plus lease condensate in the EIA international production series.
Broader petroleum measures
Natural gas plant liquids, other petroleum liquids, refinery processing gain, refinery output, imports, exports and proved reserves are not included.
Each value represents average daily production across calendar year 2025. It is not a single-day production record. Broader petroleum-liquids datasets can produce different country totals because they include additional liquid-fuel components.
Top five crude oil producers in 2025
The three largest producers form a distinct high-output group. The United States produced 13.586 million barrels per day, Russia 9.885 million and Saudi Arabia 9.556 million. Production then drops to 4.964 million barrels per day for Canada.
Top five producers by crude oil including lease condensate
| Rank | Entity | Value | Region / note |
|---|---|---|---|
| 1 | United States | 13.586M b/d | North America · EIA 2025. |
| 2 | Russia | 9.885M b/d | Europe & Eurasia · EIA 2025. |
| 3 | Saudi Arabia | 9.556M b/d | Middle East · EIA 2025. |
| 4 | Canada | 4.964M b/d | North America · EIA 2025. |
| 5 | Iraq | 4.388M b/d | Middle East · EIA 2025. |
Rank is calculated from the underlying EIA value before display conversion.
Chart: Top 10 crude oil producers
The chart uses the same exact values as the ranking table. The United States is the largest producer, followed by Russia and Saudi Arabia.
Methodology
The ranking uses EIA International Rankings for calendar-year 2025 crude oil production including lease condensate. The source reports values in thousand barrels per day; this page divides them by 1,000 for display in million barrels per day.
Metric and unit
Crude oil production including lease condensate. Source unit: thousand barrels per day; display unit: million barrels per day.
Ranking direction
Countries are sorted from highest to lowest production using the underlying EIA values.
Reference year
Calendar year 2025 is used for every country. No earlier-year values are mixed into the ranking.
Coverage
The page presents the first ten countries in the EIA 2025 international ranking.
Source hierarchy
EIA International Rankings provides numeric values. Other EIA publications are used only for definitions and current context.
Missing values
No country is added using an older year, third-party estimate or inferred 2025 value.
Forecast treatment
No ranking value is forecast or modeled. No CAGR, interpolation or projection formula is applied.
Ranking and rounding
Ranks are based on EIA thousand-barrels-per-day values before conversion to the displayed unit.
Regional labels
Regional groupings are used only for filtering and interpretation. They do not affect values or ranks.
Metric limits
The ranking does not measure reserves, exports, spare capacity, refining capacity, crude quality, production cost or petroleum revenue.
The United Arab Emirates ranks eighth at 3.771 million barrels per day, narrowly ahead of Brazil at 3.769 million barrels per day. Their exact source values resolve the ranking even though both round to 3.8 million barrels per day at one decimal place.
Top 10 countries by crude oil production in 2025
Search by country, filter the ranking by region, change the sort order or limit the view to the Top 5.
Showing 10 of 10 countries
EIA 2025 · crude oil including lease condensate
EIA 2025 crude oil production including lease condensate
| Rank | Entity | Value | Region / note |
|---|---|---|---|
| 1 | United States | 13.586M b/d | North America · EIA 2025 · published value. |
| 2 | Russia | 9.885M b/d | Europe & Eurasia · EIA 2025 · published value. |
| 3 | Saudi Arabia | 9.556M b/d | Middle East · EIA 2025 · published value. |
| 4 | Canada | 4.964M b/d | North America · EIA 2025 · published value. |
| 5 | Iraq | 4.388M b/d | Middle East · EIA 2025 · published value. |
| 6 | China | 4.325M b/d | Asia-Pacific · EIA 2025 · published value. |
| 7 | Iran | 4.051M b/d | Middle East · EIA 2025 · published value. |
| 8 | United Arab Emirates | 3.771M b/d | Middle East · EIA 2025 · published value. |
| 9 | Brazil | 3.769M b/d | South America · EIA 2025 · published value. |
| 10 | Kuwait | 2.584M b/d | Middle East · EIA 2025 · published value. |
UAE ranks eighth at 3.771 million barrels per day, narrowly ahead of Brazil at 3.769 million barrels per day.
How 2026 market conditions affect interpretation
Middle East disruption
EIA's July 2026 outlook described major Middle East production and trade disruptions associated with the closure and subsequent reopening of the Strait of Hormuz.
Production shut-ins
EIA assessed Middle East crude oil production shut-ins at 8.3 million barrels per day in June after outages peaked at 11.2 million barrels per day in May.
Expected recovery
EIA expected most crude production to return close to pre-conflict averages by the end of 2026 and most remaining shut-in production to return in the first quarter of 2027.
2025 ranking remains historical
These 2026 developments affect current-market interpretation but do not alter the completed calendar-year 2025 ranking.
How to read the ranking: it compares annual-average production in 2025. It is not a real-time ranking of country production during 2026.
Insights from the 2025 Top 10
Key Insight
The United States led Russia by 3.701 million barrels per day, giving the largest producer a substantial lead over second place.
Notable Pattern
The United States, Russia and Saudi Arabia produced 33.027 million barrels per day combined, equal to 54.3% of the Top 10 total shown here.
Regional Concentration
Five of the ten producers are grouped here in the Middle East: Saudi Arabia, Iraq, Iran, the United Arab Emirates and Kuwait.
Outlier
The largest adjacent gap near the top is between Saudi Arabia and Canada: 4.592 million barrels per day separates ranks three and four.
What the ranking means
Production is not reserves
A country can hold very large proved reserves while producing less because of policy, investment, infrastructure, field maturity or operating constraints.
Production is not exports
Domestic consumption, refinery demand, storage flows and trade policy affect how much crude oil ultimately reaches international markets.
Definition matters
Total petroleum-liquids rankings may include natural gas liquids and other components excluded from this crude oil and lease condensate comparison.
2025 versus 2026
The annual ranking is a historical benchmark. Current 2026 supply analysis should be read alongside current EIA market reporting.
FAQ
Which country produced the most crude oil in 2025?
The United States ranked first at 13.586 million barrels per day of crude oil including lease condensate.
Are these 2026 production figures?
No. Every ranking value represents calendar-year 2025 annual-average production.
Does the ranking include natural gas liquids?
No. Natural gas plant liquids are excluded. The metric covers crude oil including lease condensate.
Why is lease condensate included?
Lease condensate is included because it forms part of the EIA crude oil production series used for this ranking.
Why does the UAE rank above Brazil?
The underlying EIA values are 3.771 million barrels per day for the UAE and 3.769 million for Brazil.
Is crude oil production the same as reserves?
No. Production measures a flow over time, while proved reserves measure estimated recoverable quantities remaining underground.
Does the ranking include refinery output?
No. Refinery output and refinery processing gain are downstream measures and are excluded.
Why can another oil ranking show different values?
Other datasets may include natural gas liquids, biofuels, refinery processing gain or other petroleum liquids.
Why can current 2026 production differ?
The ranking measures annual-average 2025 production, while production and trade conditions changed materially during 2026.
How are ranks calculated?
Countries are sorted by the underlying EIA production value from highest to lowest before display conversion.
Sources
EIA International Rankings
Primary numerical source for exact 2025 country values and ranking order.
https://www.eia.gov/international/rankings/world?ev=false&f=A&pa=173&u=0&v=none&y=01%2F01%2F2025EIA International Energy Statistics
Official statistical environment for crude oil and lease condensate production.
https://www.eia.gov/international/data/world/petroleum/crude-oil-and-lease-condensateEIA Today in Energy
Supporting analysis of the leading 2025 crude oil producers and changes in U.S. and Saudi production.
https://www.eia.gov/todayinenergy/detail.php?id=67844EIA Short-Term Energy Outlook
Source for July 2026 Middle East production disruptions and expected recovery.
https://www.eia.gov/outlooks/steo/report/global_oil.phpEIA — U.S. crude oil production in 2025
Supporting source for U.S. production efficiency and the Permian region's contribution.
https://www.eia.gov/todayinenergy/detail.php?id=67404Related rankings
More StatRanker pages connected by topic, category or ranking theme.
Gold Production by Country 2026: 2025 USGS Mine-Production Estimates
Open rankingTop 20 Countries by Rare Earth Mine Production, 2025
Open rankingCountries by Phosphate Rock Mine Production, 2025
Open rankingTop 50 Countries by Uranium Mine Production (2025 Edition)
Open ranking
StatRanker (Website)
administrator
