

Dry Natural Gas Production by Country 2026: EIA 2024 Ranking
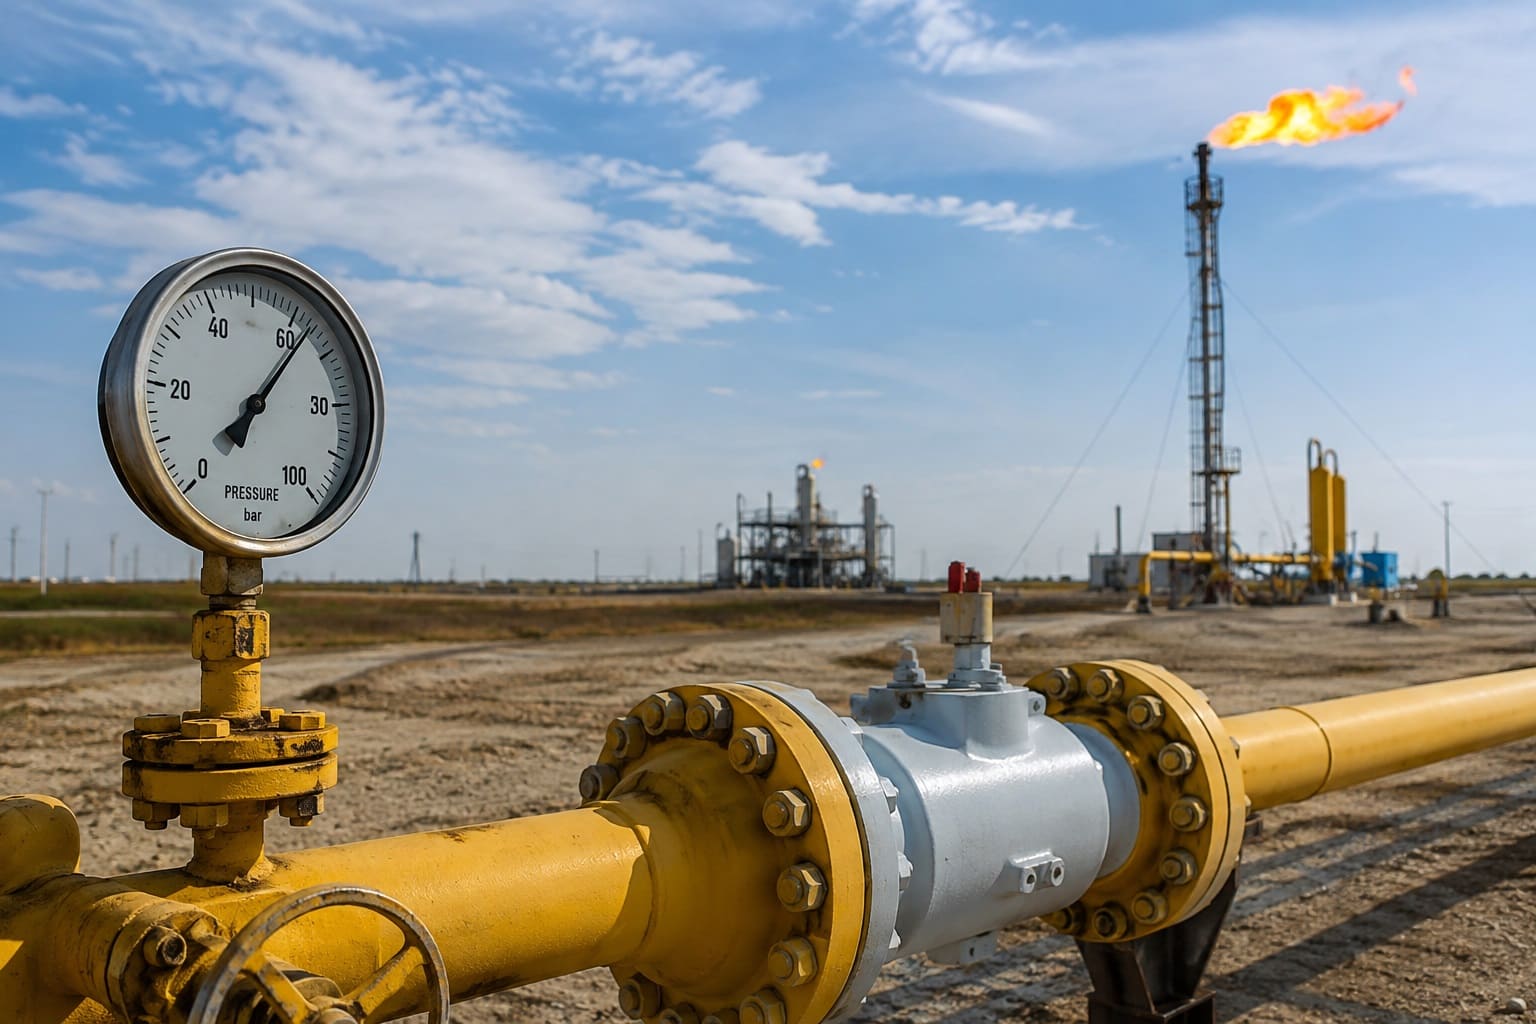
Global dry natural gas production: 2026 snapshot of EIA 2024 data
The United States ranks first in dry natural gas production in the 2024 U.S. Energy Information Administration international series, followed by Russia, Iran and China. The comparison uses one consistent physical measure: annual dry natural gas production.
Marketed production, gross withdrawals, LNG exports, pipeline exports and proved reserves are not mixed into the ranking. Values are shown in billion cubic meters (bcm), with larger production volumes ranked higher.
This is a 2026 snapshot based on EIA 2024 data. The table contains 50 EIA historical-series country observations for target year 2024. No 2026 forecasts or modeled production values are included. Data checked August 8, 2026.
Continue exploring
More StatRanker pages connected by topic, category or ranking theme.
Crude Oil Production by Country 2026: Top 10 EIA 2025 Ranking
Open rankingTop 30 Countries by Natural Graphite Mine Production, 2025
Open rankingElectricity Consumption by Country 2026: Top 50 EIA 2024 Ranking
Open ranking1,068.3 bcm in the EIA 2024 international series used for this ranking.
642.0 bcm in the International Energy Statistics series used consistently across the table.
Fifty countries from the EIA 2024 dry natural gas production ranking are included.
50 historical EIA rows · 0 forecast rows · 0 modeled projections.
What dry natural gas production measures
EIA defines dry natural gas production as marketed natural gas production after extraction loss has been removed. Extraction loss reflects the reduction in gas volume associated with separating natural gas plant liquids from the gas stream during processing.
Gross withdrawals are measured earlier in the production chain. Marketed production removes gas used for repressuring, volumes vented or flared and nonhydrocarbon gases removed during treatment or processing. Dry production then deducts extraction loss from marketed production.
Metric boundary: only dry natural gas production determines rank. LNG exports, pipeline exports, marketed production, gross withdrawals, consumption and proved reserves are separate indicators.
The table therefore answers a specific question: which countries produced the largest physical volumes of dry natural gas in 2024? It does not measure production value, export revenue, remaining reserves, gas quality, production cost or the share of output sold internationally.
Top 10 countries by dry natural gas production
The United States occupies a distinct first tier. Russia ranks second, followed by Iran and China. Canada, Qatar, Australia, Norway, Saudi Arabia and Algeria complete the ten largest producers in the EIA 2024 series used here.
Top 10 dry natural gas producers, 2024
| Rank | Entity | Value | Region / note |
|---|---|---|---|
| 1 | United States | 1,068.3 bcm | North America · EIA IES · 2024 · published historical value. |
| 2 | Russia | 642.0 bcm | Europe & Eurasia · EIA IES series · 2024 · published series value. |
| 3 | Iran | 279.0 bcm | Middle East · EIA IES · 2024 · published historical value. |
| 4 | China | 258.4 bcm | Asia-Pacific · EIA IES · 2024 · published historical value. |
| 5 | Canada | 199.0 bcm | North America · EIA IES · 2024 · published historical value. |
| 6 | Qatar | 170.0 bcm | Middle East · EIA IES · 2024 · published historical value. |
| 7 | Australia | 152.2 bcm | Asia-Pacific · EIA IES · 2024 · published historical value. |
| 8 | Norway | 130.9 bcm | Europe & Eurasia · EIA IES · 2024 · published historical value. |
| 9 | Saudi Arabia | 123.4 bcm | Middle East · EIA IES · 2024 · published historical value. |
| 10 | Algeria | 98.8 bcm | Africa · EIA IES · 2024 · published historical value. |
Rank follows the 2024 EIA International Energy Statistics dry-production series. Values are presented in billion cubic meters and rounded for display.
Top 20 dry natural gas producers in 2024
Production is strongly concentrated at the top. The United States is the only country above one trillion cubic meters in the table, while Russia is the only other producer above 600 bcm in the International Energy Statistics series used here.
Methodology
The ranking uses the U.S. Energy Information Administration International Energy Statistics series for dry natural gas production. Every published country row uses target year 2024, and values are ranked from highest to lowest.
Metric
Annual dry natural gas production. Marketed production, gross withdrawals, LNG exports, pipeline exports, consumption and reserves are excluded.
Unit
Production is displayed in billion cubic meters. EIA uses approximately 0.02831685 cubic meters per cubic foot for metric conversion.
Direction
Descending. Countries with larger annual dry-production volumes rank higher. Display rounding does not determine the rank.
Reference year
All published rows use 2024. The term 2026 describes the publication snapshot, not a production forecast year.
Coverage
The page includes the first 50 countries in the 2024 EIA dry natural gas production ranking used for this dataset.
Value treatment
The table contains EIA historical-series values only. No separate forecast or modeled 2026 production values are inserted.
Dry production versus other natural gas measures
EIA defines dry natural gas production as marketed production less extraction loss. Marketed production is gross withdrawals less gas used for repressuring, quantities vented and flared and nonhydrocarbon gases removed during treatment or processing. LNG and pipeline exports are trade flows rather than production measures.
How differences between EIA publications are handled
Country values are kept on one International Energy Statistics series so that the same source and revision context applies throughout the ranking. Values from separately published EIA country analysis briefs are not substituted into individual rows.
Russia: the International Energy Statistics series used throughout this table is represented here as 642.0 bcm for 2024. A separate EIA Russia Country Analysis Brief reports a preliminary 2024 estimate of 23.2 Tcf, approximately 657 bcm. Because the publications have different revision contexts, the country-brief estimate is disclosed but not mixed into the common ranking series.
Rounding and conversion
Values are displayed to one decimal place where appropriate. One trillion cubic feet is approximately 28.31685 billion cubic meters. Country rank follows the underlying series value rather than the rounded display label.
Inclusion and exclusions
The published scope is Top 50. Countries below rank 50 are outside this page's stated coverage. No missing 2024 values are estimated for inclusion, and no country is added using marketed production, gross withdrawals or trade statistics.
Limits
International energy statistics can be revised as national reporting changes or additional information becomes available, and some historical country observations can incorporate EIA estimates. Dry production does not measure production cost, calorific value, gas composition, domestic demand, export share, LNG capacity, pipeline capacity or economic value.
Main ranking: Top 50 dry natural gas producers
Search by country, filter by region or data status, change the sort order, or narrow the table to the Top 10 or Top 20. All rows belong to the same 2024 dry-production series used for this ranking.
Dry natural gas production by country, 2024 — billion cubic meters
| Rank | Entity | Value | Region / note |
|---|---|---|---|
| 1 | United States | 1,068.3 bcm | North America · EIA IES · 2024 · published historical value. |
| 2 | Russia | 642.0 bcm | Europe & Eurasia · EIA IES series · 2024 · published series value. |
| 3 | Iran | 279.0 bcm | Middle East · EIA IES · 2024 · published historical value. |
| 4 | China | 258.4 bcm | Asia-Pacific · EIA IES · 2024 · published historical value. |
| 5 | Canada | 199.0 bcm | North America · EIA IES · 2024 · published historical value. |
| 6 | Qatar | 170.0 bcm | Middle East · EIA IES · 2024 · published historical value. |
| 7 | Australia | 152.2 bcm | Asia-Pacific · EIA IES · 2024 · published historical value. |
| 8 | Norway | 130.9 bcm | Europe & Eurasia · EIA IES · 2024 · published historical value. |
| 9 | Saudi Arabia | 123.4 bcm | Middle East · EIA IES · 2024 · published historical value. |
| 10 | Algeria | 98.8 bcm | Africa · EIA IES · 2024 · published historical value. |
| 11 | Malaysia | 80.6 bcm | Asia-Pacific · EIA IES · 2024 · published historical value. |
| 12 | Turkmenistan | 77.6 bcm | Europe & Eurasia · EIA IES · 2024 · published historical value. |
| 13 | Indonesia | 69.8 bcm | Asia-Pacific · EIA IES · 2024 · published historical value. |
| 14 | United Arab Emirates | 59.4 bcm | Middle East · EIA IES · 2024 · published historical value. |
| 15 | Egypt | 47.5 bcm | Africa · EIA IES · 2024 · published historical value. |
| 16 | Argentina | 46.8 bcm | Latin America & Caribbean · EIA IES · 2024 · published historical value. |
| 17 | Uzbekistan | 46.2 bcm | Europe & Eurasia · EIA IES · 2024 · published historical value. |
| 18 | Oman | 44.3 bcm | Middle East · EIA IES · 2024 · published historical value. |
| 19 | Nigeria | 39.1 bcm | Africa · EIA IES · 2024 · published historical value. |
| 20 | Azerbaijan | 37.9 bcm | Europe & Eurasia · EIA IES · 2024 · published historical value. |
| 21 | India | 35.9 bcm | Asia-Pacific · EIA IES · 2024 · published historical value. |
| 22 | Mexico | 31.3 bcm | North America · EIA IES · 2024 · published historical value. |
| 23 | United Kingdom | 30.8 bcm | Europe & Eurasia · EIA IES · 2024 · published historical value. |
| 24 | Kazakhstan | 29.3 bcm | Europe & Eurasia · EIA IES · 2024 · published historical value. |
| 25 | Thailand | 27.0 bcm | Asia-Pacific · EIA IES · 2024 · published historical value. |
| 26 | Israel | 26.6 bcm | Middle East · EIA IES · 2024 · published historical value. |
| 27 | Venezuela | 25.4 bcm | Latin America & Caribbean · EIA IES · 2024 · published historical value. |
| 28 | Trinidad and Tobago | 25.3 bcm | Latin America & Caribbean · EIA IES · 2024 · published historical value. |
| 29 | Pakistan | 24.1 bcm | Asia-Pacific · EIA IES · 2024 · published historical value. |
| 30 | Brazil | 22.1 bcm | Latin America & Caribbean · EIA IES · 2024 · published historical value. |
| 31 | Bangladesh | 20.1 bcm | Asia-Pacific · EIA IES · 2024 · published historical value. |
| 32 | Kuwait | 19.9 bcm | Middle East · EIA IES · 2024 · published historical value. |
| 33 | Bahrain | 19.2 bcm | Middle East · EIA IES · 2024 · published historical value. |
| 34 | Ukraine | 18.2 bcm | Europe & Eurasia · EIA IES · 2024 · published historical value. |
| 35 | Peru | 13.6 bcm | Latin America & Caribbean · EIA IES · 2024 · published historical value. |
| 36 | Burma (Myanmar) | 12.9 bcm | Asia-Pacific · EIA IES · 2024 · published historical value. |
| 37 | Mozambique | 12.2 bcm | Africa · EIA IES · 2024 · published historical value. |
| 38 | Libya | 12.1 bcm | Africa · EIA IES · 2024 · published historical value. |
| 39 | Papua New Guinea | 11.4 bcm | Asia-Pacific · EIA IES · 2024 · published historical value. |
| 40 | Bolivia | 11.2 bcm | Latin America & Caribbean · EIA IES · 2024 · published historical value. |
| 41 | Brunei | 10.5 bcm | Asia-Pacific · EIA IES · 2024 · published historical value. |
| 42 | Iraq | 10.3 bcm | Middle East · EIA IES · 2024 · published historical value. |
| 43 | Colombia | 10.1 bcm | Latin America & Caribbean · EIA IES · 2024 · published historical value. |
| 44 | Netherlands | 9.7 bcm | Europe & Eurasia · EIA IES · 2024 · published historical value. |
| 45 | Romania | 9.2 bcm | Europe & Eurasia · EIA IES · 2024 · published historical value. |
| 46 | Equatorial Guinea | 6.7 bcm | Africa · EIA IES · 2024 · published historical value. |
| 47 | Vietnam | 6.4 bcm | Asia-Pacific · EIA IES · 2024 · published historical value. |
| 48 | Angola | 5.8 bcm | Africa · EIA IES · 2024 · published historical value. |
| 49 | Poland | 5.2 bcm | Europe & Eurasia · EIA IES · 2024 · published historical value. |
| 50 | Germany | 4.1 bcm | Europe & Eurasia · EIA IES · 2024 · published historical value. |
Primary ranking source: U.S. Energy Information Administration, International Energy Statistics, Dry natural gas production, target year 2024.
What stands out in the Top 50
Key Insight
The United States produced more dry natural gas than Russia and Iran combined in the common series used here: 1,068.3 bcm versus 921.0 bcm for the second- and third-ranked countries together.
Notable Pattern
The largest separation near the top is between Russia and Iran. Russia's series value of 642.0 bcm is more than twice Iran's 279.0 bcm, while Iran and China are separated by 20.6 bcm.
Regional Concentration
Five broad regions appear in the Top 10. The Middle East has three entries, while North America, Asia-Pacific and Europe & Eurasia each have two; Algeria represents Africa.
Outlier
The United States is the clearest scale outlier. Its listed 2024 production is about 10.8 times Algeria's 98.8 bcm even though Algeria ranks tenth.
How to interpret the ranking
A high position means a country produces a large annual volume of dry natural gas. It does not automatically mean the country exports a large share of that gas. Domestic demand, pipeline infrastructure and LNG liquefaction capacity determine how much production ultimately reaches foreign markets.
Production should also be kept separate from reserves. Annual production is a flow measured over a year, whereas proved reserves represent quantities expected to be recoverable under specified economic and operating conditions. Countries with large reserves do not necessarily have equally high annual production.
LNG rankings answer another question. LNG exports measure liquefied gas shipped internationally. Dry natural gas production measures gas produced inside the country after extraction loss, whether it is later consumed domestically, transported by pipeline or liquefied for export.
Comparisons are strongest when one definition, year and source series are maintained across all rows. This page therefore keeps the EIA International Energy Statistics dry-production series intact instead of replacing individual country values with figures from differently dated publications.
FAQ
Which country produced the most dry natural gas in 2024?
The United States ranks first in the series used for this table, followed by Russia, Iran and China.
Are these 2026 natural gas production figures?
No. This is a 2026 publication snapshot based on 2024 EIA data. The table does not estimate country production for 2026.
What does dry natural gas production mean?
EIA defines dry production as marketed natural gas production minus extraction loss. Extraction loss reflects the reduction in gas volume associated with removing natural gas liquids during processing.
Is dry production the same as marketed natural gas production?
No. Marketed production is measured before extraction loss is deducted. Dry production is therefore a narrower production measure.
Does the table rank LNG exporters?
No. LNG exports are international trade flows. A country can produce a large amount of natural gas while exporting only part of its output as LNG.
Why does the Russia value differ from another EIA publication?
This table keeps the EIA International Energy Statistics series consistent across all countries. A separate EIA Russia Country Analysis Brief reports a preliminary 2024 estimate of 23.2 Tcf, approximately 657 bcm. That country-brief estimate is disclosed in the methodology but is not substituted into the common ranking series.
Why are values displayed in billion cubic meters?
Billion cubic meters provide a compact unit for international comparison. One trillion cubic feet is approximately 28.31685 billion cubic meters.
What does this ranking not measure?
It does not measure proved reserves, gas prices, production cost, export revenue, LNG capacity, pipeline capacity, per-capita production or the share of production consumed domestically.
Sources
EIA World Rankings — Dry Natural Gas Production, 2024
Official EIA ranking interface for the 2024 dry natural gas production comparison.
https://www.eia.gov/international/rankings/world?ev=false&f=A&pa=10&u=2&v=none&y=01%2F01%2F2024
EIA International Energy Statistics — Dry Natural Gas Production
Primary country-level data environment and the common dry-production series used for the ranking values.
https://www.eia.gov/international/data/world/natural-gas/dry-natural-gas-production
EIA Natural Gas Production Definitions
Definition source used to distinguish dry natural gas production from marketed production, gross withdrawals and extraction loss.
EIA Natural Gas Annual
Supporting EIA annual publication used to cross-check the U.S. dry natural gas production concept and 2024 production total.
EIA Russia Country Analysis Brief
Supporting source for the separate preliminary 2024 Russia estimate discussed in the methodology. It is not substituted into the common ranking series.
https://www.eia.gov/international/content/analysis/countries_long/russia/
EIA Open Data Documentation
Technical documentation for EIA datasets, APIs, data structure and revision handling.
Related rankings
More StatRanker pages connected by topic, category or ranking theme.
Gold Production by Country 2026: 2025 USGS Mine-Production Estimates
Open rankingTop 20 Countries by Rare Earth Mine Production, 2025
Open rankingCountries by Phosphate Rock Mine Production, 2025
Open rankingTop 50 Countries by Uranium Mine Production (2025 Edition)
Open ranking
StatRanker (Website)
administrator
