
Top 10 Countries by Motorway and Paved Road
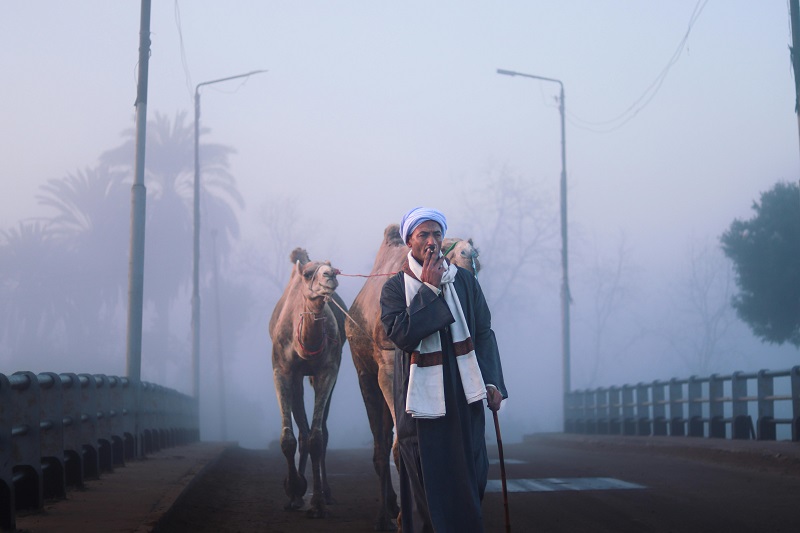
Mobility · Transport infrastructure · checked version Motorway and paved road density in 2025: how to read the ranking safely
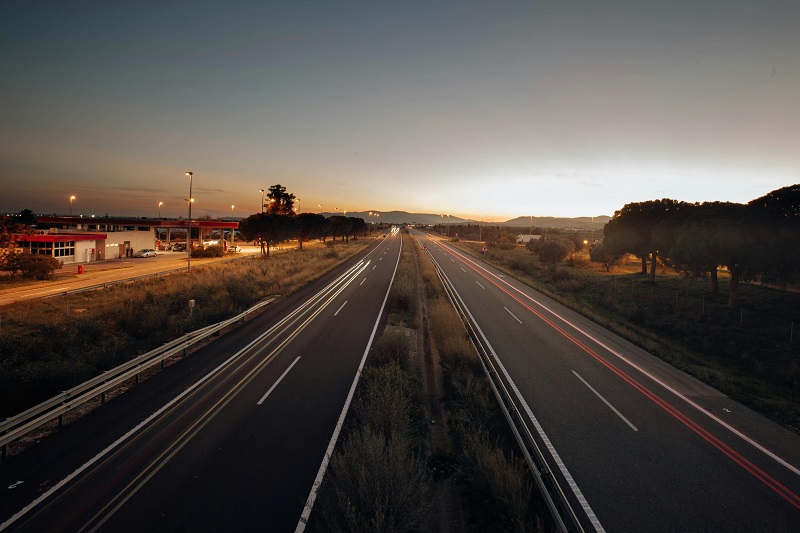
Mobility · Transport infrastructure · checked version Motorway and paved road density in 2025: how to read the ranking safely
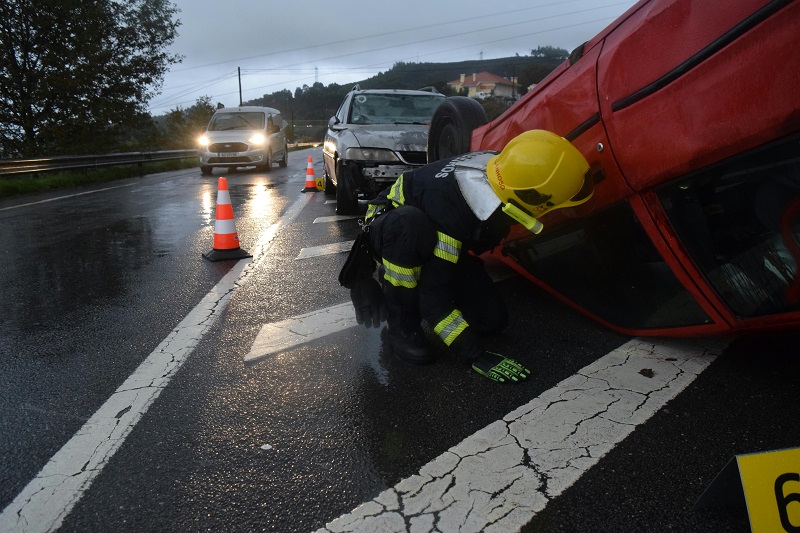
Road fatalities per 100,000 inhabitants: what the 2025 edition measures This ranking tracks the estimated road traffic death rate per

Mobility · Electrification · New car market EV share in new car sales shows which markets are moving fastest from
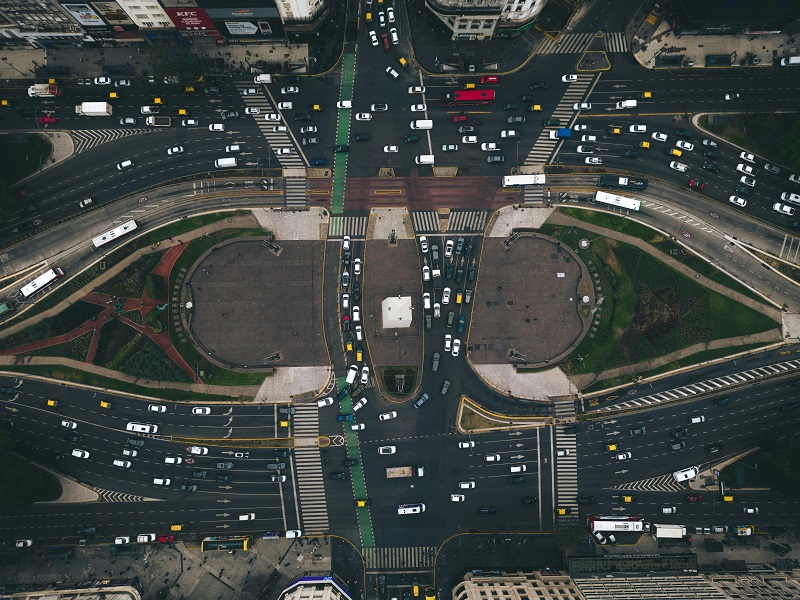
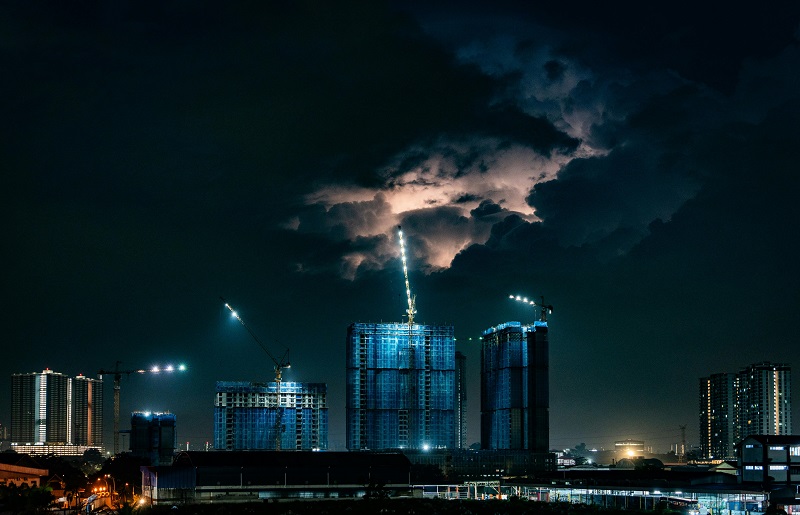
How to read the 2025 travel-time ranking for urban congestion This page is built around one headline metric from the
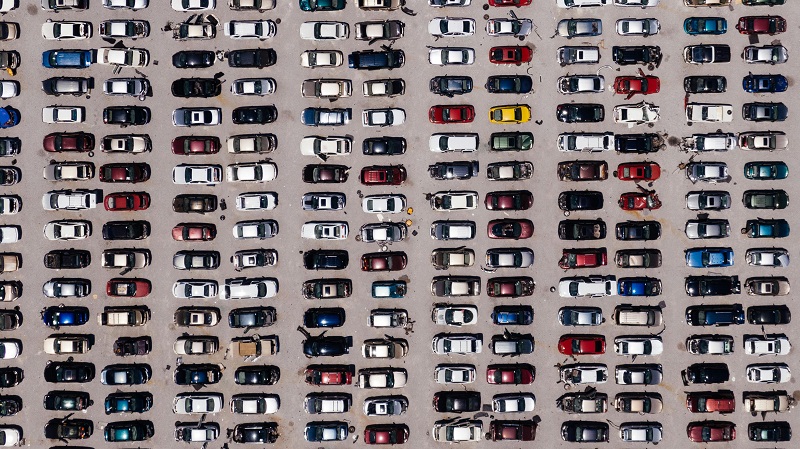
Static on-page dataset Passenger cars per 1,000 people • Top 100 • 2025 snapshot Passenger car ownership per 1,000 people:
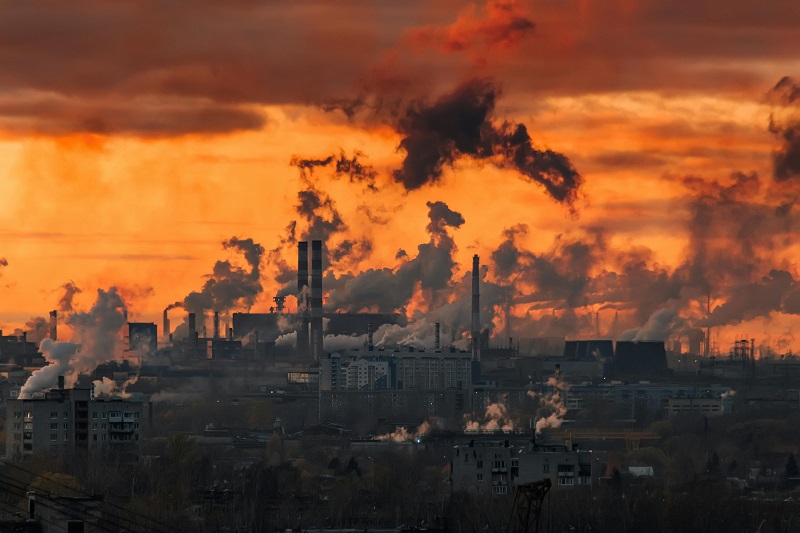
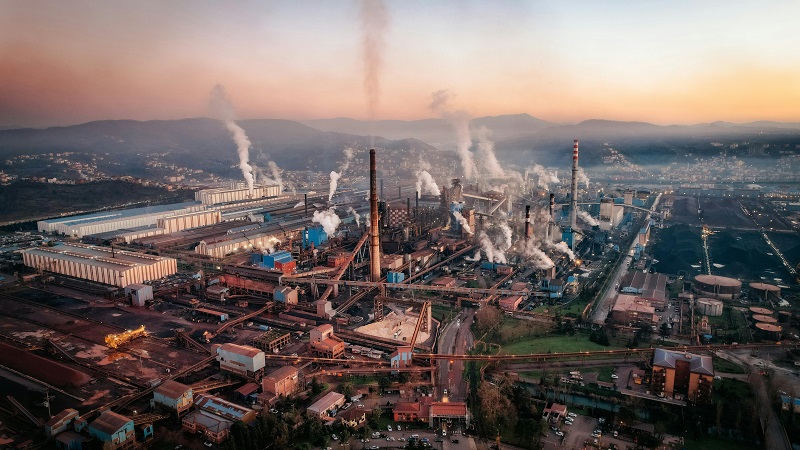
2025 edition • latest full-year data available: 2024 • unit: tonnes CO₂ per person Annual CO₂ emissions per capita: what
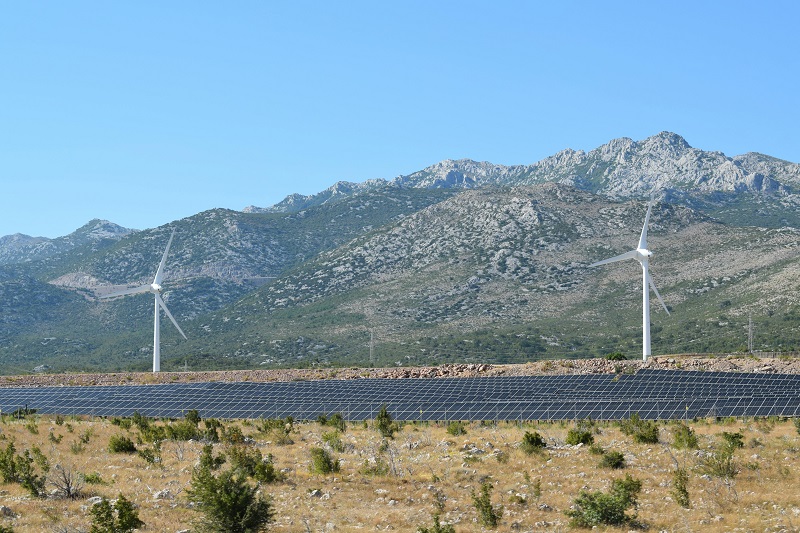
Metric focus: electricity generation mix Latest full-year country data: 2024 (published/updated in 2025) Renewable electricity share in 2025: why “power
Climate Risk Index 2025: a composite view of heat, floods and storms (0–100) “Climate risk” is often confused with “how
Metric focus: exposure (not probability) Horizon: 2050 Units: people exposed (approx.) How to read “exposure” in a 2050 sea-level-rise ranking
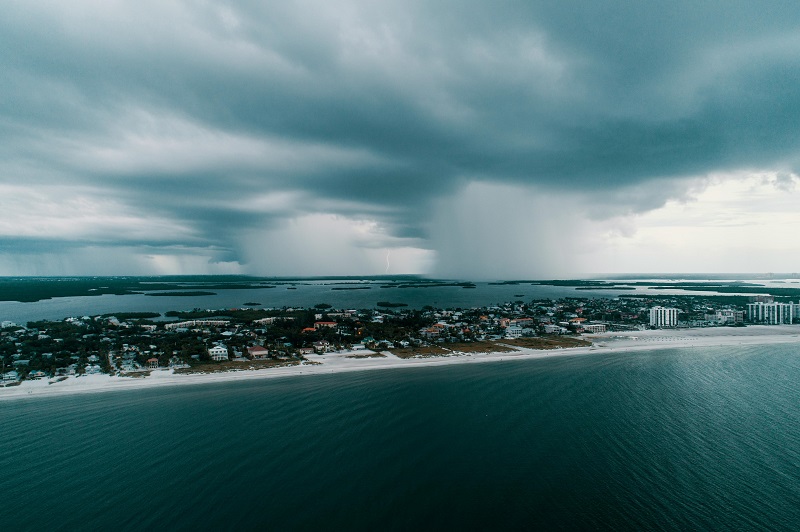
Extreme-weather event frequency: what the Top 100 ranking measures The ranking Top 100 Countries by Frequency of Extreme Weather Events
Metric: Annual mean PM2.5 (µg/m³), calendar year 2025 (provisional) PM2.5 City Ranking 2025: Annual Exposure Beats “Smog Peaks” PM2.5 refers

Climate Normals vs “Now”: Why 1991–2020 Still Matters When We Talk About 2025 This ranking focuses on average annual near-surface
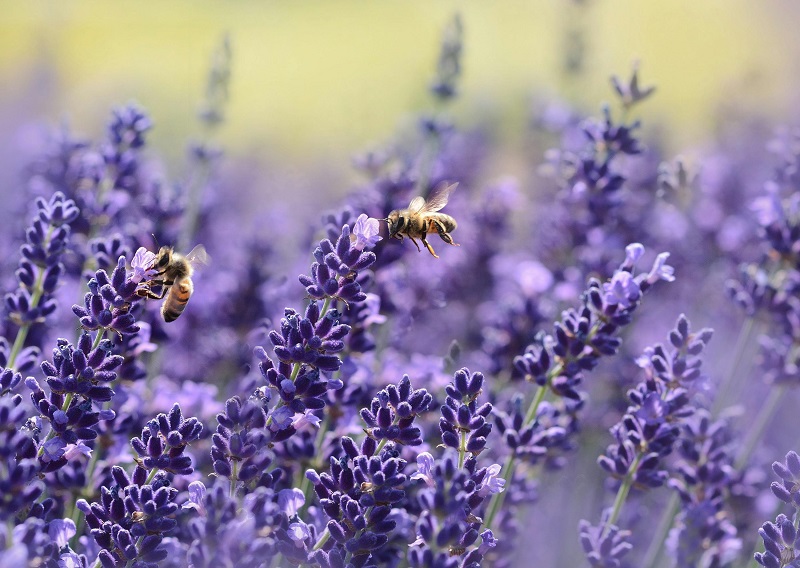
Pollinator Diversity in 2025: what “species richness” reveals (and what it doesn’t) Pollinators—especially wild native bees (not managed honey bees)

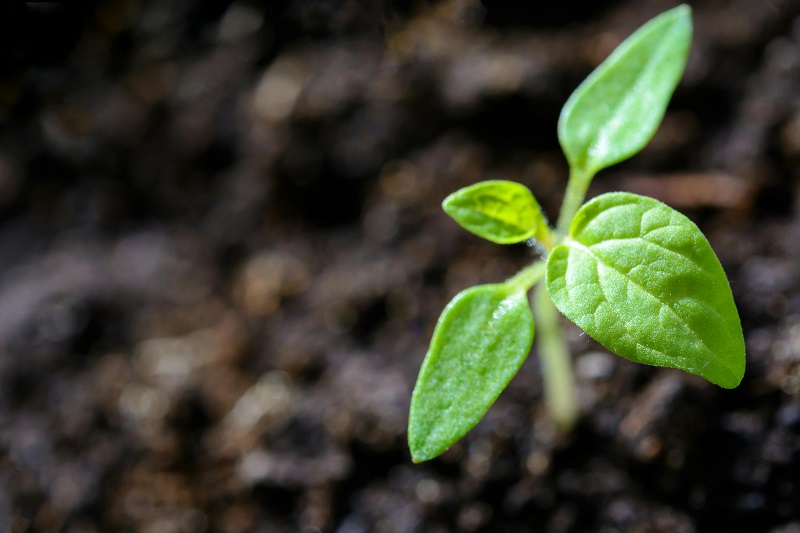
Snapshot: 2025 • Metric: Forest area per capita (ha/person) Forest Area per Capita: the “Forest per Person” League Table (Top
Protected Land Leaders: Top Countries by Share of Land in Protected Areas (2025 snapshot) This ranking tracks terrestrial protected areas
Nature & Biodiversity Rankings Threatened plant species by country (2025 snapshot): where extinction risk concentrates Plants are the quiet infrastructure
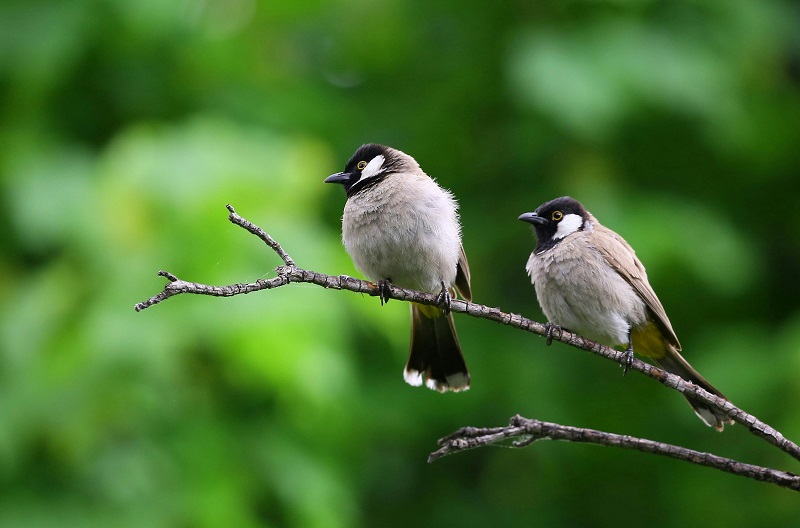
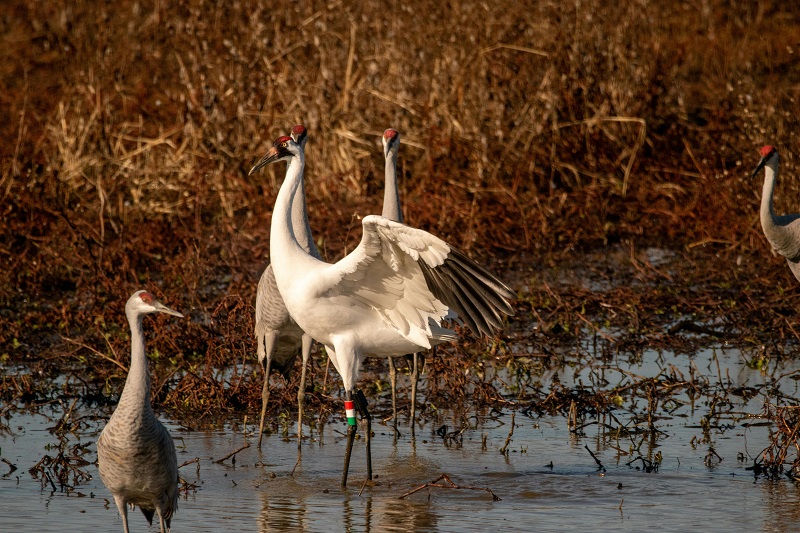
Bird Species Diversity by Country (2025): What This Ranking Measures This is a country-level comparison of bird species richness: how
StatRanker • Nature & Biodiversity • 2025 edition This page summarizes threatened animal species using the IUCN Red List framework.
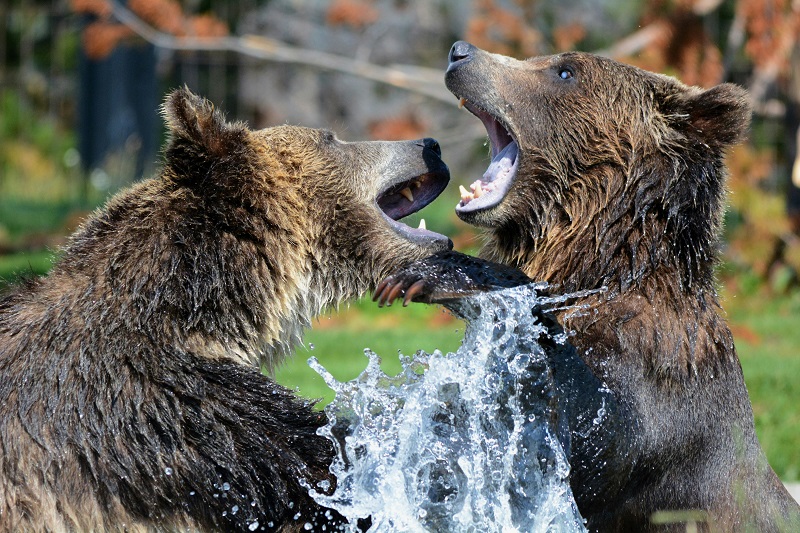
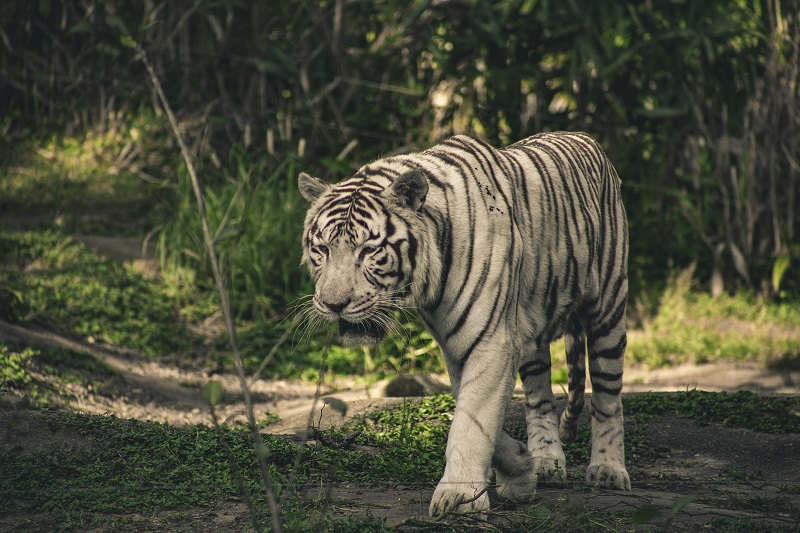
Wildlife & Biodiversity · Analytical ranking Where the world’s wild mammal diversity is concentrated in the latest country-level data Wild

Global healthcare capacity · 2025 snapshot Which health systems have the deepest bench of physicians in 2025? This ranking looks

Health spending per person · full country ranking How much do countries spend on health per person in 2025? This
Foreign-born population · full country ranking Mapping the world’s top destinations for foreign-born residents in 2025 What does “foreign-born share”

Population · Aging How rapidly ageing societies are reshaping the global population pyramid Countries where people aged 65 and over

Birth & Death Rates · Population 2022–2024 harmonised estimates How the 2025 global fertility league splits the world into high-

Population · Demographics · 2025 snapshot The 2025 population ranking is a scale map of the modern world. It shows

Population · Life Expectancy Life expectancy in 2025: who lives longest — and how far above the global norm? This

Real wage growth 2020–2025: where pay truly beat inflation This ranking looks at where workers’ purchasing power actually increased between
