


Top 50 U.S. States by Goods Exports (Value)
Ranking • State trade Metric: Goods exports (origin of movement) Latest full year in this snapshot: 2024 Units: USD billions (nominal) Updated: 2026-02-05 Where U.S. goods
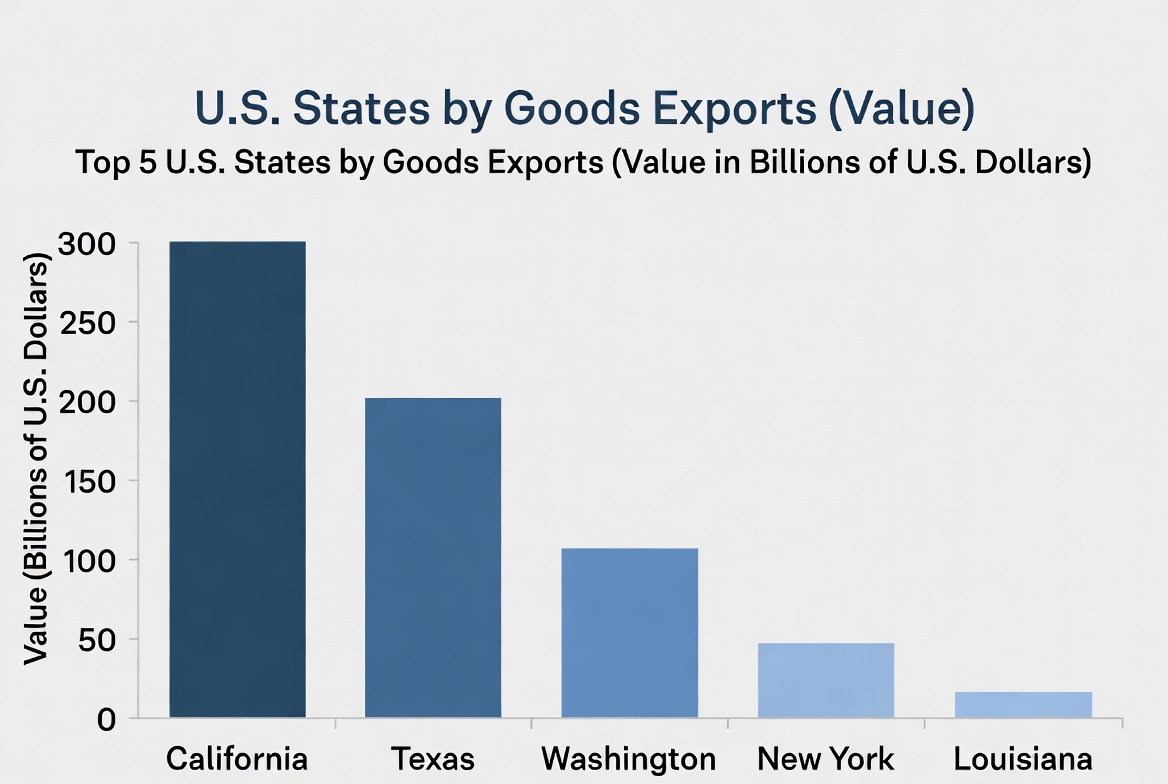
Ranking • State trade Metric: Goods exports (origin of movement) Latest full year in this snapshot: 2024 Units: USD billions (nominal) Updated: 2026-02-05 Where U.S. goods
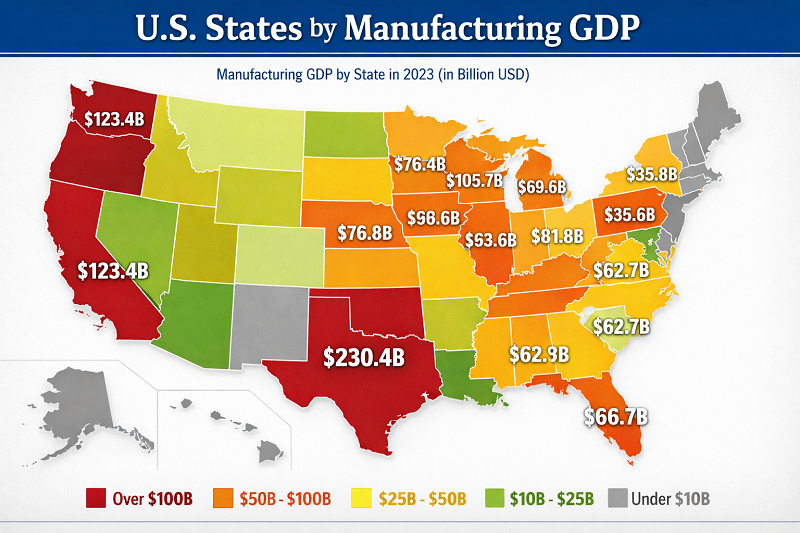
Ranking • Production focus Manufacturing GDP by state: where real output is concentrated (latest year: 2024) Metric: Manufacturing GDP (NAICS
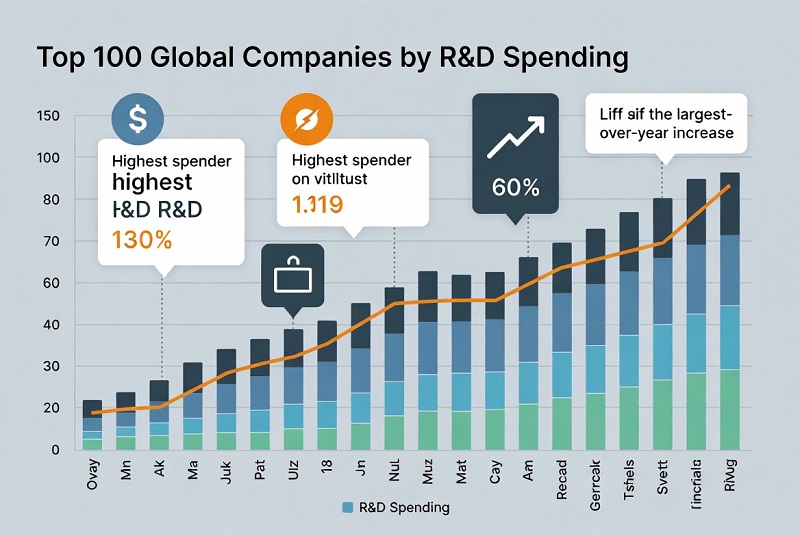
Corporate R&D investment: who spends the most (FY2024) This page ranks the largest corporate investors in research and development using
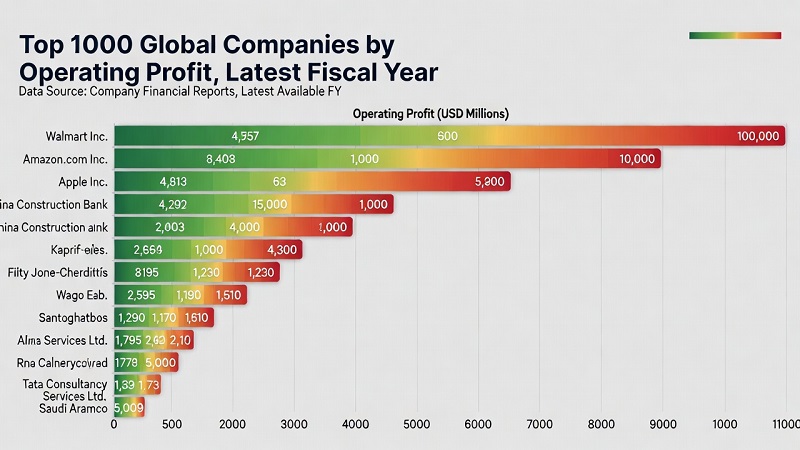
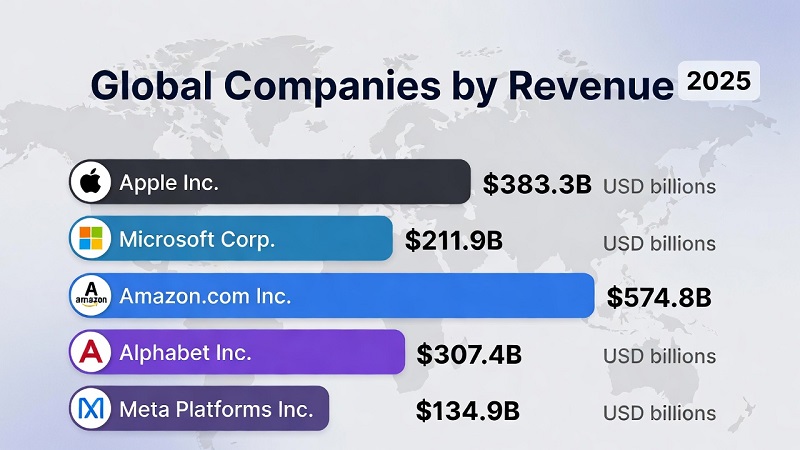
Most profitable companies • Operating profit (EBIT-style) • Latest FY in Scoreboard dataset • Updated: 2026-01-29 This ranking orders the
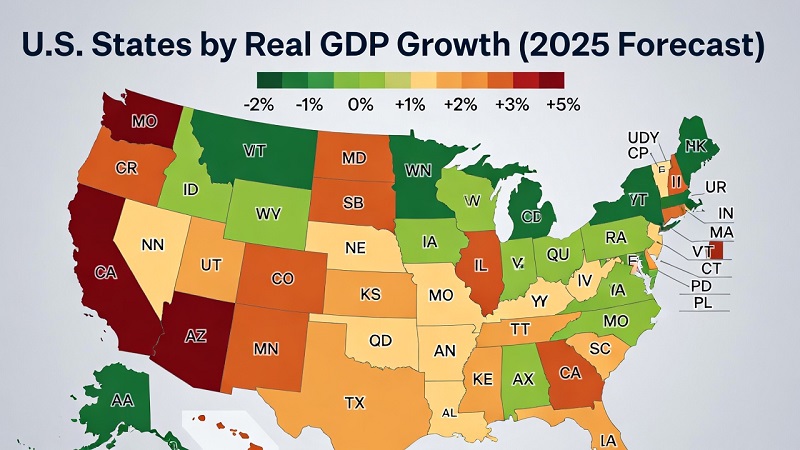
BEA • Real GDP (chained dollars) Quarterly Percent change at annual rate (SAAR) Revisions possible Last updated: January 28, 2026
Disclaimer. This page is for educational use only and is not investment, financial, legal, or tax advice. Markets are volatile,
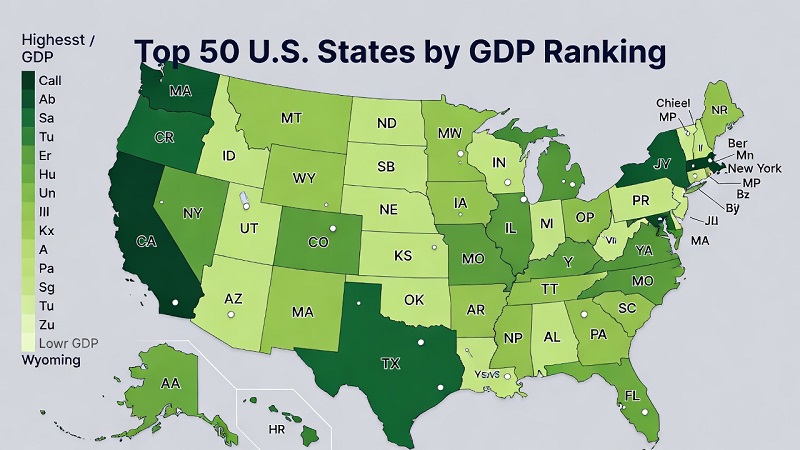
Economy · 2026 Update (2024 preliminary data) This ranking uses current-dollar (nominal) gross domestic product by state from the U.S.

Largest car markets • Unit-based market size • Country ranking New vehicle sales by market provide a consistent unit-based view

Cities, Urban Life & Quality of Living Economy & Living Standards Reference: 2025 edition This ranking shows where renting is

Digital, Innovation & Knowledge Economy Indicator: Mobile data cost Unit: USD per 1GB (standardized) Year: 2025 Coverage: 200+ economies (ranked

Economy · Wages and incomes of the population Updated: January 18, 2026 Metric: median household income Scope: 50 states (excludes

Public health · Tobacco use · WHO estimates Adult Tobacco Use Prevalence by Country 2025: Top 100 WHO Ranking Data

A model-level ranking of the world’s highest-volume vehicles in 2025, with a practical, publisher-friendly layout: overview, methodology, a Top 100

Public health · mortality statistics · 2026 reference snapshot Countries with the highest recorded suicide mortality rates Suicide mortality rate

Macroeconomics · nominal GDP · IMF WEO October 2025 snapshot Last updated: April 30, 2026 Largest economies in 2025 by

Public safety · intentional homicide · latest-available snapshot Countries and Territories with the Highest Homicide Rates per 100,000 People Homicide
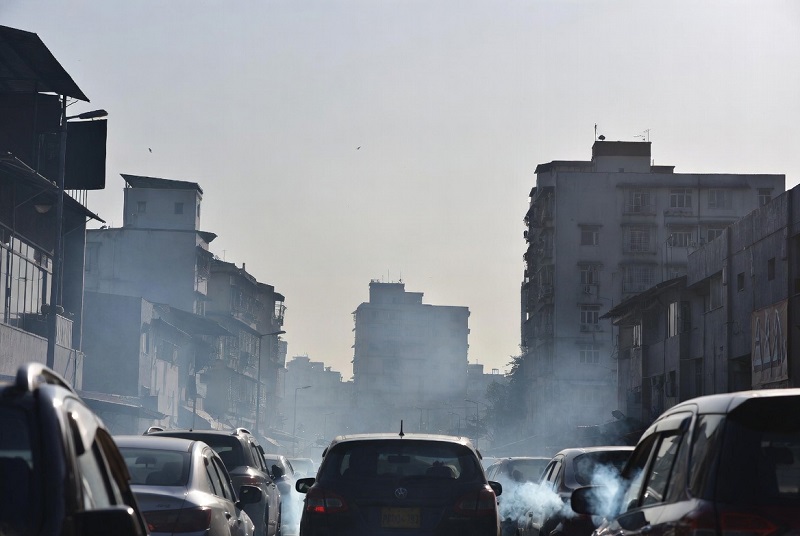
Climate, air quality and public health PM2.5 Air Pollution by Country: Latest Available World Bank/GBD Data PM2.5 means fine particulate

Environment & Resources · Energy & EV Analysis “Per capita” CO₂ is one of the fastest ways to understand how

Economy & Living Standards · Wages & incomes Data refresh: loading… People often google “median household income by country” expecting

Economy & Living Standards · Poverty rate ranking Poverty Rate Ranking: What the Latest International Data Shows Updated: April 27,
Top Electric Vehicles by Maximum Range (EPA Miles per Charge), 2025 Mobility • Rankings • 2025 Top Electric Vehicles by
StatRanker · Mobility This 2025 ranking focuses on real-world-friendly efficiency signals: EPA combined MPG for gasoline/hybrids and combined MPGe +

Mobility · Safety ranking · 2025 edition “Safest car” is not a single star rating, and it is not only

Mobility • Vehicle market “Best-selling” sounds simple until you define the unit of counting. In the U.S. market, sales leadership

“Most sold cars” sounds like a simple list. In practice it’s a measurement problem: the same badge on the trunk

Mobility · Auto Insurance · 2026 Edition Top 50 U.S. States by Average Car Insurance Cost (Full Coverage), 2026 The

Mobility • U.S. Insurance • 2026 composite ranking Composite score (0–100) Complaints • Claims • Financial strength Coverage & UX
