


Top 100 Countries by Female Labor Force Participation
Economy · Demography · Gender statistics Why female labor force participation is one of the clearest cross-country signals in the
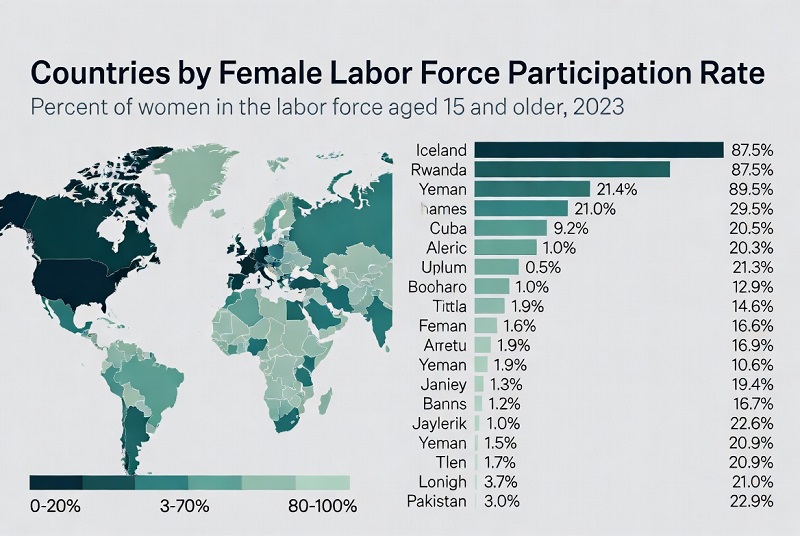
Economy · Demography · Gender statistics Why female labor force participation is one of the clearest cross-country signals in the
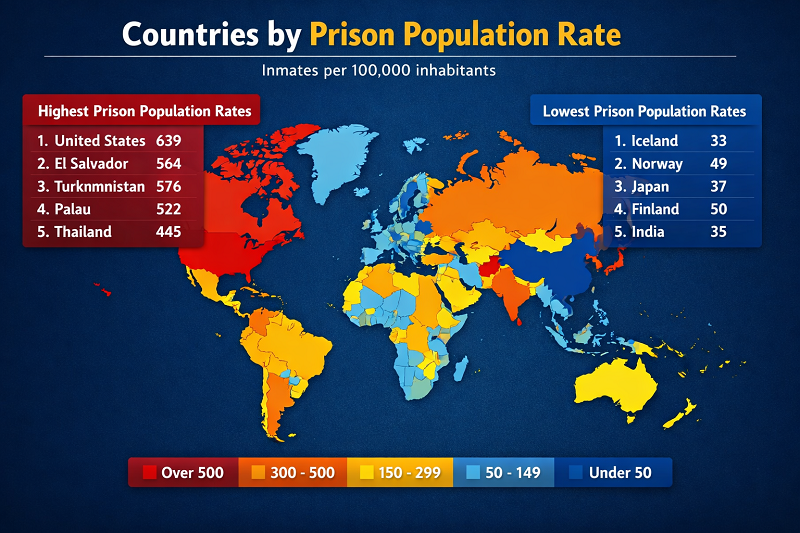
How prison population rate should be read in a 2025 snapshot Indicator: prisoners per 100,000 population · Scope here: sovereign
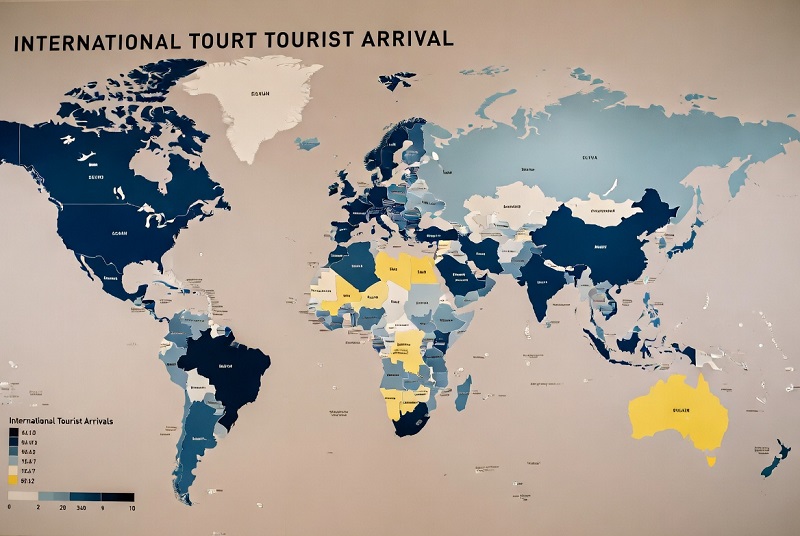
Top countries by international tourist arrivals International tourist arrivals measure inbound overnight trips made by non-resident visitors. The indicator shows

Geopolitics · Defense budgets · SIPRI How military expenditure as a share of GDP shows defense burden in 2025 Military
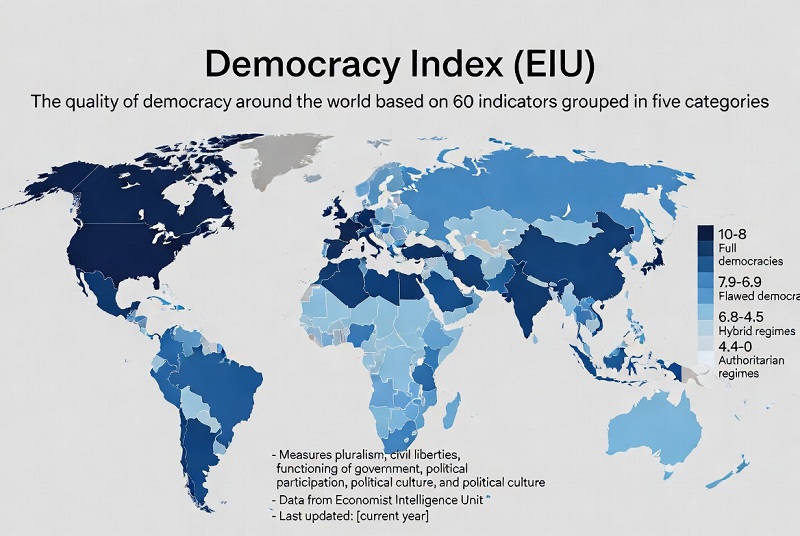
The latest available global ranking comes from EIU’s Democracy Index 2024, published in 2025 and used here as the current
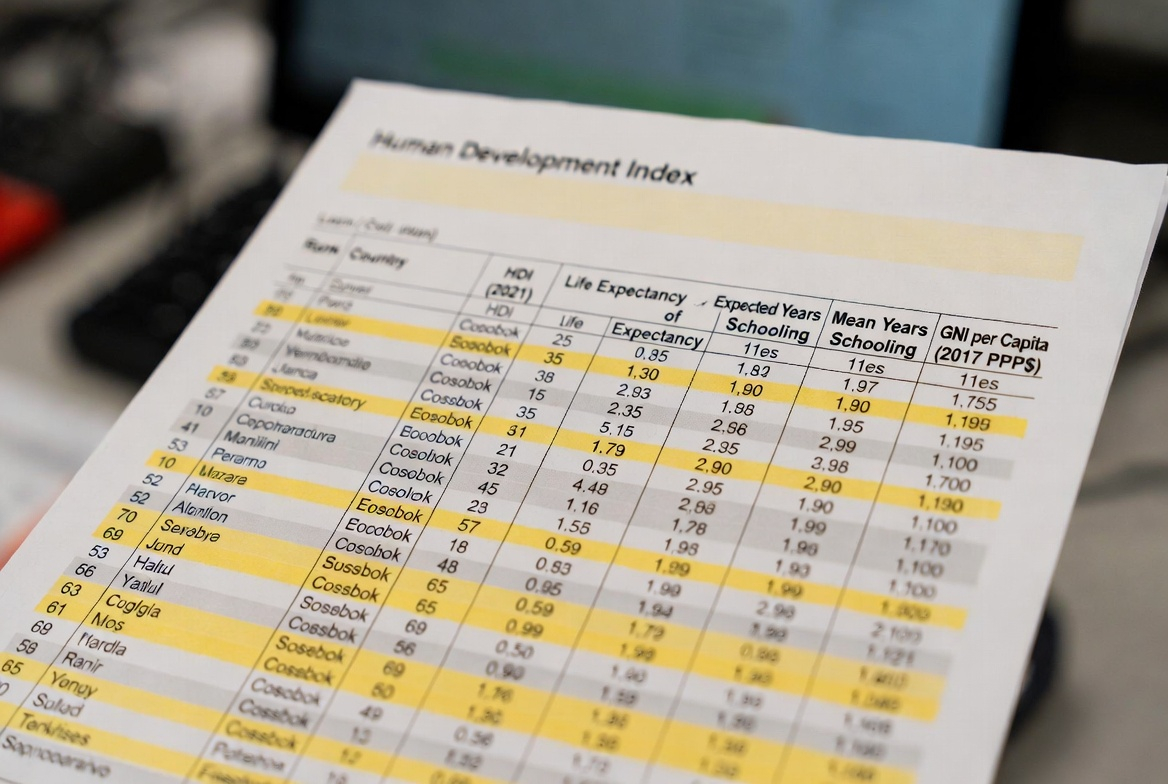
Society · Development · Composite index HDI Ranking 2025: Top 100 Countries by Human Development Index The HDI Ranking 2025

Rare earth mine production remains one of the most concentrated mineral supply chains in the world. Mineral Commodity Summaries 2026
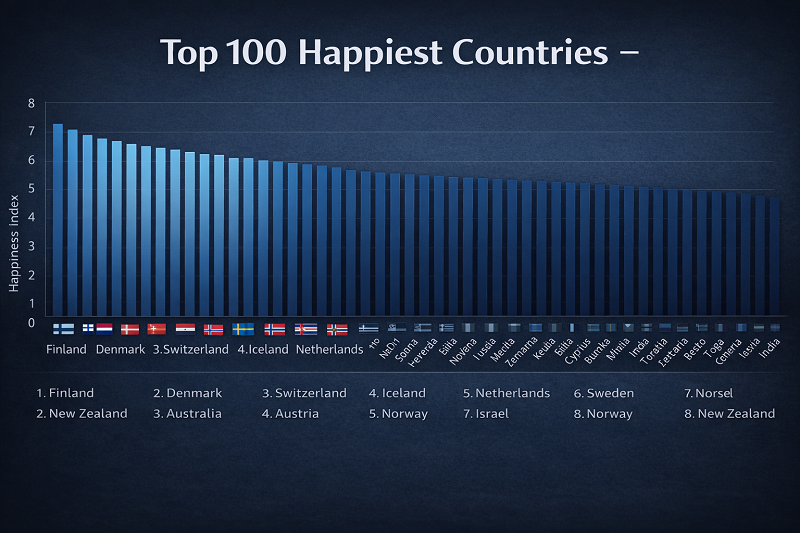
Society · Wellbeing · World Happiness Report How the World Happiness Report measures national wellbeing The World Happiness Report ranks
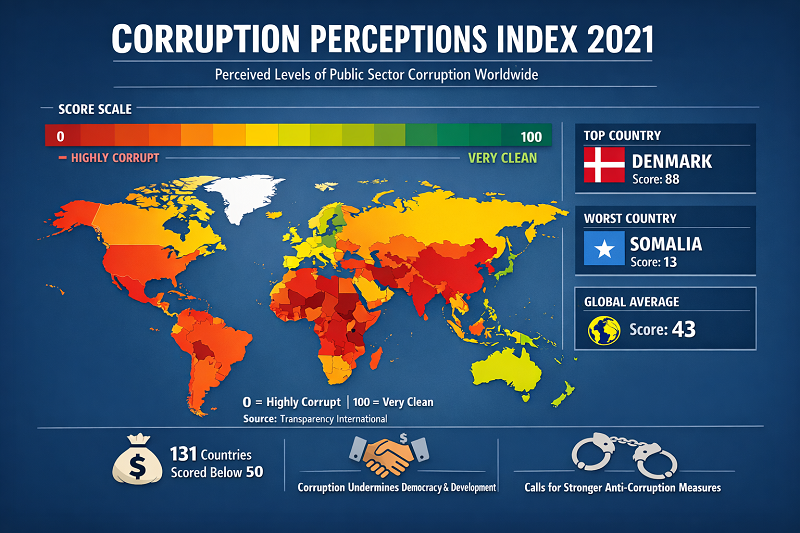
Governance · Transparency International · CPI 2025 The Corruption Perceptions Index (CPI) scores 182 countries and territories on perceived public-sector

The Greatest Films of All Time — Sight & Sound 2022 Critics’ Poll Culture · Film Canon · Critics’ Poll

Cities, Urban Life & Quality of Living Updated: February 26, 2026 Reference year: 2024 (official series) Apartment size: ≈60 m²
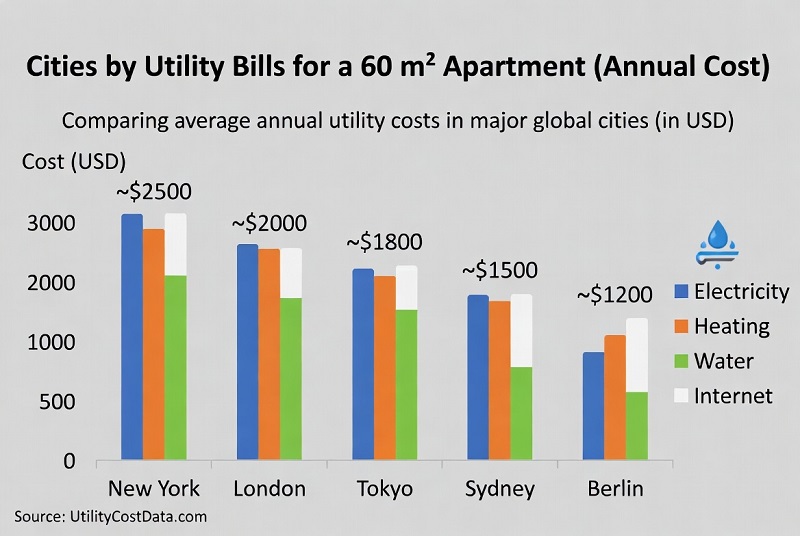
Data snapshot: February 26, 2026 Page checked: May 4, 2026 Most Expensive Cities for Utilities in 2026: Top 100 Annual

Global vehicle fleet age • safety • ownership cost Oldest car fleets: where “old vehicles” dominate — and why it

United States · Calendar year 2025 · Passenger cars & SUVs (fuel-focused) Top-selling brands by passenger car & SUV sales

All-in-one page — Part 1/3 Sales snapshot (unit sales) — by year, half-year, and region This section summarizes Mercedes-Benz unit
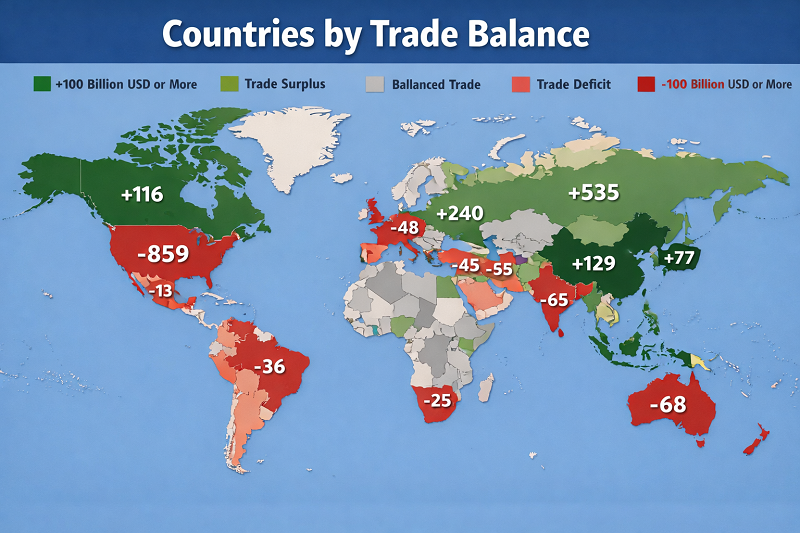
Metric: Trade balance (net exports), current USD Proxy year: 2023 (latest widely available) Extracted: February 16, 2026 Trade balance snapshot
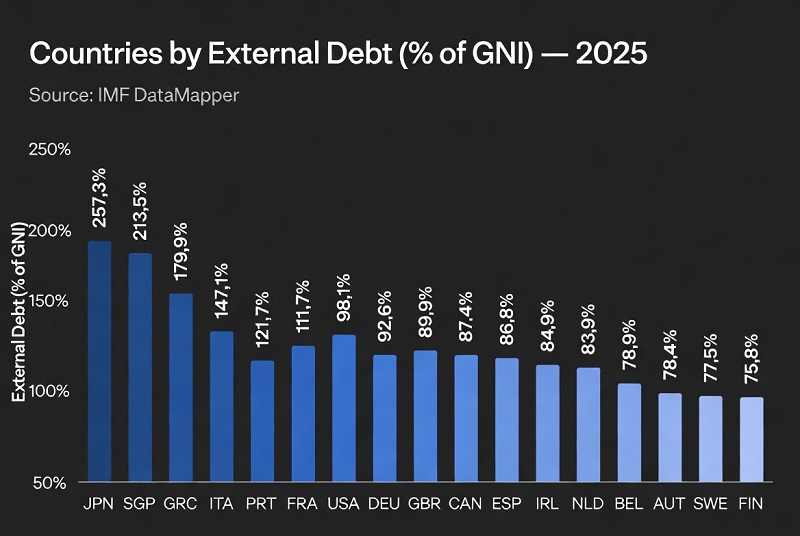
External debt snapshot (2025, using latest available year as proxy) What this ranking measures This ranking compares economies by external
Private credit depth (bank lending to the private sector) This benchmark tracks how large bank credit to households and non-financial

Metric: Interest payments (% of revenue) Snapshot: latest available year (often 2022–2024) Coverage: government reporting varies by country When interest

Economy · Prices · Monetary stability Inflation volatility is not the same as high inflation. A country can experience persistently
External sector · Balance of payments Countries by current account balance (% of GDP) — 2025 snapshot (latest full-year data
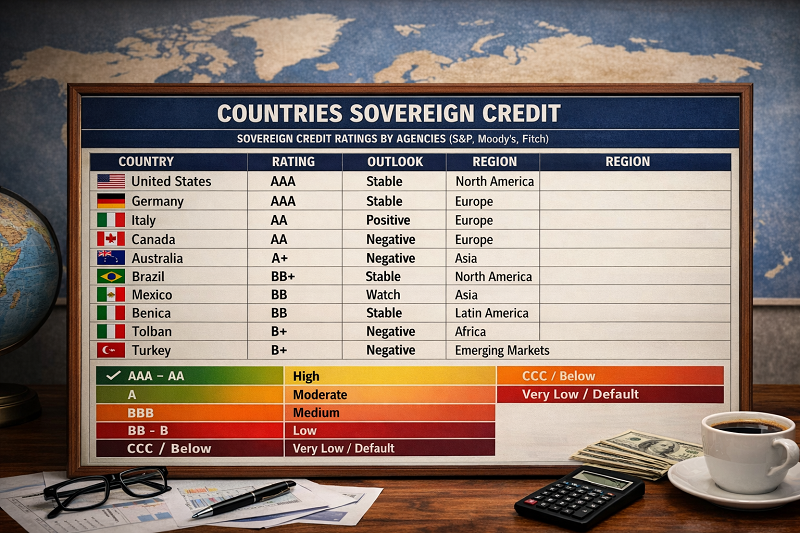
Snapshot date: February 15, 2026 Score: 0–100 (higher = stronger) Focus: long-term sovereign ratings (foreign-currency where available) What this ranking measures A sovereign

Finance · Macroeconomics · Reserve Assets Countries by Foreign Exchange Reserves — 2025 Ranking StatRanker Editorial March 26, 2026 Data:
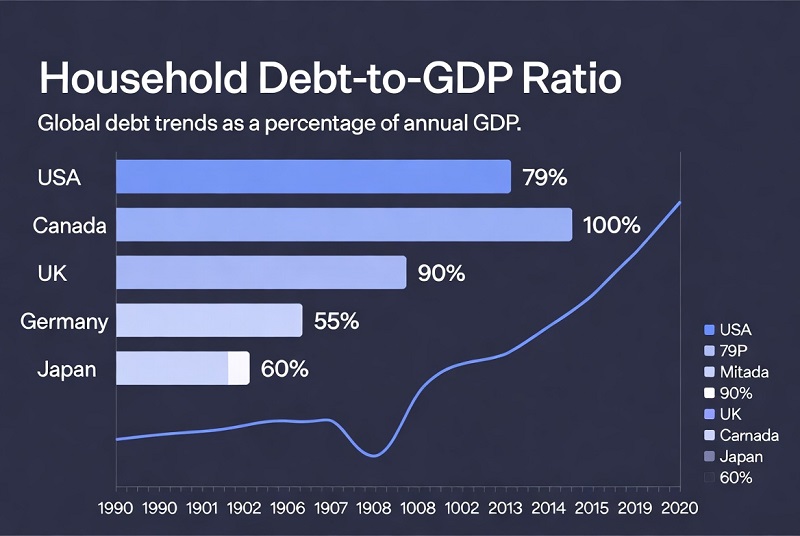
Metric: Household debt / GDP Unit: % of GDP Snapshot: 2025 (latest available quarter, BIS) Reference: Q2 2025 (end-of-quarter) What
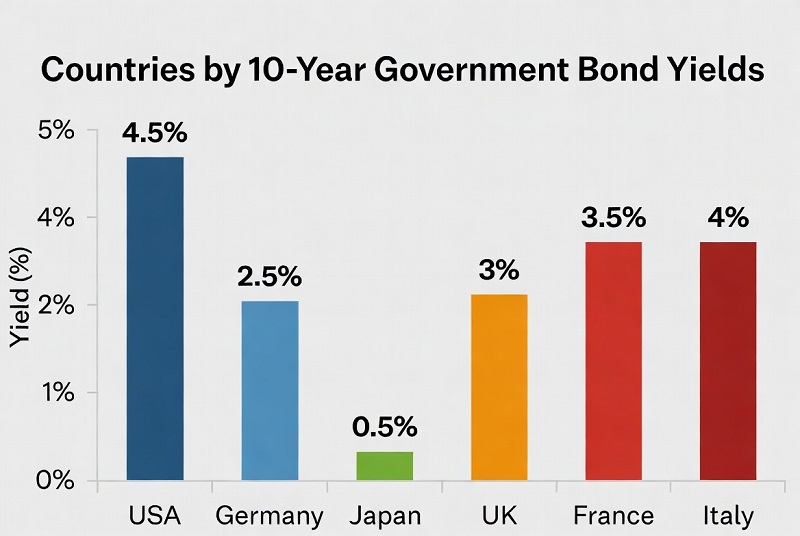
Sovereign yields · highest borrowing costs Countries by 10-year government bond yields (latest snapshot) A 10-year government bond yield is
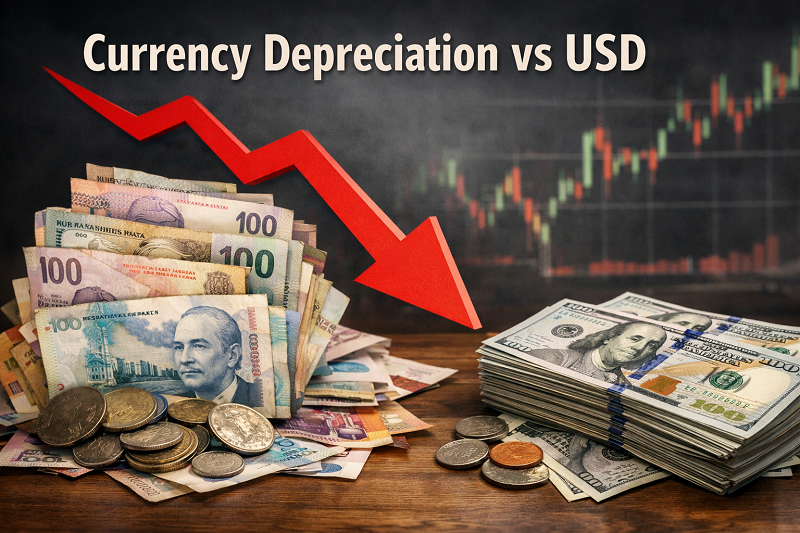
Global FX · Weakest currencies vs USD · Latest Feb 2026 snapshot Weakest Currencies Against the U.S. Dollar: Biggest Year-over-Year
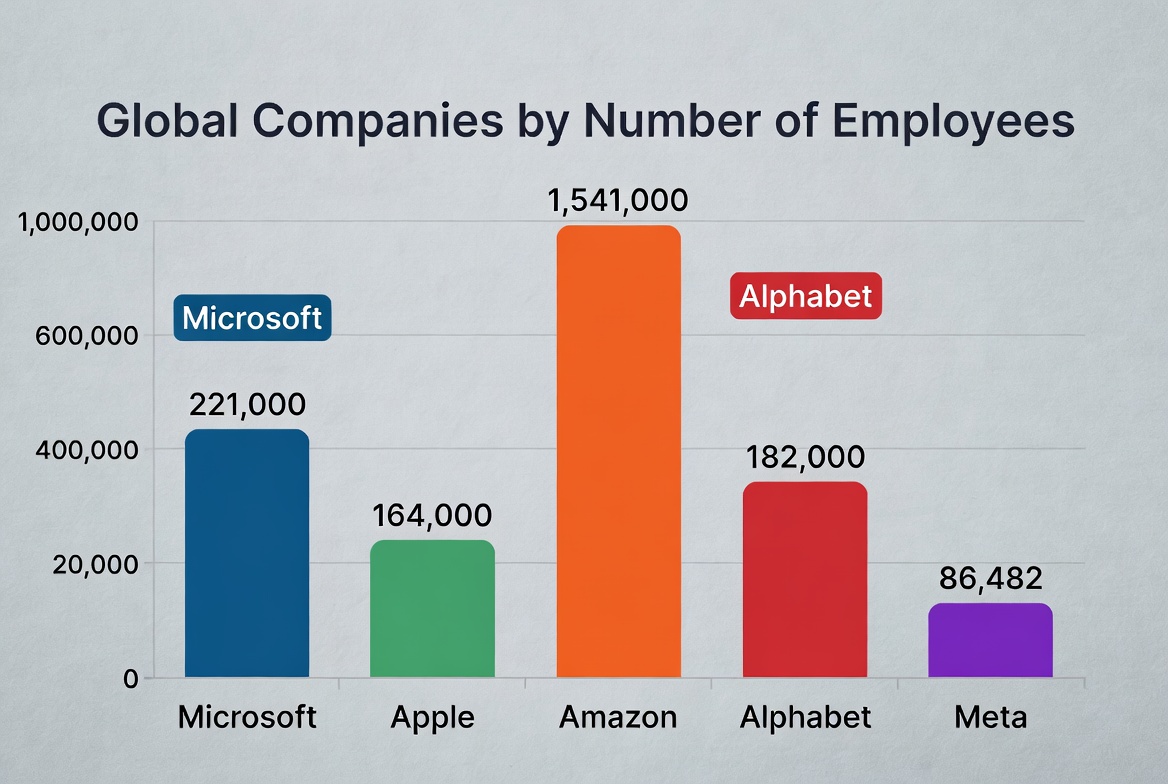
Largest employers • global public-company snapshot Employee headcount is a pure scale signal. It captures operating footprint, service capacity, and
