

Coal Consumption by Country 2026: Official EIA 2024 Ranking
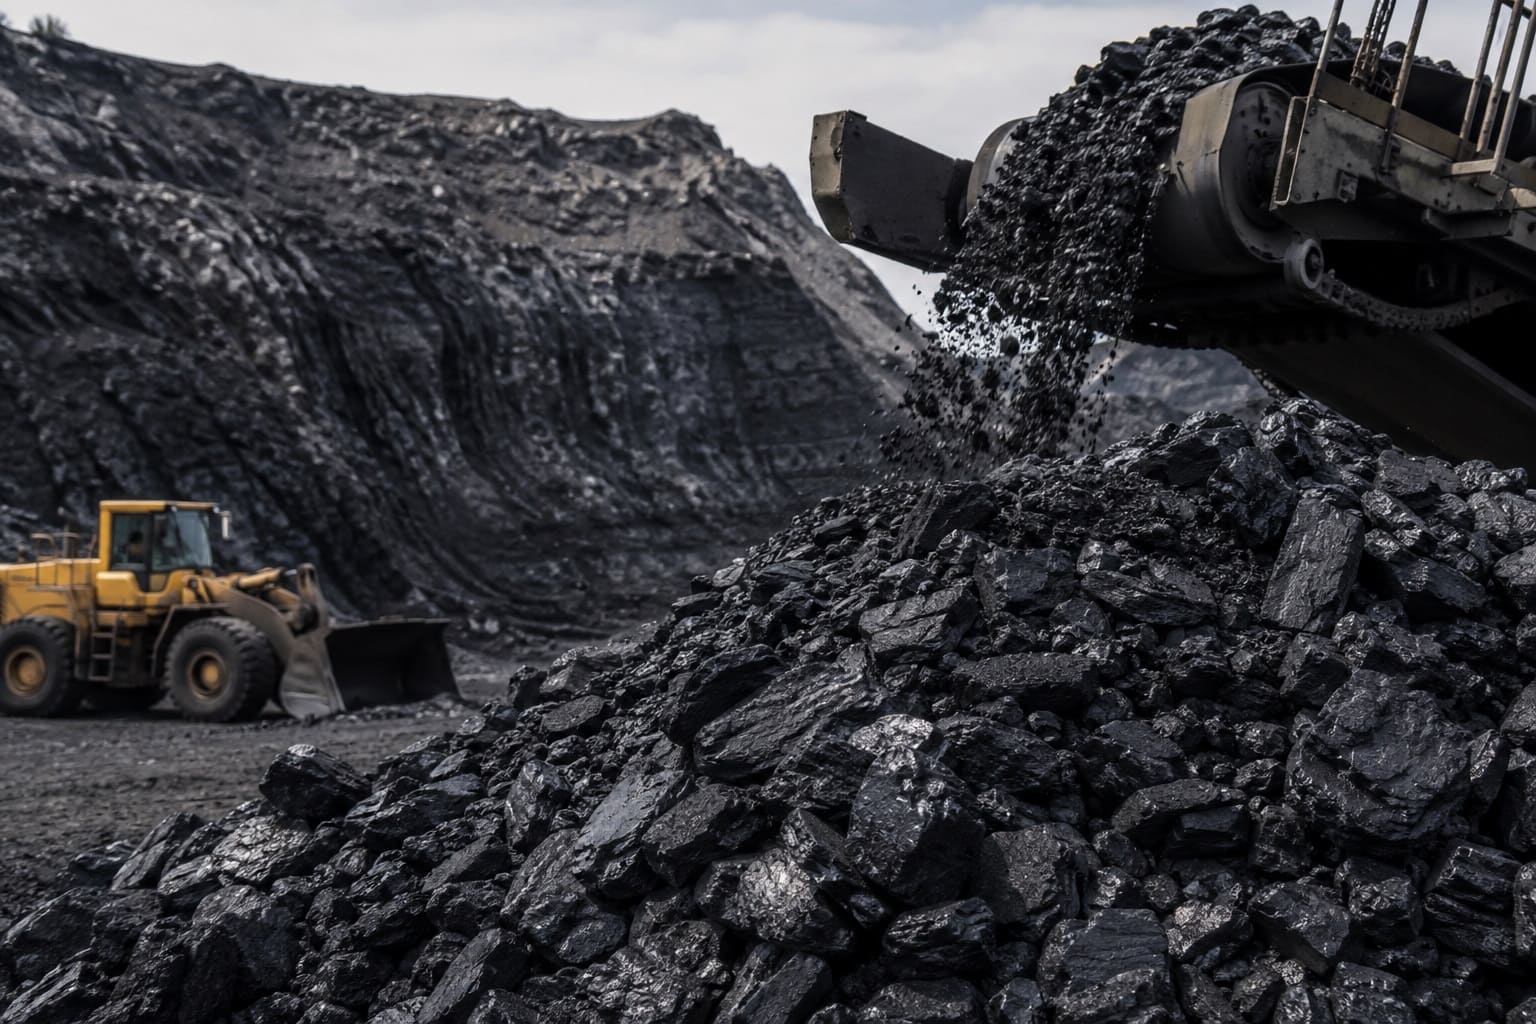
Global Coal Consumption in the Latest EIA Data
China was the world's largest coal consumer in 2024, using 105.298 quadrillion Btu of coal energy according to the U.S. Energy Information Administration. India ranked second at 21.804 quadrillion Btu, followed by the United States at 7.912 quadrillion Btu.
This 2026 snapshot uses official EIA data for 2024 rather than projected 2026 consumption. The metric is total energy consumption from coal, measured in quadrillion British thermal units. Countries with higher consumption rank higher.
The ranking uses a common energy unit rather than physical tonnes. This makes coal use more comparable across countries because different coal grades contain different amounts of energy per tonne.
Coverage: 12 countries. Unit: quadrillion Btu. Data year: 2024. Source: U.S. Energy Information Administration International Energy Statistics. All 12 rows are official values; there are no forecasts or modeled projections.
Quadrillion Btu of coal energy consumed in 2024.
China consumed about 4.8 times as much coal energy as India.
The United States ranks third in the 2024 EIA data.
All values use the same energy unit: quadrillion Btu.
Data year 2024; no forecast or modeled-projection rows.
What Coal Consumption Measures
Coal consumption can be compared in physical units such as tonnes or in energy units such as British thermal units. This ranking uses energy content. That matters because lignite, sub-bituminous coal, bituminous coal and anthracite do not provide the same amount of energy per tonne.
One quadrillion Btu is commonly called one quad. Using the same energy unit across countries makes it possible to compare the amount of primary energy supplied by coal without assuming that every tonne of coal has identical heat content.
The EIA measure covers total energy consumption from coal. It is therefore broader than coal-fired electricity generation alone. Coal is also used in industrial processes, including iron and steel production and other heat-intensive activities.
Coal Consumption and Coal Production Are Different Metrics
Production measures coal extracted from mines. Consumption measures coal used within an economy. Trade can create large differences between the two. Major producers may export a substantial share of their output, while countries with limited domestic production can support high consumption through imports.
Top 10 Coal-Consuming Countries in 2024
Coal use is highly concentrated at the top of the ranking. China's 105.298 quadrillion Btu is nearly five times India's consumption. India, in turn, consumed more than twice as much coal energy as the third-ranked United States.
Top 10 countries by total energy consumption from coal, 2024
| Rank | Entity | Value | Region / note |
|---|---|---|---|
| 1 | China | 105.298 quads | East Asia; official EIA 2024 value. |
| 2 | India | 21.804 quads | South Asia; official EIA 2024 value. |
| 3 | United States | 7.912 quads | North America; official EIA 2024 value. |
| 4 | Indonesia | 5.986 quads | Southeast Asia; official EIA 2024 value. |
| 5 | Russia | 5.693 quads | Eurasia; official EIA 2024 value. |
| 6 | Japan | 3.892 quads | East Asia; official EIA 2024 value. |
| 7 | South Africa | 3.773 quads | Africa; official EIA 2024 value. |
| 8 | South Korea | 2.770 quads | East Asia; official EIA 2024 value. |
| 9 | Vietnam | 2.236 quads | Southeast Asia; official EIA 2024 value. |
| 10 | Kazakhstan | 1.828 quads | Central Asia; official EIA 2024 value. |
All values are quadrillion Btu. The ranking is descending, so higher coal-energy consumption receives a higher position.
Coal Consumption Chart
The chart shows the same 2024 EIA values as the ranking table. China's bar is used as the reference scale because its coal consumption is substantially larger than that of every other country shown.
Methodology
The ranking uses the U.S. Energy Information Administration's International Energy Statistics measure for total energy consumption from coal in 2024. Countries are sorted from highest to lowest using the numeric EIA value in quadrillion British thermal units.
Metric
Total energy consumption from coal. The measure compares the energy supplied by coal rather than its physical weight.
Unit
Quadrillion British thermal units. One quadrillion Btu is commonly referred to as one quad.
Data Year
All ranking values are for 2024. The 2026 date describes the publication snapshot, not the measurement year.
Ranking Direction
Descending. Countries with greater coal-energy consumption rank higher.
Coverage
The ranking contains 12 countries using exact 2024 EIA values. It should be read as a ranking of the countries included here rather than a list of every economy reporting coal use.
Value Status
Every row is an official EIA value. No forecast, extrapolation or modeled 2026 value is included.
Regional Labels
Region labels are included only to help readers filter and interpret the table. They do not affect the underlying EIA values or rank.
Rounding
Values are displayed to three decimal places, matching the precision used for the country figures in this dataset. Rankings use the numeric values shown in the table.
How to Interpret the Unit
A Btu is a unit of energy. Ranking coal consumption in quadrillion Btu makes it possible to compare countries using coal with different heat content. A tonne of low-grade lignite does not provide the same amount of energy as a tonne of higher-grade bituminous coal or anthracite.
What the Metric Does Not Measure
Coal consumption is not the same as coal production, reserves, imports, exports, electricity generation or carbon dioxide emissions. It also does not show coal consumption per person or coal's share of a country's total energy mix. Each of those measures answers a different question and can produce a different country ranking.
Limitations
Coal consumption alone does not measure economic size, energy efficiency or environmental performance. National demand is influenced by population, industrial structure, electricity generation, steel production, coal quality, domestic resources, imports and access to alternative fuels.
Coal Consumption by Country Ranking
The table compares 12 countries using official EIA 2024 coal-energy consumption data. Search by country, filter by region or change the sort order to compare values.
EIA coal-energy consumption ranking, 2024
| Rank | Entity | Value | Region / note |
|---|---|---|---|
| 1 | China | 105.298 quads | East Asia; official EIA value; 2024. |
| 2 | India | 21.804 quads | South Asia; official EIA value; 2024. |
| 3 | United States | 7.912 quads | North America; official EIA value; 2024. |
| 4 | Indonesia | 5.986 quads | Southeast Asia; official EIA value; 2024. |
| 5 | Russia | 5.693 quads | Eurasia; official EIA value; 2024. |
| 6 | Japan | 3.892 quads | East Asia; official EIA value; 2024. |
| 7 | South Africa | 3.773 quads | Africa; official EIA value; 2024. |
| 8 | South Korea | 2.770 quads | East Asia; official EIA value; 2024. |
| 9 | Vietnam | 2.236 quads | Southeast Asia; official EIA value; 2024. |
| 10 | Kazakhstan | 1.828 quads | Central Asia; official EIA value; 2024. |
| 11 | Türkiye | 1.622 quads | Europe / West Asia; official EIA value; 2024. |
| 12 | Germany | 1.531 quads | Europe; official EIA value; 2024. |
Values refer to total coal-energy consumption in 2024 and are expressed in quadrillion Btu. A larger value indicates greater absolute coal use.
Key Patterns in Coal Consumption
Key Insight
China is in a category of its own. Its 105.298 quadrillion Btu is almost five times India's consumption and more than thirteen times the U.S. figure.
Notable Pattern
The first three countries consume 135.014 quadrillion Btu combined. This illustrates how strongly the top of the ranking is concentrated even before the rest of the table is considered.
Regional Concentration
Asian economies dominate the upper part of the ranking. China, India, Indonesia, Japan, South Korea, Vietnam and Kazakhstan all appear in the Top 10.
Outlier
The largest gap is between first and second place. China consumed 83.494 quadrillion Btu more coal energy than India in 2024.
What the Ranking Means
The table is best used to compare the absolute scale of national coal use. A high rank means a country consumes a large amount of energy from coal, but it does not show how dependent that economy is on coal relative to its population or total energy demand.
The ranking also highlights the difference between domestic consumption and extraction. Indonesia and Russia are large coal producers as well as large consumers, while countries such as Japan and South Korea rely much more heavily on imported coal.
The 2026 date describes when the ranking is being presented. The underlying observations are for 2024. The table does not forecast coal consumption in 2026.
Comparisons should also account for economic structure. Heavy industry, electricity generation, steel production, domestic coal resources and access to natural gas, nuclear power and renewable energy can all influence national coal demand.
Download the Coal Consumption by Country 2026: Official EIA 2024 Ranking dataset
Coal Consumption by Country 2026: Official EIA 2024 Ranking
12 ranked entries · Excel + CSV + methodology + sources + chart · Snapshot: EIA 2024 coal consumption · Version 1.0
No signup required. The archive includes machine-readable data, methodology and source documentation. Quick human verification is required before the ZIP is delivered.
Download Excel + CSV Data PackFAQ
Which country consumes the most coal?
China ranks first with 105.298 quadrillion Btu of coal-energy consumption in 2024, according to the U.S. Energy Information Administration.
Which countries rank second and third?
India ranks second at 21.804 quadrillion Btu, followed by the United States at 7.912 quadrillion Btu.
Are these coal consumption figures for 2026?
No. The ranking is a 2026 snapshot using official EIA data for 2024. It does not contain projected 2026 consumption.
Why is coal consumption measured in quadrillion Btu?
Btu measures energy content. Using an energy unit allows countries to be compared without assuming that every tonne of coal has the same heat content.
Does the ranking measure coal-fired electricity generation?
No. The metric covers total energy consumption from coal and is broader than electricity generation alone.
Is coal consumption the same as coal production?
No. Production measures coal extracted from mines. Consumption measures coal used within an economy. Imports and exports can create large differences between the two.
Why can coal rankings differ when measured in tonnes?
Coal grades have different heat content. A ranking based on tonnes measures physical mass, while this EIA ranking measures the amount of energy contained in the coal consumed.
Does a high coal-consumption rank mean a country has high coal dependence?
Not necessarily. This is an absolute-consumption ranking. Coal dependence is better assessed using indicators such as coal's share of total energy consumption, electricity generation or consumption per person.
Sources
U.S. Energy Information Administration — International Rankings
Official international ranking source for total energy consumption from coal.
https://www.eia.gov/international/rankings/world?f=A&pa=290&u=2&v=none&y=01%2F01%2F2024
U.S. EIA — International Energy Statistics Open Data
Official EIA data environment for international energy statistics and country-level energy series.
EIA Country Energy Data
Country records used for the 2024 coal-consumption values presented in the ranking.
Download data archive
ZIP archive with CSV and HTML copies of the tables published on this page, plus external source links, a manifest and README. The archive does not add new estimates or recalculate ranking values.
Related rankings
More StatRanker pages connected by topic, category or ranking theme.
