

Passenger Cars per 1,000 People by Country: 2026 UNECE Ranking
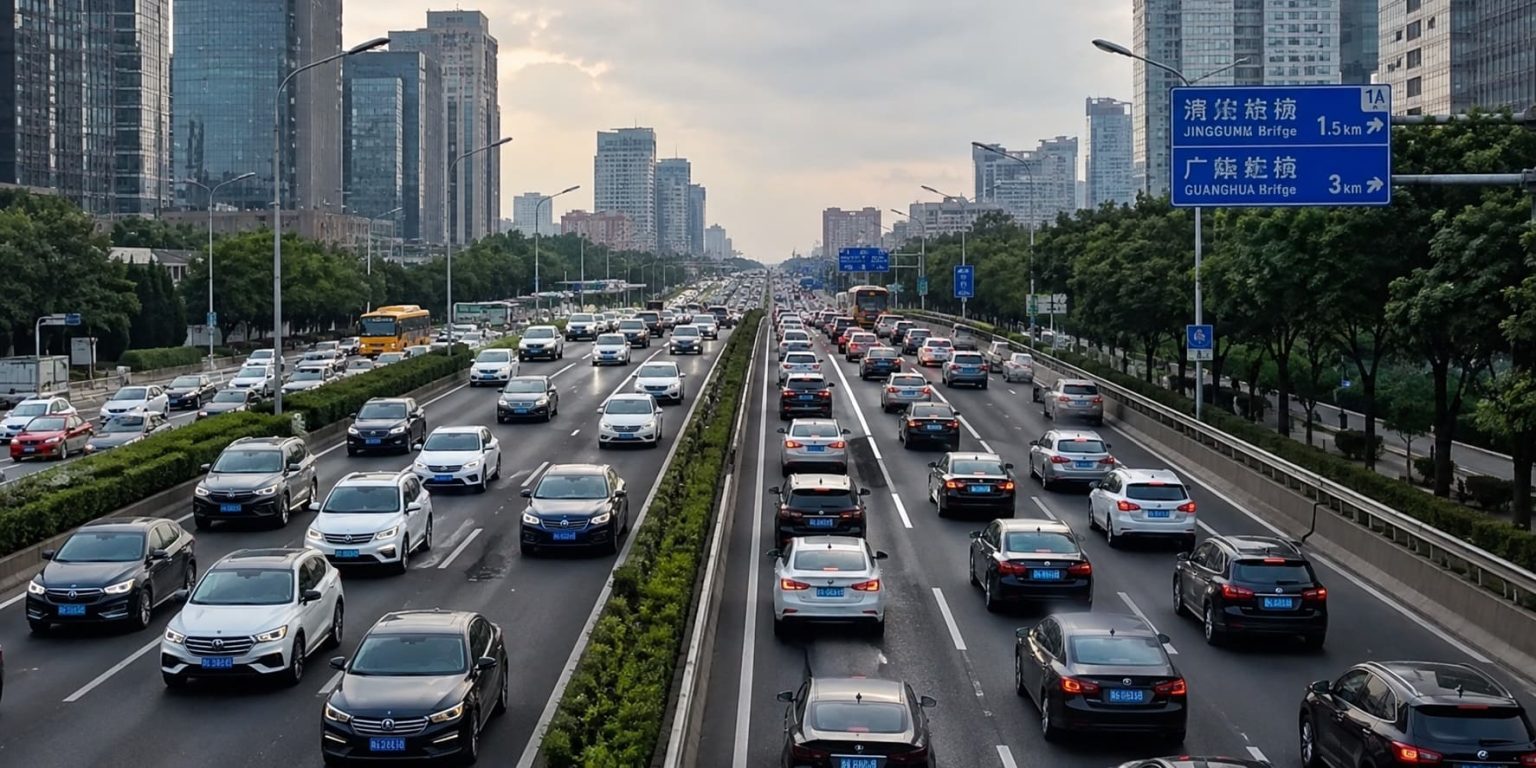
How passenger-car ownership compares across UNECE countries
This ranking compares registered passenger cars per 1,000 inhabitants across countries with a reported 2024 value in the UNECE Passenger car rate table. Adjusting the registered fleet for population size makes the measure more useful for cross-country comparison than a simple count of vehicles.
The figures are official UNECE observations for 2024. The ranking covers 42 countries and does not mix them with older national observations. Countries without a 2024 value are left out rather than being ranked on a different reporting year.
This is a UNECE-region comparison, not a global ranking. Higher values indicate more registered passenger cars relative to population. No forecasts or modeled 2026 estimates are included.
Registered passenger cars per 1,000 inhabitants in 2024.
Lowest 2024 rate among the countries included in the ranking.
Every country in the ranking has a reported UNECE value for 2024.
Registered passenger cars relative to population.
All countries are compared using the same reporting year.
All figures are official observations; no forecasts or modeled estimates are used.
What passenger cars per 1,000 people measures
Passenger cars per 1,000 inhabitants measures the size of the registered passenger-car fleet relative to population. Because the denominator adjusts for country size, the indicator is better suited to comparing motorization levels than an absolute vehicle count.
UNECE defines a passenger car as a road motor vehicle other than a moped or motorcycle that is intended to carry passengers and designed to seat no more than nine people, including the driver. The definition corresponds to vehicle category M1.
The indicator is based on registered vehicles at the end of the year. It does not measure how many residents personally own a car. Vehicles can be registered to companies or households, and one owner may have more than one vehicle.
It also does not measure how intensively cars are used. Annual mileage, congestion, fuel consumption, road quality and public-transport use require different indicators.
Top 10 countries by passenger cars per 1,000 inhabitants
Monaco records the highest rate in the 2024 UNECE data at 909 passenger cars per 1,000 inhabitants. Liechtenstein follows at 760, while Italy ranks third at 701. Czechia completes the Top 10 with a rate of 609.
Top 10 passenger-car rates, UNECE 2024
| Rank | Entity | Cars / 1,000 | Source / note |
|---|---|---|---|
| 1 | Monaco | 909 | UNECE · official 2024 data. |
| 2 | Liechtenstein | 760 | UNECE · official 2024 data. |
| 3 | Italy | 701 | UNECE · official 2024 data. |
| 4 | Luxembourg | 674 | UNECE · official 2024 data. |
| 5 | Finland | 668 | UNECE · official 2024 data. |
| 6 | Cyprus | 664 | UNECE · official 2024 data. |
| 7 | Iceland | 644 | UNECE · official 2024 data. |
| 8 | Estonia | 633 | UNECE · official 2024 data. |
| 9 | Poland | 612 | UNECE · official 2024 data. |
| 10 | Czechia | 609 | UNECE · official 2024 data. |
Countries are ranked from highest to lowest. Croatia and the Netherlands both report 514 cars per 1,000 inhabitants; they are ordered alphabetically where the published values are equal.
Top 20 passenger-car rates in 2024
Monaco is clearly separated from the rest of the ranking. Below the leading group, the distribution becomes much tighter: countries in positions 10 through 20 range from 609 cars per 1,000 inhabitants in Czechia to 544 in Switzerland.
Methodology
The ranking uses the UNECE Passenger car rate for 2024. Countries are ordered from the highest reported number of registered passenger cars per 1,000 inhabitants to the lowest.
How the rate is calculated
UNECE calculates the indicator from passenger cars registered as of 31 December, divided by population and multiplied by 1,000.
What counts as a passenger car
The definition covers road motor vehicles intended to carry passengers and designed to seat no more than nine people including the driver. It corresponds to category M1.
Source
The country figures come from the UNECE Transport Statistics Database, which compiles transport statistics from official national and international sources.
Coverage
Only countries with a numeric passenger-car rate for 2024 are included. This results in 42 countries in the ranking.
Missing countries
Where the 2024 value is unavailable, an older observation is not substituted. This keeps all ranked countries on the same reporting year.
2026 interpretation
The ranking presents the official 2024 observations available for comparison in 2026. It does not estimate passenger-car rates for 2026.
Equal values
Countries with the same reported rate are equal on the underlying metric. Alphabetical order is used only to arrange them in the table.
Precision
UNECE reports this indicator as whole-number cars per 1,000 inhabitants, so the ranking retains the same level of precision.
The 2024 table does not provide a numeric passenger-car rate for Andorra, Armenia, Azerbaijan, Canada, Israel, Kazakhstan, Kyrgyzstan, the Russian Federation, Tajikistan, Turkmenistan, Ukraine, the United States or Uzbekistan. They are therefore not ranked with older observations.
Country notes also matter for interpretation. UNECE states that United Kingdom figures refer to Great Britain. For Serbia, the series from 2000 onward does not cover Kosovo and Metohija. For Latvia, UNECE records a change in vehicle-registration rules from 2010 that affects comparison with earlier years.
The indicator does not measure annual car sales, new registrations, vehicle-kilometres travelled, motorcycles, buses, freight vehicles, cars per household, congestion, emissions, road quality or public-transport use. Registration practices and population size can also have a larger effect on the rate in very small states.
Full ranking: passenger cars per 1,000 people in 42 countries
Use the controls to find a country, change the order of the table, or switch between the Top 10, Top 20 and the full 42-country ranking.
Showing 42 of 42 countries.
Passenger cars per 1,000 inhabitants, UNECE 2024
| Rank | Entity | Cars / 1,000 | Source / note |
|---|---|---|---|
| 1 | Monaco | 909 | UNECE · official 2024 data. |
| 2 | Liechtenstein | 760 | UNECE · official 2024 data. |
| 3 | Italy | 701 | UNECE · official 2024 data. |
| 4 | Luxembourg | 674 | UNECE · official 2024 data. |
| 5 | Finland | 668 | UNECE · official 2024 data. |
| 6 | Cyprus | 664 | UNECE · official 2024 data. |
| 7 | Iceland | 644 | UNECE · official 2024 data. |
| 8 | Estonia | 633 | UNECE · official 2024 data. |
| 9 | Poland | 612 | UNECE · official 2024 data. |
| 10 | Czechia | 609 | UNECE · official 2024 data. |
| 11 | Lithuania | 599 | UNECE · official 2024 data. |
| 12 | Germany | 591 | UNECE · official 2024 data. |
| 13 | Slovenia | 588 | UNECE · official 2024 data. |
| 14 | Malta | 581 | UNECE · official 2024 data. |
| 15 | France | 580 | UNECE · official 2024 data. |
| 16 | Portugal | 574 | UNECE · official 2024 data. |
| 17 | Greece | 572 | UNECE · official 2024 data. |
| 18 | Austria | 570 | UNECE · official 2024 data. |
| 19 | Spain | 547 | UNECE · official 2024 data. |
| 20 | Switzerland | 544 | UNECE · official 2024 data. |
| 21 | Norway | 519 | UNECE · official 2024 data. |
| 22 | Belgium | 515 | UNECE · official 2024 data. |
| 23 | Croatia | 514 | UNECE · official 2024 data. |
| 24 | Netherlands | 514 | UNECE · official 2024 data. |
| 25 | Slovakia | 499 | UNECE · official 2024 data. |
| 26 | Bulgaria | 484 | UNECE · official 2024 data. |
| 27 | Denmark | 479 | UNECE · official 2024 data. |
| 28 | United Kingdom | 475 | UNECE · official 2024 data; figures refer to Great Britain. |
| 29 | Ireland | 471 | UNECE · official 2024 data. |
| 30 | Sweden | 468 | UNECE · official 2024 data. |
| 31 | Hungary | 446 | UNECE · official 2024 data. |
| 32 | Romania | 443 | UNECE · official 2024 data. |
| 33 | Latvia | 423 | UNECE · official 2024 data; the source notes a registration-method change from 2010. |
| 34 | Montenegro | 417 | UNECE · official 2024 data. |
| 35 | Georgia | 415 | UNECE · official 2024 data. |
| 36 | Serbia | 376 | UNECE · official 2024 data; the source states that the series does not cover Kosovo and Metohija. |
| 37 | Belarus | 345 | UNECE · official 2024 data. |
| 38 | Albania | 326 | UNECE · official 2024 data. |
| 39 | North Macedonia | 318 | UNECE · official 2024 data. |
| 40 | Bosnia and Herzegovina | 316 | UNECE · official 2024 data. |
| 41 | Republic of Moldova | 278 | UNECE · official 2024 data. |
| 42 | Türkiye | 183 | UNECE · official 2024 data. |
Source: UNECE Transport Statistics Database. Every country in the ranking uses a 2024 observation.
What stands out in the 2024 ranking
Monaco is well ahead
Monaco's rate of 909 cars per 1,000 inhabitants is 149 higher than Liechtenstein's 760, the largest gap between neighboring positions at the top of the table.
Top 10 above 600
Every country in the Top 10 records more than 600 passenger cars per 1,000 inhabitants. Czechia is tenth at 609.
Comparable year
All 42 countries are compared using 2024 observations, avoiding the distortions that can arise when recent and older national figures are placed in the same ranking.
Lowest reported rates
Türkiye records 183 cars per 1,000 inhabitants. The Republic of Moldova is next at 278, a difference of 95 cars per 1,000 people.
How to interpret the ranking
A rate of 600 means that the registered passenger-car fleet is equivalent to 600 cars for every 1,000 inhabitants. It does not mean that exactly 60% of residents personally own a car.
The measure is useful for comparing the scale of passenger-car registration across countries, but it should not be treated as a direct measure of wealth, transport quality or driving intensity.
A country can have a high registration rate without necessarily recording more annual driving, greater congestion or weaker public transport. Registration rules and population size can also have a visible effect on the rate, especially in very small states.
All figures in this ranking refer to 2024. The 2026 wording identifies when the comparison is being presented, not the year in which the vehicles were counted.
Download the Passenger Cars per 1,000 People by Country: 2026 UNECE Ranking dataset
Passenger Cars per 1,000 People by Country: 2026 UNECE Ranking
42 ranked entries · Excel + CSV + methodology + sources + chart · Snapshot: 2024 UNECE / 2026 snapshot · Version 1.0
No signup required. The archive includes machine-readable data, methodology and source documentation. Quick human verification is required before the ZIP is delivered.
Download Excel + CSV Data PackFAQ
Which country has the highest passenger-car rate in the UNECE 2024 data?
Monaco ranks first among the countries included here, with 909 registered passenger cars per 1,000 inhabitants.
Is this a global ranking?
No. The comparison is based on the UNECE Passenger car rate table and includes countries in that data source with a reported value for 2024.
Are these 2026 passenger-car figures?
No. The observations are from 2024. No passenger-car rates have been projected to 2026.
Why are the United States and Canada not ranked?
Neither country has a numeric 2024 observation in the UNECE Passenger car rate table. Earlier values are not substituted because the ranking uses one common reporting year.
What counts as a passenger car?
UNECE defines a passenger car as a road motor vehicle other than a moped or motorcycle that is intended to carry passengers and designed to seat no more than nine people including the driver.
Why is the former World Bank passenger-car indicator not used?
The World Bank page for indicator IS.VEH.PCAR.P3 no longer provides a current comparable country series suitable for this ranking. The country figures used here therefore come from UNECE.
Does the ranking include forecasts?
No. The ranking uses reported UNECE values for 2024 only.
Does a higher passenger-car rate mean people drive more?
Not necessarily. The indicator measures registered passenger cars relative to population, not annual distance travelled, trip frequency or fuel use.
Sources
UNECE Data Portal — Passenger car rate
Primary source for the 2024 country values and the passenger-car-rate definition used in this ranking.
UNECE Data Portal — Passenger car rate ranking
Official country-ranking view for the UNECE passenger-car-rate indicator.
https://w3.unece.org/PXWeb/en/CountryRanking?IndicatorCode=44
UNECE Statistical Database — Passenger road vehicle fleet and rate
Detailed source for country-specific notes affecting the underlying vehicle-registration series.
UNECE — Glossary for Transport Statistics, 6th edition
Current UNECE reference for harmonized transport-statistics terminology and definitions.
https://unece.org/transport/publications/glossary-transport-statistics-6th-edition-2026
World Bank Open Data — IS.VEH.PCAR.P3
Reference page for the former World Bank passenger-cars-per-1,000 indicator. It is not used for the country values in this ranking.
Download data archive
ZIP archive with CSV and HTML copies of the tables published on this page, plus external source links, a manifest and README. The archive does not add new estimates or recalculate ranking values.
Related rankings
More StatRanker pages connected by topic, category or ranking theme.
