
Top 50 Countries by Residential Natural Gas Price
Residential energy bills What households paid for natural gas in 2025 — and why the “same fuel” costs so differently

Residential energy bills What households paid for natural gas in 2025 — and why the “same fuel” costs so differently
Household electricity cost benchmark This ranking compares residential electricity prices in USD per kWh. It reflects retail tariffs — not

Economy · Macroeconomics · Growth Real GDP growth (annual %) measures how fast an economy expands in inflation-adjusted terms. This

StatRanker Labour Markets Ages 15–24 Youth unemployment is one of the fastest-moving stress indicators in any economy. When companies slow

StatRanker • Country rankings This page ranks countries by unemployment rate (share of the labour force without work, available for

2025 snapshot • inflation-adjusted rates Real interest rates by country: what this ranking is (and what it is not) “Real

Dec 2025 snapshot A central bank policy rate (also called a benchmark, key, or monetary policy rate) is the interest

StatRanker • Automotive imports • Value This ranking compares countries by the value of automotive imports. A high import level

StatRanker • Automotive exports What this ranking measures This page ranks countries by the export value of automotive products. In

Overview: Top 100 Most Reliable Car Models, 2025 Reliability is most actionable when it is comparable at the model level.

Overview This ranking compares countries by the estimated share of road traffic fatalities where alcohol impairment (above the national legal

Mobility intensity Overview Vehicle-kilometers traveled per capita (VKT per person) summarizes how many kilometers road vehicles travel in a country,

Overview Gasoline prices by country in 2025 (USD per liter) Gasoline pump prices vary widely across countries even within the
Overview This ranking compares countries by the share of DC fast chargers within the public charging mix. The metric looks

Mobility · Road safety · Risk per distance Road deaths per 1 billion vehicle-kilometres — 2025 edition (maximum available country

Overview This page compares reported motor vehicle theft intensity across countries using a population-normalised rate: cases per 100,000 people. The

What this metric captures New passenger car registrations per 1,000 people approximates how quickly a country’s passenger-car market is being

Why “more renewables” can fail to translate into “more usable clean electricity” A common reader assumption is simple: if wind

Installed capacity is a “potential” measure — output is the “realized” measure A common reading mistake in energy statistics is

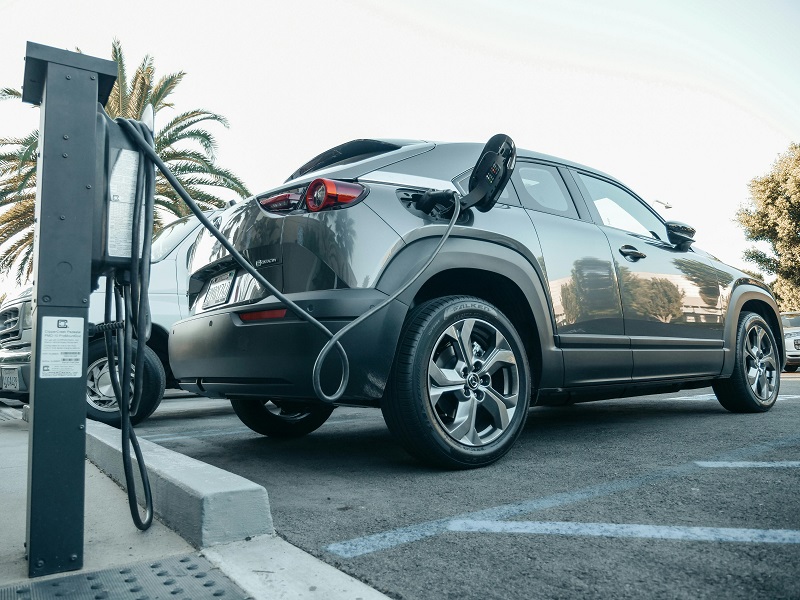
Charging infrastructure as the binding constraint Many readers assume EV adoption is primarily a demand story: if consumers want EVs

Why “EV sales are booming” can coexist with a slow-moving EV share of the car fleet A common misunderstanding in

A common reader assumption is straightforward: if wages rise, people must be better off. In country data, this intuition often

Economy · Macroeconomics · Measurement by admin · December 22, 2025 · ~20 min read Why “GDP” comparisons break in

Why nominal GDP and PPP are often confused Many readers treat “GDP” as a single, universal yardstick of economic size.

Category: Data Methodology · Totals vs per-capita, scaling effects, denominator mechanics Problem framing: why totals and per-capita views often “disagree”

A common reader expectation is simple: “If GDP, inflation, or public debt are measured for the same country and year,

Data Methodology • Stock vs Flow Why “visible change” often fails to move country comparisons Many readers expect country comparisons
