

Meat Consumption per Capita by Country 2026: FAOSTAT Food Balance Snapshot
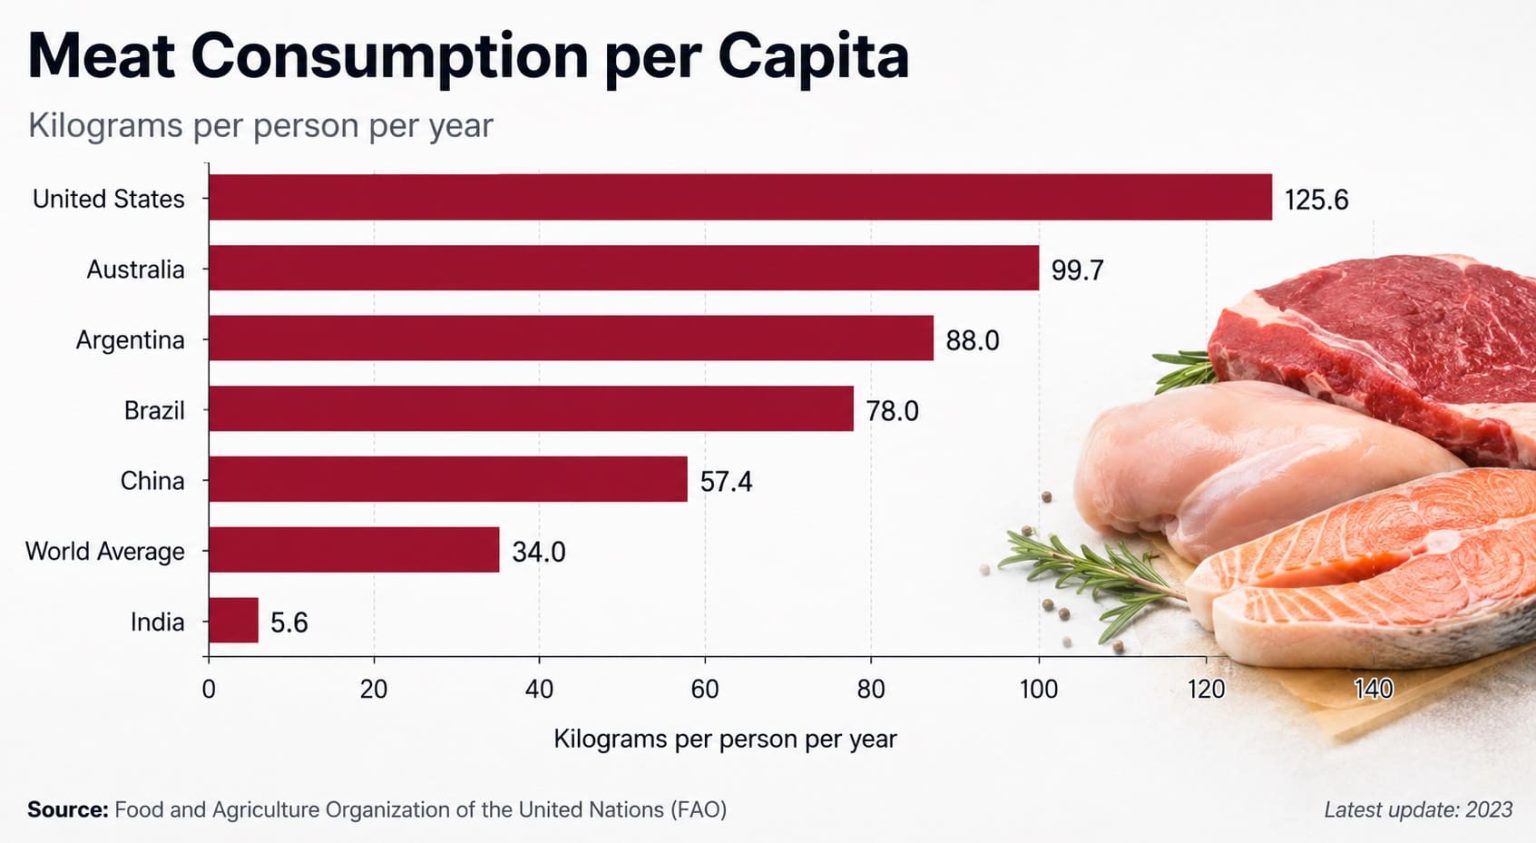
Meat supply per capita: 2026 snapshot based on FAOSTAT 2023 Food Balances
This ranking compares the FAOSTAT Food Balance Sheet indicator Food supply quantity (kg/capita/yr) for the aggregate item Meat. The current Food Balances dataset extends through 2023, so the figures represent the latest comparable annual observations available for this 2026 snapshot rather than projected consumption in 2026.
Food supply quantity measures the amount of meat available for human consumption within a country's food balance. It is not a direct measure of how much meat an individual actually eats. Retail, food-service and household waste can make actual intake lower than the supply figure.
The ranking covers the ten highest-ranked UN Member States in the 2023 series used for this comparison. Regional aggregates and areas outside this country rule are excluded consistently. Higher annual meat supply per person ranks higher.
The table is a compiled research dataset based on 7 sources, with row-level source and method notes shown in the ranking table. FAOSTAT Food Balances provides the statistical basis, while secondary verification sources and United Nations references are used for value checks, country coverage and regional classification. All 10 entries are historical 2023 values; none are official forecasts or modeled 2026 projections.
Tonga ranks first among the included countries in 2023.
Nauru completes the Top 10 after areas outside the country rule are excluded.
UN Member States ranked using the same 2023 Meat food-supply indicator.
Official values / official forecasts / modeled projections. Unit: kg per person per year.
What the meat-supply indicator measures
A Food Balance Sheet describes how a country's food supply is formed and used during a reference period. Domestic production and imports add to available supply, while exports, stock changes and other uses affect the quantity ultimately available as food for the population.
FAOSTAT expresses meat food supply in kilograms per capita per year. Although international comparisons are often described as meat consumption rankings, meat supply per capita is the more precise term for this dataset.
The distinction matters when comparing countries. Similar supply figures do not imply identical diets. Household waste, distribution, affordability and differences in consumption within the population can all separate national food availability from the quantity actually eaten.
Top 10 countries by meat supply per capita
Tonga ranks first at 156.95 kg per person per year, followed by Mongolia at 136.14 kg and the Marshall Islands at 125.68 kg. The United States is fourth at 122.06 kg. Four countries in the Top 10 exceed 120 kg per person per year.
Top 10 UN Member States · Meat · Food supply quantity · 2023
| Rank | Entity | Value | Source / method note |
|---|---|---|---|
| 1 | Tonga | 156.95 kg | Oceania · FAOSTAT Food Balances · official value · 2023. |
| 2 | Mongolia | 136.14 kg | Asia · FAOSTAT Food Balances · official value · 2023. |
| 3 | Marshall Islands | 125.68 kg | Oceania · FAOSTAT Food Balances · official value · 2023. |
| 4 | United States | 122.06 kg | Americas · FAOSTAT Food Balances · official value · 2023. |
| 5 | Saint Vincent and the Grenadines | 118.47 kg | Americas · FAOSTAT Food Balances · official value · 2023. |
| 6 | Australia | 116.78 kg | Oceania · FAOSTAT Food Balances · official value · 2023. |
| 7 | Argentina | 114.95 kg | Americas · FAOSTAT Food Balances · official value · 2023. |
| 8 | Bahamas | 114.91 kg | Americas · FAOSTAT Food Balances · official value · 2023. |
| 9 | Belarus | 111.72 kg | Europe · FAOSTAT Food Balances · official value · 2023. |
| 10 | Nauru | 109.2 kg | Oceania · FAOSTAT Food Balances · official value · 2023 · secondary value check. |
Values are kilograms per person per year. This compiled research dataset uses FAOSTAT Food Balances as the statistical basis, with row-level source and method notes shown in the table. Nauru is retained at 109.2 kg because the secondary FAOSTAT-based verification supports that precision; no additional decimal places are inferred.
Chart: Top 10 confirmed entries
Tonga stands clearly above the rest of the ranking. Mongolia is second, while the remaining eight countries range from 109.2 to 125.68 kg per person per year.
Methodology
This compiled research dataset uses the FAOSTAT Food Balances aggregate item Meat and the element Food supply quantity (kg/capita/yr). The observation year is 2023. Countries are ordered from highest to lowest using the numerical values shown in the ranking.
Metric and unit
The indicator measures annual meat available for human consumption within the national food balance. Values are expressed in kilograms per capita per year.
2026 snapshot
The current FAOSTAT Food Balances dataset covers observations through 2023. No growth rate or projection formula is used to create 2024, 2025 or 2026 values.
Country coverage
The ranking is restricted to UN Member States. Regional aggregates and separately reported areas outside that rule are removed before the Top 10 is determined.
Regional classification
Broad region labels follow the United Nations M49 macro-regional framework: Africa, Americas, Asia, Europe and Oceania.
Source hierarchy
FAOSTAT Food Balances is the statistical source. FAO catalogue and release pages establish the dataset definition and coverage, while secondary FAOSTAT-attributed sources provide additional checks on the published country values.
Precision and conflicts
Conflicting values are not averaged. Ranking uses the numeric value associated with each row, while displayed precision follows the supported source value. Nauru is therefore shown as 109.2 kg rather than with unsupported additional decimals.
Formula: food supply quantity per capita equals the quantity of meat available for human consumption divided by the corresponding population, expressed in kilograms per capita per year. Countries without a 2023 value are excluded rather than filled with an earlier observation. No projection assumptions or growth rates are used. Display precision follows the supported source value.
Seven sources are used across the compiled research dataset: FAOSTAT Food Balances, the FAO Data Catalogue, the FAO Food Balance Sheets release page, MarketStats, Compare the World, the UN Member States reference and the UN M49 classification. FAOSTAT remains the statistical basis of the ranking; the other sources support release timing, verification, inclusion rules and geographic classification.
FAOSTAT may flag some historical observations as estimated or imputed as part of its statistical production process. Such source flags describe historical data quality and should not be confused with forecasts of future values.
The indicator should not be interpreted as measured dietary intake. Food available through the national supply chain may later be wasted or distributed unevenly, so the quantity actually eaten can differ from the national per-capita supply figure.
The ranking does not measure affordability, nutritional quality, household purchases, meat expenditure or differences in consumption within a country's population. The aggregate Meat item also excludes fish and seafood.
2023 meat supply per capita ranking
The ten included countries are ranked from highest to lowest meat supply per capita using the same FAOSTAT Food Balance Sheet metric, unit and observation year.
Top 10 UN Member States · kg per person per year · 2023
| Rank | Entity | Value | Source / method note |
|---|---|---|---|
| 1 | Tonga | 156.95 kg | Oceania · FAOSTAT Food Balances · official value · 2023. |
| 2 | Mongolia | 136.14 kg | Asia · FAOSTAT Food Balances · official value · 2023. |
| 3 | Marshall Islands | 125.68 kg | Oceania · FAOSTAT Food Balances · official value · 2023. |
| 4 | United States | 122.06 kg | Americas · FAOSTAT Food Balances · official value · 2023. |
| 5 | Saint Vincent and the Grenadines | 118.47 kg | Americas · FAOSTAT Food Balances · official value · 2023. |
| 6 | Australia | 116.78 kg | Oceania · FAOSTAT Food Balances · official value · 2023. |
| 7 | Argentina | 114.95 kg | Americas · FAOSTAT Food Balances · official value · 2023. |
| 8 | Bahamas | 114.91 kg | Americas · FAOSTAT Food Balances · official value · 2023. |
| 9 | Belarus | 111.72 kg | Europe · FAOSTAT Food Balances · official value · 2023. |
| 10 | Nauru | 109.2 kg | Oceania · FAOSTAT Food Balances · official value · 2023 · secondary value check. |
This is a compiled research dataset based on 7 sources. FAOSTAT Food Balances is the underlying statistical source for all ranked entries, while secondary sources support value checks, country eligibility and regional classification. The ranking uses 2023 observations only and does not mix older years or projected values.
What stands out in the ranking
Key Insight
Tonga leads at 156.95 kg per person per year, 20.81 kg above second-ranked Mongolia.
Notable Pattern
Tonga, Mongolia, the Marshall Islands and the United States each exceed 120 kg of meat supply per person per year.
Regional Concentration
Under the UN M49 classification, four Top 10 countries are in Oceania and four are in the Americas. Mongolia represents Asia and Belarus represents Europe.
Range
The difference between first-ranked Tonga and tenth-ranked Nauru is 47.75 kg per person per year.
How to interpret the ranking
A high rank indicates that a relatively large quantity of meat is available through the national food system for each resident. It does not mean that every person eats the amount shown in the table.
Domestic production, imports, exports, stock changes and other uses all contribute to the Food Balance Sheet calculation. Waste after food reaches retailers, restaurants and households can further widen the difference between supply and actual intake.
The ranking should therefore be used to compare national meat availability rather than individual dietary behavior. It does not indicate whether a diet is healthier, more affordable or more evenly distributed within a population.
The 2026 reference describes the publication snapshot. All ranked values are 2023 observations and should not be interpreted as forecasts for 2026.
Download the Meat Consumption per Capita by Country 2026: FAOSTAT Food Balance Snapshot dataset
Meat Consumption per Capita by Country 2026: FAOSTAT Food Balance Snapshot
10 ranked entries · Excel + CSV + methodology + sources + chart · Snapshot: FAOSTAT 2023 Food Balances meat supply per capita · Version 1.0
No signup required. The archive includes machine-readable data, methodology and source documentation. Quick human verification is required before the ZIP is delivered.
Download Excel + CSV Data PackFAQ
Which country has the highest meat supply per capita?
Tonga ranks first among the included UN Member States, with 156.95 kg of meat food supply per person in 2023.
Is meat supply the same as actual meat consumption?
No. FAOSTAT Food Balance Sheets measure food available for human consumption at national level. Actual intake can be lower because food may be wasted after it reaches retailers, food-service businesses and households.
Are these 2026 figures?
No. This is a 2026 snapshot using 2023 observations. No growth assumption or forecasting model has been used to produce 2026 values.
Why are areas such as Macao not included?
The ranking uses UN Member States as its country rule. Regional aggregates and separately reported areas outside that rule are excluded before the ranking is calculated.
What types of meat are included?
The ranking uses FAOSTAT's aggregate Meat item rather than a single species, so it represents the combined meat supply covered by that Food Balance Sheet category.
Are fish and seafood included?
No. Fish and seafood are reported separately and are not added to the Meat values shown here.
How are regions assigned?
The broad regional labels follow the United Nations Statistics Division M49 classification rather than a custom regional grouping.
Why does the page use “meat supply” instead of “meat consumption”?
Food Balance Sheets measure availability within the national food system. “Meat supply per capita” therefore describes the metric more precisely than measured individual consumption.
Sources
This compiled research dataset uses 7 public sources. FAOSTAT Food Balances is the primary statistical source; the remaining sources support dataset coverage, release timing, value checks, country inclusion and regional classification.
FAOSTAT — Food Balances
Primary statistical source for the Meat item, Food supply quantity indicator, units and annual Food Balance Sheet observations.
FAO Data Catalogue — Food balances
Official dataset catalogue record confirming the Food Balance Sheet definition, annual coverage through 2023 and the kg/capita/year unit.
https://data.fao.org/catalog/dataset/2f264bb6-1238-459a-bf8b-0e2d0a16804a
FAO — Food balance sheets 2010–2023
Official FAO release information for the Food Balance Sheets update covering observations through 2023.
https://www.fao.org/statistics/highlights-archive/highlights-detail/food-balance-sheets-2010-2023/
MarketStats — 2023 meat supply table
FAOSTAT-attributed public table used to cross-check the published 2023 values from Tonga through Belarus.
https://marketstats.ai/graphics/highest-meat-supply-per-person-by-economy-2023/
Compare the World — Meat supply per person
Secondary FAOSTAT-based ranking used to check Nauru at 109.2 kg per person per year and its position below Belarus after the country rule is applied.
United Nations — Member States
Reference source for the country inclusion rule used to distinguish UN Member States from separately reported territories and areas.
United Nations Statistics Division — M49
Official geographic classification used for the broad regional labels shown in the ranking.
Related rankings
More StatRanker pages connected by topic, category or ranking theme.
