

Chicken Meat Production by Country 2026: FAOSTAT 2024 Ranking
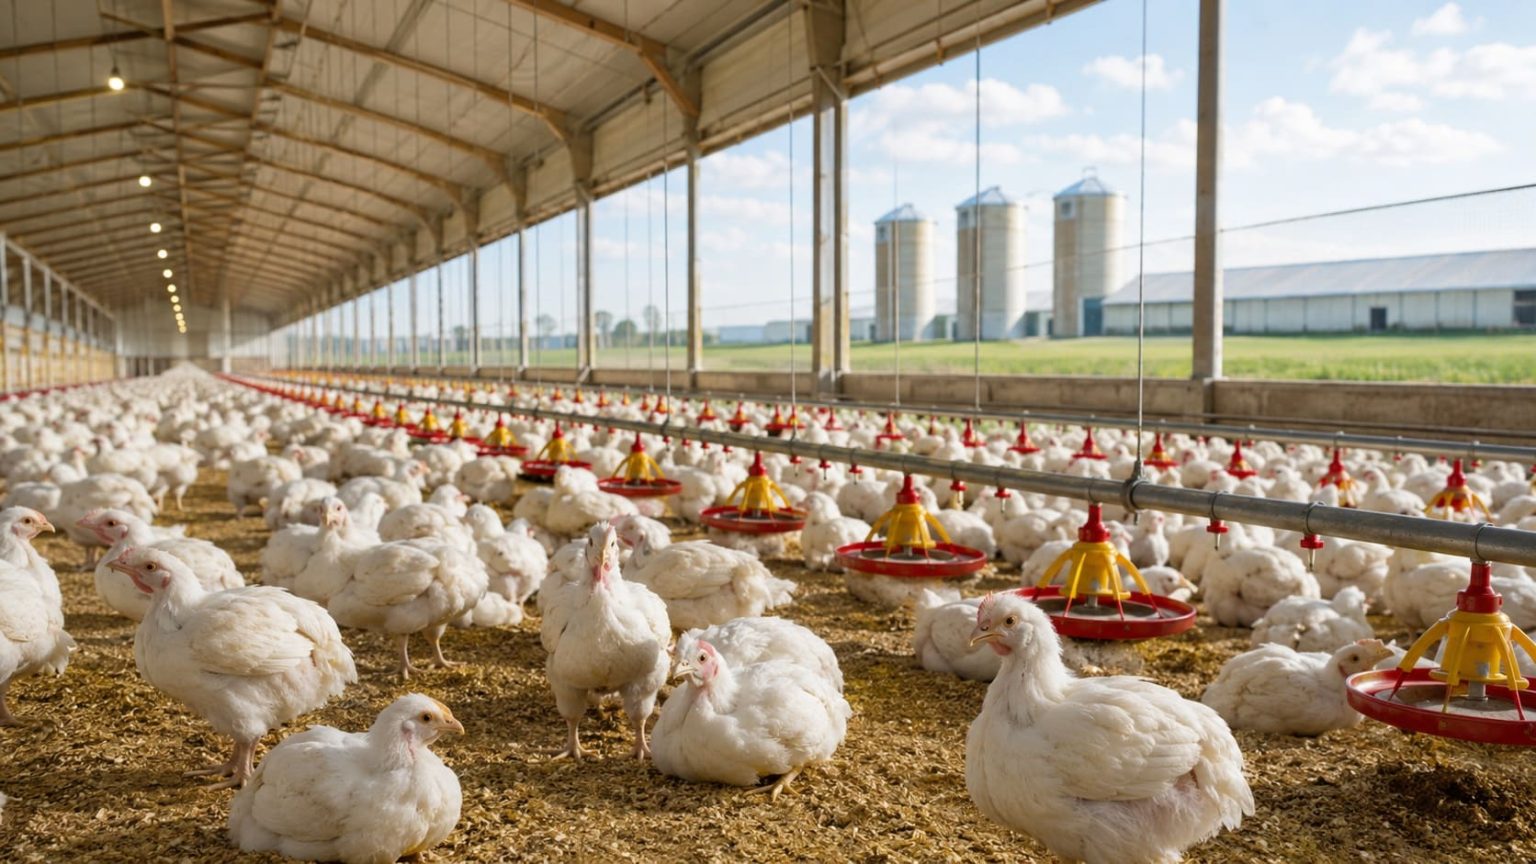
Largest Chicken Meat Producers in 2024
This 2026 snapshot ranks countries by chicken meat production using official FAOSTAT data for 2024. The indicator is production of “Meat of chickens, fresh or chilled”, measured in tonnes and ordered from highest to lowest output.
The United States ranks first, followed by China and Brazil. The ranking covers 50 countries, all measured using the same FAOSTAT 2024 series in tonnes.
All 50 ranked entries are published 2024 FAOSTAT values; none are forecasts or modeled projections.
This ranking keeps chicken meat production separate from live chicken stocks, slaughter counts, egg production, poultry exports and meat from ducks, turkeys and other poultry species.
The United States ranks first with 20,176,636 tonnes in 2024.
China ranks second, followed by Brazil in third place.
Jordan is the lowest-production country included in this Top 50.
50 published FAOSTAT values; no forecasts or modeled estimates.
What this production ranking measures
FAOSTAT records chicken meat within its crops and livestock products dataset. The selected product is “Meat of chickens, fresh or chilled”, the statistical element is Production, and the unit is tonnes.
The result is a ranking by annual meat output rather than by the number of birds. Rankings based on live chicken populations, slaughter counts, egg production or poultry trade can therefore look very different.
The scope is also narrower than total poultry meat. Chicken, duck, turkey and other poultry meats are separate FAOSTAT products, so no other bird species are added to the values shown here.
Top 10 Chicken Meat Producers
The top of the ranking is highly concentrated. The United States produced more than 20 million tonnes in 2024, China produced 15.35 million tonnes, and Brazil produced more than 13.7 million tonnes. Output then falls to about 5.46 million tonnes for the Russian Federation in fourth place.
Top 10 by chicken meat production, 2024
| Rank | Entity | Value | Region / note |
|---|---|---|---|
| 1 | United States | 20,176,636 t | Americas · FAOSTAT · official value · 2024. |
| 2 | China | 15,350,000 t | Asia · FAOSTAT · official value · 2024 · China, mainland series. |
| 3 | Brazil | 13,714,702 t | Americas · FAOSTAT · official value · 2024. |
| 4 | Russian Federation | 5,457,330 t | Europe · FAOSTAT · official value · 2024. |
| 5 | India | 5,019,410 t | Asia · FAOSTAT · official value · 2024. |
| 6 | Indonesia | 4,179,444.2 t | Asia · FAOSTAT · official value · 2024. |
| 7 | Mexico | 4,013,215.8 t | Americas · FAOSTAT · official value · 2024. |
| 8 | Egypt | 2,598,603.5 t | Africa · FAOSTAT · official value · 2024. |
| 9 | Türkiye | 2,512,130.8 t | Asia · FAOSTAT · official value · 2024. |
| 10 | Japan | 2,466,966.5 t | Asia · FAOSTAT · official value · 2024. |
Top 20 Chicken Meat Producers
The three largest producers stand well above the rest of the ranking. Brazil in third place produced about 8.26 million tonnes more than the Russian Federation in fourth.
Methodology
The ranking uses the FAOSTAT Crops and livestock products dataset. The selected product is “Meat of chickens, fresh or chilled”, the element is Production, the reference year is 2024, and the unit is tonnes.
Metric
Countries are ranked by annual chicken meat production. Larger production volumes receive higher positions.
Reference year
This 2026 snapshot uses FAOSTAT production data for 2024 and does not estimate 2026 output.
Product boundaries
Chicken meat is included. Live chicken stocks, slaughter head counts, eggs, poultry trade, duck meat, turkey meat and other poultry products are excluded.
China
The row labelled China uses the FAOSTAT China, mainland series. Hong Kong SAR, Macao SAR and Taiwan Province are not added to this country ranking.
FAOSTAT defines meat production with reference to animals slaughtered within national boundaries, regardless of their origin. Meat production is reported in dressed carcass weight, while poultry meat is expressed, where possible, in ready-to-cook equivalent. The production series is therefore different from a simple count of slaughtered birds.
The ranking includes the 50 highest country values available for 2024. Entries without a 2024 value are excluded. FAOSTAT is the sole numerical source, so values from different providers are not averaged. Ranks use the underlying values, while summary and chart labels are rounded for readability. No forecast or projection formula is applied.
The broad regional labels are used only to organize and filter the country ranking. They do not affect production values or rank.
This metric does not measure poultry exports, domestic consumption, production per person, live chicken inventories, farm productivity, producer revenue, industry profitability or total meat production from all poultry species.
Chicken Meat Production by Country: Top 50
The full ranking uses the same 2024 FAOSTAT production series and tonne unit for every included country.
Top 50 countries by chicken meat production, 2024
| Rank | Entity | Value | Region / note |
|---|---|---|---|
| 1 | United States | 20,176,636 t | Americas · FAOSTAT · official value · 2024. |
| 2 | China | 15,350,000 t | Asia · FAOSTAT · official value · 2024 · China, mainland series. |
| 3 | Brazil | 13,714,702 t | Americas · FAOSTAT · official value · 2024. |
| 4 | Russian Federation | 5,457,330 t | Europe · FAOSTAT · official value · 2024. |
| 5 | India | 5,019,410 t | Asia · FAOSTAT · official value · 2024. |
| 6 | Indonesia | 4,179,444.2 t | Asia · FAOSTAT · official value · 2024. |
| 7 | Mexico | 4,013,215.8 t | Americas · FAOSTAT · official value · 2024. |
| 8 | Egypt | 2,598,603.5 t | Africa · FAOSTAT · official value · 2024. |
| 9 | Türkiye | 2,512,130.8 t | Asia · FAOSTAT · official value · 2024. |
| 10 | Japan | 2,466,966.5 t | Asia · FAOSTAT · official value · 2024. |
| 11 | Poland | 2,433,020 t | Europe · FAOSTAT · official value · 2024. |
| 12 | Pakistan | 2,362,000 t | Asia · FAOSTAT · official value · 2024. |
| 13 | Argentina | 2,304,000 t | Americas · FAOSTAT · official value · 2024. |
| 14 | Iran | 2,268,606.5 t | Asia · FAOSTAT · official value · 2024. |
| 15 | Thailand | 1,917,976.6 t | Asia · FAOSTAT · official value · 2024. |
| 16 | South Africa | 1,915,000 t | Africa · FAOSTAT · official value · 2024. |
| 17 | Peru | 1,859,237.6 t | Americas · FAOSTAT · official value · 2024. |
| 18 | United Kingdom | 1,852,000 t | Europe · FAOSTAT · official value · 2024. |
| 19 | Colombia | 1,821,768.1 t | Americas · FAOSTAT · official value · 2024. |
| 20 | Malaysia | 1,602,620.2 t | Asia · FAOSTAT · official value · 2024. |
| 21 | Philippines | 1,601,795 t | Asia · FAOSTAT · official value · 2024. |
| 22 | Spain | 1,517,910 t | Europe · FAOSTAT · official value · 2024. |
| 23 | Australia | 1,477,685 t | Oceania · FAOSTAT · official value · 2024. |
| 24 | Canada | 1,418,174 t | Americas · FAOSTAT · official value · 2024. |
| 25 | Viet Nam | 1,259,484.5 t | Asia · FAOSTAT · official value · 2024. |
| 26 | France | 1,245,830 t | Europe · FAOSTAT · official value · 2024. |
| 27 | Italy | 1,134,090 t | Europe · FAOSTAT · official value · 2024. |
| 28 | Ukraine | 1,120,200 t | Europe · FAOSTAT · official value · 2024. |
| 29 | Germany | 1,114,000 t | Europe · FAOSTAT · official value · 2024. |
| 30 | Republic of Korea | 935,000 t | Asia · FAOSTAT · official value · 2024. |
| 31 | Netherlands | 840,530 t | Europe · FAOSTAT · official value · 2024. |
| 32 | Saudi Arabia | 757,432.2 t | Asia · FAOSTAT · official value · 2024. |
| 33 | Myanmar | 707,500 t | Asia · FAOSTAT · official value · 2024. |
| 34 | Chile | 695,566 t | Americas · FAOSTAT · official value · 2024. |
| 35 | Israel | 600,072 t | Asia · FAOSTAT · official value · 2024. |
| 36 | Morocco | 583,000 t | Africa · FAOSTAT · official value · 2024. |
| 37 | Bolivia | 579,764.1 t | Americas · FAOSTAT · official value · 2024. |
| 38 | Ecuador | 554,360 t | Americas · FAOSTAT · official value · 2024. |
| 39 | Belarus | 549,184.44 t | Europe · FAOSTAT · official value · 2024. |
| 40 | Venezuela | 541,858.2 t | Americas · FAOSTAT · official value · 2024. |
| 41 | Romania | 532,940 t | Europe · FAOSTAT · official value · 2024. |
| 42 | Belgium | 531,510 t | Europe · FAOSTAT · official value · 2024. |
| 43 | Algeria | 448,819.53 t | Africa · FAOSTAT · official value · 2024. |
| 44 | Dominican Republic | 421,615.2 t | Americas · FAOSTAT · official value · 2024. |
| 45 | Hungary | 401,760 t | Europe · FAOSTAT · official value · 2024. |
| 46 | Guatemala | 391,941.88 t | Americas · FAOSTAT · official value · 2024. |
| 47 | Kazakhstan | 352,738 t | Asia · FAOSTAT · official value · 2024. |
| 48 | Nigeria | 342,932.8 t | Africa · FAOSTAT · official value · 2024. |
| 49 | Portugal | 341,120 t | Europe · FAOSTAT · official value · 2024. |
| 50 | Jordan | 302,275 t | Asia · FAOSTAT · official value · 2024. |
Insights from the 2024 data
Key Insight
The United States, China and Brazil occupy a separate production tier. Brazil at #3 produced 8,257,372 tonnes more than the Russian Federation at #4.
Notable Pattern
The ranking becomes much tighter farther down the table. Malaysia at #20 and the Philippines at #21 differ by only 825.2 tonnes.
Regional Concentration
Using the broad regional grouping on this page, Asia accounts for 9 of the Top 20 countries, the Americas for 6, Europe for 3 and Africa for 2.
Outlier
The United States produced about 66.7 times the output recorded for Jordan, the #50 country in this ranking.
What the ranking means
The ranking compares the scale of national chicken meat production. It does not show where the most chicken meat was exported or consumed, and it does not measure output relative to population.
A high production rank can coexist with very different domestic market sizes, trade positions and poultry industries. The ranking therefore compares production volume rather than the causes of production differences.
Live chicken stocks and slaughter counts should also be interpreted separately. Stocks measure birds, slaughter statistics count animals, and the meat production series measures output in tonnes.
The 2026 label describes the publication snapshot. The observations used in the ranking are for 2024.
Download the Chicken Meat Production by Country 2026: FAOSTAT 2024 Ranking dataset
Chicken Meat Production by Country 2026: FAOSTAT 2024 Ranking
50 ranked entries · Excel + CSV + methodology + sources + chart · Snapshot: August 16, 2026 · Version 1.0
No signup required. The archive includes machine-readable data, methodology and source documentation. Quick human verification is required before the ZIP is delivered.
Download Excel + CSV Data PackFAQ
Which country produces the most chicken meat?
The United States ranks first in the 2024 series used here, with 20,176,636 tonnes.
How much chicken meat did China produce?
China ranks second with 15,350,000 tonnes in 2024, based on the FAOSTAT China, mainland series.
Is this a ranking of all poultry meat?
No. The ranking uses the chicken-specific FAOSTAT product “Meat of chickens, fresh or chilled.” Duck, turkey and other poultry meats are separate products.
Are live chicken stocks included?
No. Live chicken stocks measure the number of birds, while this ranking measures annual chicken meat output in tonnes.
Does the ranking use the number of chickens slaughtered?
No. The ranked values are meat production quantities in tonnes rather than slaughter head counts.
Are eggs or poultry exports included?
No. Eggs are a separate livestock product, and exports are trade flows. Neither is added to the production values shown here.
Why does the page say 2026 when the data are from 2024?
This is a 2026 snapshot based on official 2024 production data. The ranking does not project 2026 output.
Sources
FAOSTAT — Crops and livestock products
Primary source for country production values, product definitions, reference year and tonne unit.
FAOSTAT — QCL methodology
Methodological reference for meat production, dressed carcass weight and poultry reporting in ready-to-cook equivalent.
https://files-faostat.fao.org/production/QCL/QCL_methodology_e.pdf
FAOSTAT — Production dataset registry
Official registry entry for the Crops and livestock products production dataset.
FAOSTAT — Definitions and standards
Reference for FAOSTAT classifications, terminology and statistical conventions.
Download data archive
ZIP archive with CSV and HTML copies of the tables published on this page, plus external source links, a manifest and README. The archive does not add new estimates or recalculate ranking values.
Related rankings
More StatRanker pages connected by topic, category or ranking theme.
