

Electricity Consumption by Country 2026: Top 50 EIA 2024 Ranking
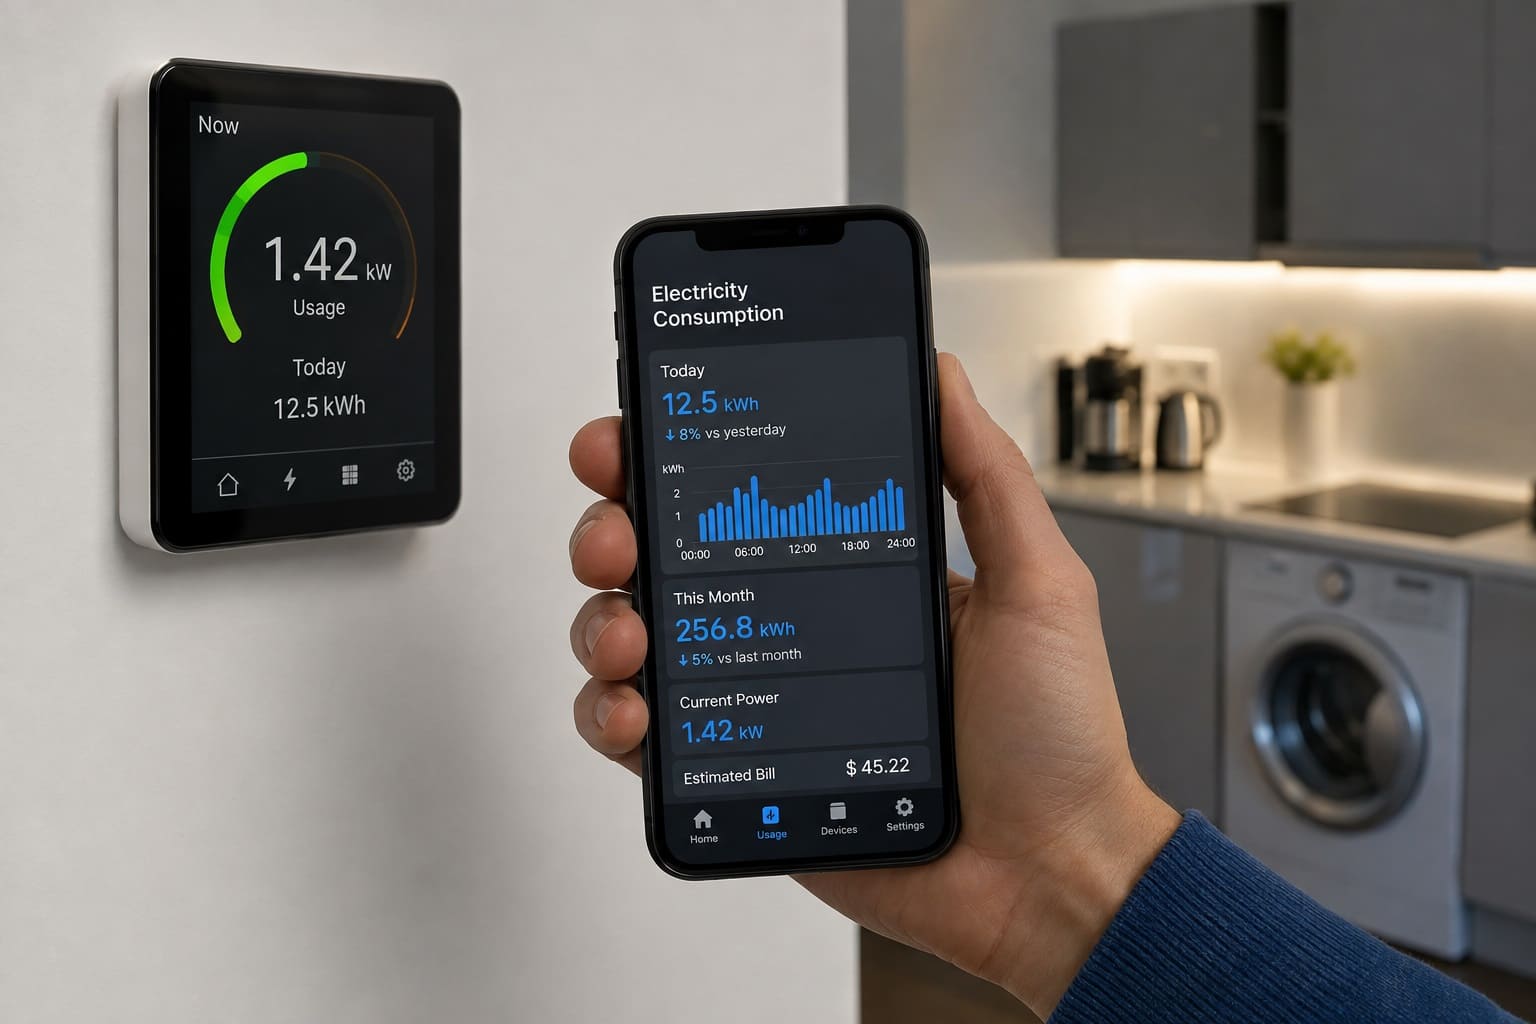
Electricity consumption by country based on official EIA data
China was the world's largest electricity consumer in the U.S. Energy Information Administration's 2024 international ranking, with 9,794 terawatt-hours of net electricity consumption. The United States ranked second at 4,194 TWh, followed by India at 1,758 TWh.
This page ranks the 50 highest entries in EIA's 2024 table by total electricity net consumption. The comparison uses absolute consumption rather than electricity consumption per capita, so it measures the scale of national electricity demand rather than average use per resident.
EIA reports the international series in billion kilowatthours. One billion kilowatthours equals one terawatt-hour, so the published numeric values are displayed here directly in TWh. All entries use official historical 2024 values; the ranking contains no 2026 forecasts or modeled estimates.
Continue exploring
More StatRanker pages connected by topic, category or ranking theme.
Dry Natural Gas Production by Country 2026: EIA 2024 Ranking
Open rankingCrude Oil Production by Country 2026: Top 10 EIA 2025 Ranking
Open rankingGold Production by Country 2026: 2025 USGS Mine-Production Estimates
Open rankingChina ranks first in EIA's 2024 electricity net consumption table.
Switzerland ranks 50th among the entries included on this page.
The table covers the 50 highest-ranked countries and economies in EIA's 2024 international table.
50 official historical values; no forecasts and no modeled estimates.
What this electricity consumption ranking measures
The ranking compares electricity net consumption in absolute terawatt-hours. It is designed to answer a straightforward question: which national electricity systems consume the largest total amount of electricity?
EIA defines net electricity consumption as electricity generation plus imports, minus exports and transmission and distribution losses. The measure therefore differs from electricity generation. Cross-border electricity trade and grid losses can cause the amount consumed within an economy to differ from the amount generated there.
Population is not part of the ranking formula. A large country can rank near the top because of population, industrial activity and the overall scale of its economy even when electricity consumption per person is below that of a smaller economy.
This distinction separates the ranking from electricity consumption per capita. Total TWh is useful for comparing electricity-market scale and aggregate demand, while a per-capita measure answers how much electricity is consumed relative to population.
Top 10 countries by electricity consumption in 2024
The top of the ranking is highly concentrated. China and the United States occupy the first two positions by a wide margin, while India is the only other country above 1,500 TWh. Russia and Japan complete the Top 5.
Top 10 by electricity net consumption, EIA 2024
| Rank | Entity | TWh | Region / note |
|---|---|---|---|
| 1 | China | 9,794 | East Asia & Pacific; EIA; 2024 historical value. |
| 2 | United States | 4,194 | North America; EIA; 2024 historical value. |
| 3 | India | 1,758 | South Asia; EIA; 2024 historical value. |
| 4 | Russia | 1,045 | Europe & Central Asia; EIA; 2024 historical value. |
| 5 | Japan | 859 | East Asia & Pacific; EIA; 2024 historical value. |
| 6 | Brazil | 636 | Latin America & Caribbean; EIA; 2024 historical value. |
| 7 | Canada | 573 | North America; EIA; 2024 historical value. |
| 8 | South Korea | 558 | East Asia & Pacific; EIA; 2024 historical value. |
| 9 | Germany | 490 | Europe & Central Asia; EIA; 2024 historical value. |
| 10 | France | 410 | Europe & Central Asia; EIA; 2024 historical value. |
EIA reports these values in billion kilowatthours. The figures are numerically identical in TWh because 1 billion kWh equals 1 TWh.
Top 20 electricity consumers
The chart uses the same 2024 values as the ranking table. China's electricity consumption is about 2.3 times the U.S. level and more than five times India's value.
Regional distribution within the Top 50
The 50 values displayed on this page sum to 26,904 TWh. The regional figures below are StatRanker calculations based only on those 50 rows. They are not EIA estimates of complete regional or global electricity consumption.
East Asia & Pacific
China accounts for most of this subtotal, with Japan, South Korea, Indonesia, Vietnam and other East Asian and Pacific economies also represented.
North America
The subtotal reflects the United States and Canada under the analytical regional grouping used on this page.
Europe & Central Asia
Russia is the largest contributor, followed by Germany, France, Turkiye, Italy, the United Kingdom and other European and Central Asian economies.
South Asia
India dominates the South Asian subtotal, with Pakistan and Bangladesh also appearing in the Top 50.
Middle East & North Africa
Saudi Arabia and Iran are the two largest electricity consumers in this group, followed by Egypt and the United Arab Emirates.
Latin America & Caribbean
Brazil contributes the largest share of this subtotal, followed by Mexico, Argentina, Colombia, Chile and Venezuela.
Sub-Saharan Africa contributes 217 TWh, or 0.8% of the Top 50 subtotal, through South Africa. The regional labels are analytical groupings used for comparison and filtering; EIA remains the source of every country-level electricity value.
Methodology
The ranking uses the U.S. Energy Information Administration's International Energy Statistics series for electricity net consumption in calendar year 2024. The page is presented as a 2026 snapshot because 2024 is the historical year used for the ranking, not because the values represent projected 2026 consumption.
All 50 rows are historical EIA values for 2024. No forecast or projection methodology is applied, so base-year assumptions, growth parameters and projection formulas are not applicable.
Metric
Electricity net consumption: electricity generation plus imports, minus exports and transmission and distribution losses.
Unit
The EIA ranking is published in billion kilowatthours. Since 1 billion kWh equals 1 TWh, the numeric values are displayed directly in terawatt-hours.
Ranking direction
Countries and economies are ordered from highest to lowest electricity consumption. Larger TWh values receive higher positions.
Coverage
This page includes the first 50 entries in EIA's 2024 ranking. It is a Top 50 table rather than a reproduction of every economy available in the EIA database.
Source treatment
Country values come from EIA only. No third-party estimates are merged into the ranking, and no conflicting values are averaged.
Missing values and ties
No missing values occur within the selected Top 50 rows. When EIA displays equal rounded values, the order shown in the official ranking is retained.
EIA's ranking interface presents the country values as whole billion kilowatthours. The page does not add artificial decimal precision. The interactive value sort therefore uses the displayed TWh value and retains the original EIA rank as the tie-breaker.
The regional analysis is derived from the country table rather than taken from EIA. Regional subtotal is the sum of included country values. Regional Top 50 share is calculated as the regional subtotal divided by 26,904 TWh and multiplied by 100.
The ranking does not measure electricity consumption per capita, household electricity use, electricity prices, installed generating capacity, total electricity generation, renewable-energy share, carbon intensity, energy efficiency or total primary energy consumption.
Top 50 countries and economies by electricity consumption
The table ranks the 50 highest entries in EIA's 2024 electricity net consumption dataset. Use the controls to search by country, compare regional groups or change the order of the displayed rows.
Electricity net consumption, 2024
| Rank | Entity | TWh | Region / note |
|---|---|---|---|
| 1 | China | 9,794 | East Asia & Pacific; EIA; 2024 historical value. |
| 2 | United States | 4,194 | North America; EIA; 2024 historical value. |
| 3 | India | 1,758 | South Asia; EIA; 2024 historical value. |
| 4 | Russia | 1,045 | Europe & Central Asia; EIA; 2024 historical value. |
| 5 | Japan | 859 | East Asia & Pacific; EIA; 2024 historical value. |
| 6 | Brazil | 636 | Latin America & Caribbean; EIA; 2024 historical value. |
| 7 | Canada | 573 | North America; EIA; 2024 historical value. |
| 8 | South Korea | 558 | East Asia & Pacific; EIA; 2024 historical value. |
| 9 | Germany | 490 | Europe & Central Asia; EIA; 2024 historical value. |
| 10 | France | 410 | Europe & Central Asia; EIA; 2024 historical value. |
| 11 | Saudi Arabia | 406 | Middle East & North Africa; EIA; 2024 historical value. |
| 12 | Indonesia | 376 | East Asia & Pacific; EIA; 2024 historical value. |
| 13 | Iran | 347 | Middle East & North Africa; EIA; 2024 historical value. |
| 14 | Mexico | 343 | Latin America & Caribbean; EIA; 2024 historical value. |
| 15 | Turkiye | 303 | Europe & Central Asia; EIA; 2024 historical value. |
| 16 | Vietnam | 301 | East Asia & Pacific; EIA; 2024 historical value. |
| 17 | Italy | 290 | Europe & Central Asia; EIA; 2024 historical value. |
| 18 | Taiwan | 278 | East Asia & Pacific; EIA; 2024 historical value. |
| 19 | United Kingdom | 275 | Europe & Central Asia; EIA; 2024 historical value. |
| 20 | Australia | 257 | East Asia & Pacific; EIA; 2024 historical value. |
| 21 | Spain | 233 | Europe & Central Asia; EIA; 2024 historical value. |
| 22 | Thailand | 223 | East Asia & Pacific; EIA; 2024 historical value. |
| 23 | South Africa | 217 | Sub-Saharan Africa; EIA; 2024 historical value. |
| 24 | Malaysia | 181 | East Asia & Pacific; EIA; 2024 historical value. |
| 25 | Egypt | 174 | Middle East & North Africa; EIA; 2024 historical value. |
| 26 | United Arab Emirates | 161 | Middle East & North Africa; EIA; 2024 historical value. |
| 27 | Poland | 158 | Europe & Central Asia; EIA; 2024 historical value. |
| 28 | Norway | 129 | Europe & Central Asia; EIA; 2024 historical value. |
| 29 | Pakistan | 128 | South Asia; EIA; 2024 historical value. |
| 30 | Sweden | 127 | Europe & Central Asia; EIA; 2024 historical value. |
| 31 | Argentina | 123 | Latin America & Caribbean; EIA; 2024 historical value. |
| 32 | Kazakhstan | 113 | Europe & Central Asia; EIA; 2024 historical value. |
| 33 | Philippines | 112 | East Asia & Pacific; EIA; 2024 historical value. |
| 34 | Netherlands | 110 | Europe & Central Asia; EIA; 2024 historical value. |
| 35 | Colombia | 107 | Latin America & Caribbean; EIA; 2024 historical value. |
| 36 | Bangladesh | 104 | South Asia; EIA; 2024 historical value. |
| 37 | Ukraine | 87 | Europe & Central Asia; EIA; 2024 historical value. |
| 38 | Algeria | 85 | Middle East & North Africa; EIA; 2024 historical value. |
| 39 | Kuwait | 85 | Middle East & North Africa; EIA; 2024 historical value. |
| 40 | Chile | 83 | Latin America & Caribbean; EIA; 2024 historical value. |
| 41 | Finland | 79 | Europe & Central Asia; EIA; 2024 historical value. |
| 42 | Belgium | 79 | Europe & Central Asia; EIA; 2024 historical value. |
| 43 | Uzbekistan | 75 | Europe & Central Asia; EIA; 2024 historical value. |
| 44 | Iraq | 67 | Middle East & North Africa; EIA; 2024 historical value. |
| 45 | Israel | 67 | Middle East & North Africa; EIA; 2024 historical value. |
| 46 | Czechia | 64 | Europe & Central Asia; EIA; 2024 historical value. |
| 47 | Venezuela | 63 | Latin America & Caribbean; EIA; 2024 historical value. |
| 48 | Austria | 62 | Europe & Central Asia; EIA; 2024 historical value. |
| 49 | Singapore | 59 | East Asia & Pacific; EIA; 2024 historical value. |
| 50 | Switzerland | 56 | Europe & Central Asia; EIA; 2024 historical value. |
Source: U.S. Energy Information Administration, International Energy Statistics, Electricity net consumption, 2024. EIA's billion-kWh values are displayed as the numerically equivalent TWh values. Where rounded values are equal, the original EIA ranking order is retained.
What stands out in the Top 50
Key insight
China is in a separate consumption tier. Its 9,794 TWh is about 2.3 times the U.S. value and represents 36.4% of the sum of the 50 values displayed on this page.
Notable pattern
China, the United States and India together account for 15,746 TWh, equal to 58.5% of the Top 50 subtotal.
Regional concentration
East Asia & Pacific contributes 12,998 TWh, or 48.3% of the Top 50 subtotal, driven primarily by China's position at the top of the ranking.
Outlier
China is the clear outlier at the top of the ranking. The 5,600 TWh gap between China and the United States alone is more than twice the combined 2,383 TWh consumed by ranks 26–50 in this table.
How to interpret electricity consumption rankings
Absolute electricity consumption reflects the combined scale of factors such as population, industrial production, commercial activity, electrification, climate-related demand and the structure of the economy. The ranking shows how much electricity is consumed, not why a particular country reaches that level.
A high position should not be interpreted as evidence of poor energy efficiency. China, the United States and India operate very large electricity systems, and their absolute consumption reflects economic and demographic scale that is not captured by smaller per-capita comparisons.
The ranking also should not be read as a generation ranking. Electricity imports, exports and transmission and distribution losses are part of the relationship between generation and net consumption, so the two measures can differ.
For comparisons of national electricity-market size and aggregate demand, TWh is the relevant metric. For comparisons of electricity use relative to population, a separate per-capita measure is more appropriate.
FAQ
Which country consumes the most electricity?
China ranks first in EIA's 2024 electricity net consumption table at 9,794 TWh, compared with 4,194 TWh for the second-ranked United States.
Are these 2026 electricity consumption figures?
No. This is a 2026 ranking page based on official historical EIA data for 2024. The table does not estimate or forecast electricity consumption for 2026.
What is electricity net consumption?
EIA defines electricity net consumption as generation plus electricity imports, minus electricity exports and transmission and distribution losses.
Why are EIA values shown in TWh?
EIA's ranking is expressed in billion kilowatthours. One billion kilowatthours equals one terawatt-hour, so the numeric value is unchanged when the unit is written as TWh.
Is electricity consumption the same as electricity generation?
No. Generation measures electricity produced, while net consumption also reflects electricity imports, exports and network losses.
Is this a per-capita electricity ranking?
No. Countries are ranked by total electricity consumption in TWh. Population is not used to calculate the positions.
Why can two countries with the same displayed TWh have different ranks?
EIA displays the ranking values rounded to whole billion kilowatthours. When two displayed values are equal, this page preserves their order in EIA's official ranking instead of adding unsupported decimal precision.
Do the regional percentages show each region's share of world electricity consumption?
No. They are calculated only from the 50 rows displayed on this page. They describe the composition of this Top 50 table and are not complete global regional shares.
Sources
U.S. EIA — Electricity net consumption ranking
Primary official source for the country order and 2024 electricity net consumption values used in the ranking.
https://www.eia.gov/international/rankings/country/CHN?aid=2&f=A&pid=2&u=0&v=none&y=01%2F01%2F2024
U.S. EIA — International electricity consumption data
Official International Energy Statistics interface for country-level electricity consumption data.
https://www.eia.gov/international/data/world/electricity/electricity-consumption
U.S. EIA — Electricity data
EIA's electricity data directory and access point for U.S. and international electricity statistics.
U.S. EIA Glossary — Net electricity consumption
Official definition used to distinguish electricity net consumption from electricity generation and other electricity metrics.
https://www.eia.gov/tools/glossary/index.php?id=Net+electricity+consumption
Related rankings
More StatRanker pages connected by topic, category or ranking theme.
Oil Reserves by Country 2026: Proven Crude Oil Reserves at End-2025
Open rankingTop 100 Countries by Installed Solar Capacity, 2026
Open rankingTop Helium-Producing Countries in the World (2025 Ranking)
Open rankingTop 20 Countries by Rare Earth Mine Production, 2025
Open ranking
StatRanker (Website)
administrator
