

Top 20 Countries by Protected Marine Area, 2026
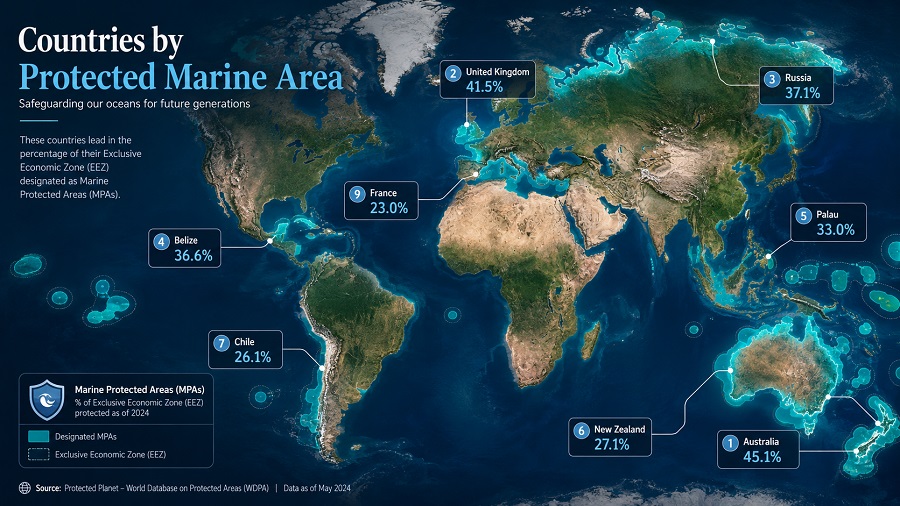
Countries and territories with the largest marine protected areas
Protected marine area measures the marine portion of sites reported as protected or conserved, expressed in square kilometres. The 2026 snapshot ranks jurisdictions by declared marine area, then explains why size alone is not the same as conservation strength. French Polynesia ranks first after the 2025 upgrade of Tainui Atea, which covers more than 4.5 million km² and includes 1.1 million km² of highly or fully protected ocean.
The largest declared marine protected areas are concentrated in Pacific island jurisdictions, large ocean states and overseas territories with extensive exclusive economic zones. Australia, the Cook Islands, the United States and Chile complete the top five by area. The ranking uses May 2026 source checks and should be read as a scale comparison, not as a direct measure of enforcement quality, ecological condition or no-take protection.
Key figures in the 2026 marine protected area snapshot
Tainui Atea in French Polynesia, the largest single declared marine protected area.
Continue exploring
More StatRanker rankings on climate, environment, resources and sustainability.
Top 100 Countries by Share of Land in Protected Areas, 2025
Open rankingTop 100 Largest Countries by Land Area, 2026 Snapshot
Open rankingTop 100 Countries and Territories by Coral Reef Area, 2026
Open rankingHighly or fully protected ocean announced inside the Tainui Atea upgrade.
Global marine protected and conserved coverage reported by Protected Planet in the 2026 snapshot.
Ocean area assessed by MPAtlas as effectively protected as of March 2026.
What the largest marine protected areas reveal
The upper ranks are shaped by marine geography. Pacific island jurisdictions can outrank much larger land economies because the metric is absolute ocean area, not population, GDP or land size. French Polynesia, the Cook Islands, New Caledonia, Pitcairn and Palau all sit high in the ranking because their maritime zones are large relative to their land area.
Continental countries reach the top through large national networks or remote-ocean designations. Australia combines Commonwealth marine parks, state systems and the Great Barrier Reef. The United States ranks high because of Pacific monuments and sanctuaries. Chile’s position is driven by remote Pacific and sub-Antarctic MPAs rather than by mainland coastal waters alone.
The most important comparison is not only “how large” but “how protected.” A no-take reserve, a highly protected zone and a multiple-use marine park can all contribute to the same area total, although their rules and conservation outcomes differ substantially.
Top 10 jurisdictions by declared marine protected area
The short table highlights the leading jurisdictions before the full Top 20. Values are rounded figures based on Protected Planet profiles, named MPA records and official updates available in May 2026.
| Rank | Jurisdiction and principal MPA | Area, km² | Protection context |
|---|---|---|---|
| 1 | French PolynesiaTainui Atea | 4,500,000+ | Largest declared MPA; 1.1 million km² highly or fully protected. |
| 2 | AustraliaCommonwealth Marine Parks network + GBR + state MPAs | 3,300,000 | Large national network with mixed zoning. |
| 3 | Cook IslandsMarae Moana | 1,976,000 | Whole-EEZ marine park with a large no-take core. |
| 4 | United StatesPapahānaumokuākea, Pacific Remote Islands, Mariana Trench | 1,640,000 | Large Pacific monuments and sanctuaries. |
| 5 | ChileRapa Nui, Nazca-Desventuradas, Diego Ramírez–Drake Passage | 1,507,000 | Remote Pacific and sub-Antarctic designations. |
| 6 | New CaledoniaNatural Park of the Coral Sea | 1,293,000 | Large multiple-use park with stronger zones inside it. |
| 7 | New ZealandMarine reserves and sub-Antarctic designations | 1,247,000 | Several designation types with different rules. |
| 8 | South Georgia & South Sandwich IslandsSGSSI Marine Protected Area | 1,237,000 | 38% no-take after the 2024 enhancement. |
| 9 | BrazilTrindade-Martín Vaz and São Pedro & São Paulo MPAs | 1,010,000 | Large offshore MPAs with mixed restrictions. |
| 10 | Pitcairn IslandsPitcairn Islands Marine Reserve | 842,000 | Full-EEZ no-take marine reserve. |
Scale comparison: top 15 by protected marine area
The area distribution is steep. French Polynesia and Australia together account for more than 7.8 million km² in this rounded snapshot. Below the top ten, a new 100,000–300,000 km² designation can change the order quickly.
Full Top 20 table: largest marine protected areas
Rows are ranked by declared protected marine area in km². The protection-context column separates broad area coverage from stricter conservation status, because a large multiple-use MPA should not be interpreted the same way as a no-take reserve.
| Rank | Jurisdiction and principal MPA | Area, km² | Protection context |
|---|---|---|---|
| 1 | French PolynesiaTainui Atea | 4,500,000+ | Upgraded in 2025; more than 4.5 million km² total, including 1.1 million km² highly or fully protected. |
| 2 | AustraliaCommonwealth Marine Parks network + Great Barrier Reef + state MPAs | 3,300,000 | Large national network; zoning ranges from multiple-use to sanctuary areas. |
| 3 | Cook IslandsMarae Moana | 1,976,000 | Whole-EEZ marine park; the strict no-take component is smaller than the total park area. |
| 4 | United StatesPapahānaumokuākea, Pacific Remote Islands, Mariana Trench | 1,640,000 | Large Pacific monuments and sanctuaries; strict protection is high relative to many national networks. |
| 5 | ChileRapa Nui, Nazca-Desventuradas, Diego Ramírez–Drake Passage | 1,507,000 | Remote Pacific and sub-Antarctic MPAs drive the national total. |
| 6 | New CaledoniaNatural Park of the Coral Sea | 1,293,000 | Very large park with stronger protection zones inside a broader managed area. |
| 7 | New ZealandMarine reserves and sub-Antarctic designations | 1,247,000 | Coverage includes several designation types; restrictions differ by site. |
| 8 | South Georgia & South Sandwich IslandsSGSSI Marine Protected Area | 1,237,000 | 2024 measures expanded no-take zones to over 470,000 km², or 38% of the MPA. |
| 9 | BrazilTrindade-Martín Vaz and São Pedro & São Paulo offshore MPAs | 1,010,000 | Large offshore coverage; protection strength varies by zone and activity type. |
| 10 | Pitcairn IslandsPitcairn Islands Marine Reserve | 842,000 | Full-EEZ no-take reserve, so declared area and strict area are closely aligned. |
| 11 | MexicoRevillagigedo National Park and Mexican Pacific Deep MPA | 719,000 | Pacific offshore designations contribute most of the large-area total. |
| 12 | CanadaTuvaijuittuq, Tang.G̱waay Haanas, Tarium Niryutait and eastern-canyon sites | 657,000 | Arctic, Pacific and Atlantic sites combine into a large national MPA network. |
| 13 | PalauPalau National Marine Sanctuary | 604,000 | Large sanctuary system with a major no-take area and a domestic fishing zone. |
| 14 | KiribatiPhoenix Islands Protected Area | 409,000 | Area remains important, but the 2022 reversal materially changed the no-take status. |
| 15 | United KingdomDomestic MCZ, SAC and related marine network | 340,000 | Domestic network only; overseas territories are treated separately where separately profiled. |
| 16 | ColombiaYuruparí-Malpelo, Serranilla and Seaflower | 299,000 | Pacific and Caribbean designations lift Colombia into the Top 20. |
| 17 | PortugalSelvagens Marine Reserve and Azores 30×30 network | 287,000 | Atlantic island systems are central to the protected marine area total. |
| 18 | EcuadorGalápagos Marine Reserve and Hermandad Reserve | 208,000 | Eastern Pacific corridor designations shape Ecuador’s marine conservation profile. |
| 19 | FranceIroise, Pelagos sector and metropolitan marine network | 171,000 | Metropolitan France only; French Polynesia and New Caledonia are separate rows. |
| 20 | Russian FederationRussian Arctic NP, Franz Josef Land, Komandorsky and Wrangel Island | 170,000 | Arctic and Far Eastern protected-area systems dominate the marine coverage. |
Table note: values are rounded because source precision and update timing differ across WDPA profiles, government records and individual MPA pages. “Area” means declared protected marine area; it does not imply equal enforcement, no-take coverage or ecological outcome.
Methodology
Indicator and unit
The ranking uses declared protected marine area in square kilometres. The indicator covers the marine portions of protected areas and conserved areas reported through the World Database on Protected Areas and the World Database on Other Effective Area-Based Conservation Measures, as surfaced by Protected Planet.
Snapshot and source logic
May 2026 is used as the update point because several large marine designations changed after the 2024 global progress assessments. The 2025 French Polynesia upgrade, the South Georgia no-take expansion entering into force in 2025 and recent MPAtlas updates all affect how the largest MPAs should be interpreted.
How rows were ranked
Jurisdictions are sorted by reported protected marine area. Where a jurisdiction has one dominant MPA, the table names that site. Where the total comes from a network, the table names the main network or the largest component designations. Overseas territories are listed separately when Protected Planet and the relevant governance structure treat them as separate profiles.
Rounding and harmonisation
Most values are rounded to the nearest thousand square kilometres. French Polynesia is shown as 4,500,000+ km² rather than as a false-precision figure because official 2025 sources describe Tainui Atea as covering more than 4.5 million km² or nearly 5 million km², while the strict-protection addition is reported as 1.1 million km².
Limits of comparability
- Declared area does not measure enforcement, staffing, monitoring quality, ecological condition or compliance.
- Multiple-use MPAs and full no-take reserves both count toward area totals, although their conservation strength differs.
- WDPA submissions can lag behind legal changes, boundary revisions and degazettements.
- Absolute km² favours jurisdictions with large exclusive economic zones; share of EEZ would produce a different ranking.
- Strict-protection shares are not consistently reported for every country and territory, so the table uses contextual notes rather than unsupported no-take percentages for every row.
Insights from the marine protected area ranking
The top five are not simply the world’s largest economies or countries. They are jurisdictions with either vast marine zones or unusually large remote-ocean designations. This explains why French Polynesia, the Cook Islands and Chile rank beside Australia and the United States.
Ranks 11–20 are driven less by whole-EEZ parks and more by offshore reserves, island systems and national MPA networks. Mexico, Canada, Colombia, Portugal and Ecuador all illustrate how a small number of large marine designations can change a country’s position in the global table.
The lower part of the Top 20 is sensitive to updates. A single new MPA of 100,000–300,000 km² can shift several places, while legal reversals can weaken actual protection without immediately reducing reported area. Kiribati’s Phoenix Islands Protected Area is the clearest caution: the area remains large, but the no-take status changed materially after the 2022 reversal.
Large multiple-use MPAs should not be compared directly with no-take reserves unless the protection category, legal restrictions and enforcement conditions are considered alongside area.
What this ranking means for readers
For readers comparing ocean policy, the ranking identifies where the largest marine conservation commitments are located and which jurisdictions shape progress toward the 30% by 2030 target. It is useful for understanding scale, but it should be paired with protection category, management rules and enforcement evidence before drawing conclusions about ecological impact.
For fisheries, tourism operators, conservation researchers and marine planners, the distinction between declared area and strict protection is practical. A broad multiple-use MPA can affect planning and policy while still allowing some extractive or commercial activity. A smaller no-take reserve may impose stronger restrictions and deliver clearer biodiversity benefits in the zones where it is effectively enforced.
FAQ
What does protected marine area actually measure?
It measures the marine portion of areas reported as protected or conserved in WDPA and WD-OECM systems. The unit is square kilometres. The metric reflects declared boundaries, not the strength of rules inside them.
Why is French Polynesia ranked first?
French Polynesia ranks first because Tainui Atea covers more than 4.5 million km² and was upgraded in 2025. The upgrade includes 1.1 million km² of highly or fully protected ocean, while the wider MPA remains much larger than the strict-protection component.
Are no-take zones the same as marine protected areas?
No. A no-take zone prohibits extractive activities. Many MPAs are multiple-use areas where some fishing, transit, tourism or research can continue under rules. That is why broad MPA coverage is higher than effectively protected ocean coverage.
Why do some territories appear separately from countries?
Some overseas territories have separate protected-area profiles, separate legal systems and separate MPA governance. Listing them separately makes the management responsibility clearer, especially for large ocean territories such as South Georgia, Pitcairn, French Polynesia and New Caledonia.
Why can the ranking change quickly?
Large new designations, boundary extensions, zoning changes and degazettements can all change the ranking. Reporting updates can also move figures when national submissions to WDPA are revised.
Why not rank by share of EEZ?
Share of EEZ answers a different question: how much of a jurisdiction’s own marine area is protected. Absolute km² compares the global scale of designations. Both are useful, but they should not be treated as the same indicator.
Sources
Primary datasets and official references used for area coverage, designation context and protection-strength interpretation.
Primary reference for country and territory protected-area profiles and global marine protected and conserved coverage.
Used to interpret fully, highly and effectively protected ocean coverage and the gap with broad reported coverage.
Used for the 2025 French Polynesia upgrade, the “more than 4.5 million km²” total and the 1.1 million km² highly or fully protected component.
Cross-check for French Polynesia’s nearly 5 million km² EEZ-scale commitment and the 1.1 million km² strict-protection figure.
Used for the SGSSI MPA enhancement and the 38% no-take figure covering more than 470,000 km².
Official reference for the Cook Islands marine park and the no-take area within Marae Moana.
Used for context on one of the largest U.S. Pacific marine monument and sanctuary systems.
Used for Kiribati’s PIPA status and the interpretation of the 2022 no-take reversal.
Related rankings
More StatRanker rankings on climate, environment, resources and sustainability.
Countries by Forest Area per Person ТОП-100, 2026
Open rankingTop 100 Countries by Forest Area per Capita, 2025
Open rankingTop 100 Countries by Threatened Mammal and Bird Species Count, 2026 Snapshot
Open rankingTop 100 Countries by Reptile Species Richness, 2026
Open ranking
StatRanker (Website)
administrator
