

Largest Countries by Land Area 2026: Top 100 Ranking
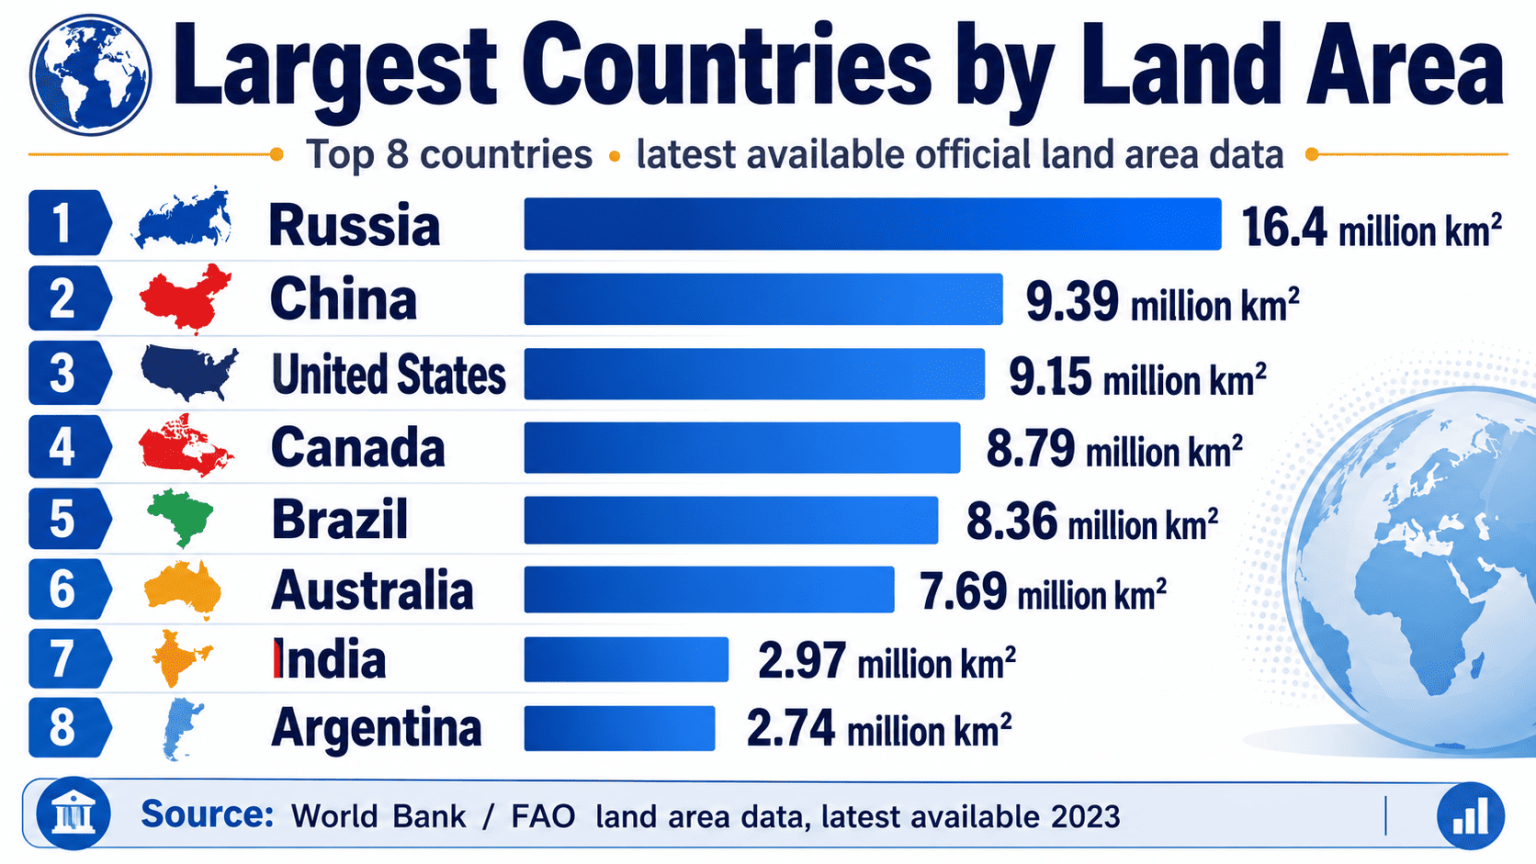
World Bank Land-Area Ranking: 100 Countries and Economies Compared
Russia ranks first in this land-area ranking, followed by China, the United States, Canada and Brazil. The metric is land area in square kilometers from World Bank WDI indicator AG.LND.TOTL.K2, with 2023 data reported through FAOSTAT / FAO.
The ranking covers the World Bank reporting universe of countries and economies, not a sovereign-states-only list. That distinction matters because the World Bank country/economy dataset includes some territories and reporting economies, while excluding regional aggregates such as World, income groups and regional totals.
Land area is not the same as total area or surface area. In this indicator, land area excludes inland water bodies, national claims to the continental shelf and exclusive economic zones. A country can therefore appear in a different order here than in total-area rankings that include lakes, rivers or other inland waters.
Use this page as a comparable land-only ranking. Larger land area ranks higher, and every entry uses the same World Bank indicator, unit and 2023 data year.
Russian Federation ranks first in the 2023 World Bank land-area data.
Benin is the final entry on this Top 100 page; it is not the smallest country or economy in the world.
World Bank countries and economies with land-area data; regional aggregates are excluded.
Square kilometers from WDI indicator AG.LND.TOTL.K2, based on FAOSTAT / FAO-reported data.
Overview: how to read the land-area ranking
This ranking answers a narrow geographic question: which World Bank countries and economies have the largest land area under one consistent definition. It is useful for school research, country profiles and quick geography comparisons.
The key limitation is the word “land.” World Bank land area excludes inland water bodies such as major lakes and rivers, and it also excludes maritime zones such as exclusive economic zones. Surface-area or total-area lists can therefore produce a different order, especially for countries with large inland-water areas.
Greenland needs special care when reading the table. It appears because the World Bank reports countries and economies, not only sovereign states. Its value can look much lower than familiar atlas-style total-area figures because this page uses the World Bank land-area indicator, not a general total-area measure.
Countries differ because of continental-scale territory, historical borders, large desert or tundra regions, inland-water exclusions and the way international datasets classify countries, economies and territories. The ranking does not judge sovereignty, political status, usable land, population density or economic power.
Top 10 largest countries and economies by land area
The Top 10 is dominated by continental-scale entries. Russia is far ahead of every other entry in this land-area measure, while China, the United States, Canada and Brazil form the next group above eight million square kilometers.
Canada is below China and the United States here because this is a land-area table, not a total-area table. Rankings that include inland water can put Canada in a different position, so the metric must be checked before comparing this page with other geography lists.
Top 10 by land area, World Bank WDI AG.LND.TOTL.K2, 2023
| Rank | Entity | Value | Region / note |
|---|---|---|---|
| 1 | Russian Federation | 16.377M sq km | Europe & Central Asia; 2023 WDI land area. |
| 2 | China | 9.388M sq km | East Asia & Pacific; 2023 WDI land area. |
| 3 | United States | 9.147M sq km | North America; 2023 WDI land area. |
| 4 | Canada | 8.789M sq km | North America; 2023 WDI land area. |
| 5 | Brazil | 8.358M sq km | Latin America & Caribbean; 2023 WDI land area. |
| 6 | Australia | 7.692M sq km | East Asia & Pacific; 2023 WDI land area. |
| 7 | India | 2.973M sq km | South Asia; 2023 WDI land area. |
| 8 | Argentina | 2.737M sq km | Latin America & Caribbean; 2023 WDI land area. |
| 9 | Kazakhstan | 2.700M sq km | Europe & Central Asia; 2023 WDI land area. |
| 10 | Algeria | 2.382M sq km | Middle East & North Africa; 2023 WDI land area. |
Values are rounded for display where needed. Ranking is calculated from the underlying square-kilometer value, descending.
Chart: Top 20 land-area entries
The horizontal bars use the same values as the ranking table. Russia is set to 100%, and every other bar is scaled against Russia’s 16.377 million square kilometers of World Bank land area.
Methodology: World Bank WDI land area indicator AG.LND.TOTL.K2
The metric is World Bank World Development Indicators series AG.LND.TOTL.K2: land area in square kilometers. The page uses the 2023 data year because it is the latest complete year available for this indicator in the dataset used for the 2026 page.
Metric and unit
Metric: land area. Unit: square kilometers. The definition excludes inland water bodies, continental shelf claims and exclusive economic zones.
Ranking direction
Descending order is used. Larger land area ranks higher. Rank is calculated from the numeric WDI value, not from the rounded display label.
Coverage and exclusions
The table includes the Top 100 World Bank countries and economies with numeric land-area values. Regional aggregates are excluded.
Data sources
Ranking values come from World Bank WDI indicator AG.LND.TOTL.K2, which cites FAOSTAT / FAO as the underlying data source. Supporting sources are used for definitions and context.
Display method: land area is shown in square kilometers. Values above one million square kilometers are also displayed in millions of square kilometers and rounded to three decimals for readability. The 2026 label describes the page snapshot, not a new measurement year.
Missing values and conflicts: entries without a numeric World Bank land-area value are not included. The ranking does not average competing geography sources. If national, atlas or encyclopedia figures differ, this page follows the World Bank / FAOSTAT land-area definition for comparability.
What the metric does not measure: land area is not total area, surface area, inland water area, maritime area, exclusive economic zone, population density, habitable land, agricultural land, forest land, economic output, geopolitical influence or resource endowment. Variations across sources can reflect definitions and reporting conventions rather than physical changes in territory.
Main ranking: Top 100 countries and economies by land area
Use the controls to search by country or economy, filter by World Bank region, sort values, or switch between Top 10, Top 20 and the full Top 100.
Top 100 by land area, World Bank WDI indicator AG.LND.TOTL.K2, 2023
Showing all 100 entries before filtering.
| Rank | Entity | Value | Region / note |
|---|---|---|---|
| 1 | Russian Federation | 16.377M sq km | Europe & Central Asia; 2023 WDI land area. |
| 2 | China | 9.388M sq km | East Asia & Pacific; 2023 WDI land area. |
| 3 | United States | 9.147M sq km | North America; 2023 WDI land area. |
| 4 | Canada | 8.789M sq km | North America; 2023 WDI land area. |
| 5 | Brazil | 8.358M sq km | Latin America & Caribbean; 2023 WDI land area. |
| 6 | Australia | 7.692M sq km | East Asia & Pacific; 2023 WDI land area. |
| 7 | India | 2.973M sq km | South Asia; 2023 WDI land area. |
| 8 | Argentina | 2.737M sq km | Latin America & Caribbean; 2023 WDI land area. |
| 9 | Kazakhstan | 2.700M sq km | Europe & Central Asia; 2023 WDI land area. |
| 10 | Algeria | 2.382M sq km | Middle East & North Africa; 2023 WDI land area. |
| 11 | Congo, Dem. Rep. | 2.267M sq km | Sub-Saharan Africa; 2023 WDI land area. |
| 12 | Saudi Arabia | 2.150M sq km | Middle East & North Africa; 2023 WDI land area. |
| 13 | Mexico | 1.944M sq km | Latin America & Caribbean; 2023 WDI land area. |
| 14 | Indonesia | 1.893M sq km | East Asia & Pacific; 2023 WDI land area. |
| 15 | Sudan | 1.868M sq km | Sub-Saharan Africa; 2023 WDI land area. |
| 16 | Libya | 1.760M sq km | Middle East & North Africa; 2023 WDI land area. |
| 17 | Iran, Islamic Rep. | 1.623M sq km | Middle East & North Africa; 2023 WDI land area. |
| 18 | Mongolia | 1.558M sq km | East Asia & Pacific; 2023 WDI land area. |
| 19 | Peru | 1.280M sq km | Latin America & Caribbean; 2023 WDI land area. |
| 20 | Niger | 1.267M sq km | Sub-Saharan Africa; 2023 WDI land area. |
| 21 | Chad | 1.259M sq km | Sub-Saharan Africa; 2023 WDI land area. |
| 22 | Angola | 1.247M sq km | Sub-Saharan Africa; 2023 WDI land area. |
| 23 | Mali | 1.220M sq km | Sub-Saharan Africa; 2023 WDI land area. |
| 24 | South Africa | 1.213M sq km | Sub-Saharan Africa; 2023 WDI land area. |
| 25 | Ethiopia | 1.128M sq km | Sub-Saharan Africa; 2023 WDI land area. |
| 26 | Colombia | 1.109M sq km | Latin America & Caribbean; 2023 WDI land area. |
| 27 | Bolivia | 1.083M sq km | Latin America & Caribbean; 2023 WDI land area. |
| 28 | Mauritania | 1.031M sq km | Sub-Saharan Africa; 2023 WDI land area. |
| 29 | Egypt, Arab Rep. | 995,450 sq km | Middle East & North Africa; 2023 WDI land area. |
| 30 | Nigeria | 910,770 sq km | Sub-Saharan Africa; 2023 WDI land area. |
| 31 | Tanzania | 885,800 sq km | Sub-Saharan Africa; 2023 WDI land area. |
| 32 | Venezuela, RB | 882,050 sq km | Latin America & Caribbean; 2023 WDI land area. |
| 33 | Namibia | 823,290 sq km | Sub-Saharan Africa; 2023 WDI land area. |
| 34 | Mozambique | 786,380 sq km | Sub-Saharan Africa; 2023 WDI land area. |
| 35 | Pakistan | 770,880 sq km | South Asia; 2023 WDI land area. |
| 36 | Turkiye | 769,630 sq km | Europe & Central Asia; 2023 WDI land area. |
| 37 | Zambia | 743,390 sq km | Sub-Saharan Africa; 2023 WDI land area. |
| 38 | Chile | 742,831.6 sq km | Latin America & Caribbean; 2023 WDI land area. |
| 39 | Myanmar | 652,670 sq km | East Asia & Pacific; 2023 WDI land area. |
| 40 | Afghanistan | 652,230 sq km | South Asia; 2023 WDI land area. |
| 41 | South Sudan | 631,930 sq km | Sub-Saharan Africa; 2023 WDI land area. |
| 42 | Somalia | 627,340 sq km | Sub-Saharan Africa; 2023 WDI land area. |
| 43 | Central African Republic | 622,980 sq km | Sub-Saharan Africa; 2023 WDI land area. |
| 44 | Madagascar | 581,795 sq km | Sub-Saharan Africa; 2023 WDI land area. |
| 45 | Kenya | 580,876.3 sq km | Sub-Saharan Africa; 2023 WDI land area. |
| 46 | Ukraine | 579,400 sq km | Europe & Central Asia; 2023 WDI land area. |
| 47 | Botswana | 566,730 sq km | Sub-Saharan Africa; 2023 WDI land area. |
| 48 | France | 538,950 sq km | Europe & Central Asia; 2023 WDI land area. |
| 49 | Yemen, Rep. | 527,970 sq km | Middle East & North Africa; 2023 WDI land area. |
| 50 | Thailand | 510,890 sq km | East Asia & Pacific; 2023 WDI land area. |
| 51 | Spain | 499,700 sq km | Europe & Central Asia; 2023 WDI land area. |
| 52 | Cameroon | 472,710 sq km | Sub-Saharan Africa; 2023 WDI land area. |
| 53 | Turkmenistan | 469,930 sq km | Europe & Central Asia; 2023 WDI land area. |
| 54 | Papua New Guinea | 452,860 sq km | East Asia & Pacific; 2023 WDI land area. |
| 55 | Morocco | 446,300 sq km | Middle East & North Africa; 2023 WDI land area. |
| 56 | Uzbekistan | 440,650 sq km | Europe & Central Asia; 2023 WDI land area. |
| 57 | Iraq | 434,130 sq km | Middle East & North Africa; 2023 WDI land area. |
| 58 | Greenland | 410,450 sq km | Europe & Central Asia; 2023 WDI land area. |
| 59 | Sweden | 407,270 sq km | Europe & Central Asia; 2023 WDI land area. |
| 60 | Paraguay | 396,012.0 sq km | Latin America & Caribbean; 2023 WDI land area. |
| 61 | Zimbabwe | 386,850 sq km | Sub-Saharan Africa; 2023 WDI land area. |
| 62 | Japan | 364,569.3 sq km | East Asia & Pacific; 2023 WDI land area. |
| 63 | Norway | 364,270 sq km | Europe & Central Asia; 2023 WDI land area. |
| 64 | Germany | 349,430 sq km | Europe & Central Asia; 2023 WDI land area. |
| 65 | Congo, Rep. | 341,500 sq km | Sub-Saharan Africa; 2023 WDI land area. |
| 66 | Malaysia | 328,550 sq km | East Asia & Pacific; 2023 WDI land area. |
| 67 | Cote d'Ivoire | 318,000 sq km | Sub-Saharan Africa; 2023 WDI land area. |
| 68 | Viet Nam | 313,429 sq km | East Asia & Pacific; 2023 WDI land area. |
| 69 | Oman | 309,500 sq km | Middle East & North Africa; 2023 WDI land area. |
| 70 | Poland | 306,270 sq km | Europe & Central Asia; 2023 WDI land area. |
| 71 | Finland | 303,960 sq km | Europe & Central Asia; 2023 WDI land area. |
| 72 | Philippines | 298,170 sq km | East Asia & Pacific; 2023 WDI land area. |
| 73 | Italy | 295,720 sq km | Europe & Central Asia; 2023 WDI land area. |
| 74 | Burkina Faso | 273,600 sq km | Sub-Saharan Africa; 2023 WDI land area. |
| 75 | New Zealand | 263,310 sq km | East Asia & Pacific; 2023 WDI land area. |
| 76 | Gabon | 257,670 sq km | Sub-Saharan Africa; 2023 WDI land area. |
| 77 | Ecuador | 248,360 sq km | Latin America & Caribbean; 2023 WDI land area. |
| 78 | Guinea | 245,720 sq km | Sub-Saharan Africa; 2023 WDI land area. |
| 79 | United Kingdom | 241,930 sq km | Europe & Central Asia; 2023 WDI land area. |
| 80 | Lao PDR | 230,800 sq km | East Asia & Pacific; 2023 WDI land area. |
| 81 | Romania | 230,080 sq km | Europe & Central Asia; 2023 WDI land area. |
| 82 | Ghana | 227,533 sq km | Sub-Saharan Africa; 2023 WDI land area. |
| 83 | Guyana | 211,140 sq km | Latin America & Caribbean; 2023 WDI land area. |
| 84 | Belarus | 202,983 sq km | Europe & Central Asia; 2023 WDI land area. |
| 85 | Uganda | 200,520 sq km | Sub-Saharan Africa; 2023 WDI land area. |
| 86 | Senegal | 192,530 sq km | Sub-Saharan Africa; 2023 WDI land area. |
| 87 | Kyrgyz Republic | 191,800 sq km | Europe & Central Asia; 2023 WDI land area. |
| 88 | Syrian Arab Republic | 183,630 sq km | Middle East & North Africa; 2023 WDI land area. |
| 89 | Cambodia | 176,520 sq km | East Asia & Pacific; 2023 WDI land area. |
| 90 | Uruguay | 175,020 sq km | Latin America & Caribbean; 2023 WDI land area. |
| 91 | Suriname | 160,510 sq km | Latin America & Caribbean; 2023 WDI land area. |
| 92 | Tunisia | 155,360 sq km | Middle East & North Africa; 2023 WDI land area. |
| 93 | Nepal | 143,350 sq km | South Asia; 2023 WDI land area. |
| 94 | Tajikistan | 138,790 sq km | Europe & Central Asia; 2023 WDI land area. |
| 95 | Bangladesh | 129,980 sq km | South Asia; 2023 WDI land area. |
| 96 | Greece | 128,900 sq km | Europe & Central Asia; 2023 WDI land area. |
| 97 | Eritrea | 121,178.2 sq km | Sub-Saharan Africa; 2023 WDI land area. |
| 98 | Korea, Dem. People's Rep. | 120,410 sq km | East Asia & Pacific; 2023 WDI land area. |
| 99 | Nicaragua | 120,340 sq km | Latin America & Caribbean; 2023 WDI land area. |
| 100 | Benin | 112,760 sq km | Sub-Saharan Africa; 2023 WDI land area. |
Dataset note: World Bank WDI land area, 2023. Values are rounded for display after the ranking is calculated.
Insights: why land-area rankings differ across countries and sources
Key insight
The ranking is heavily top-weighted. Russia’s land area is larger than any other single entry and is about 1.7 times China’s land area in this World Bank / FAOSTAT measure.
Notable pattern
Large land area does not require a large population. Canada, Kazakhstan, Algeria, Saudi Arabia, Libya, Mongolia and Mauritania rank high because they cover vast physical territory, not because they have the largest populations.
Regional concentration
Sub-Saharan Africa has 32 entries in the Top 100, more than any other region in this table. Europe & Central Asia follows with 21 entries, partly because the World Bank region includes very large Eurasian states.
Outlier
Greenland ranks 58th because this is a World Bank country/economy dataset and because the table uses the WDI land-area value, not a general total-area figure from an atlas or encyclopedia.
What this ranking means for readers
How to read it
Read the table as a standardized land-only ranking. A higher rank means more land area under the World Bank definition, not more population, more wealth or more usable land.
Land area vs total area
Land area excludes inland water bodies. Total or surface area can include inland water, so country order can change when another metric is used.
Countries and economies
The coverage follows the World Bank country/economy list. That improves comparability, but it is not the same as a list of only sovereign UN member states.
Best use case
This ranking is best for education, geography comparisons and country profile content where a consistent land-area metric is needed.
Download the Largest Countries by Land Area 2026: Top 100 Ranking dataset
Largest Countries by Land Area 2026: Top 100 Ranking
100 ranked entries · Excel + CSV + methodology + sources + chart · Snapshot: 2023 WDI / 2026 snapshot · Version 1.0
No signup required. The archive includes machine-readable data, methodology and source documentation. Quick human verification is required before the ZIP is delivered.
Download Excel + CSV Data PackFAQ
What is the largest country or economy by land area in this ranking?
The Russian Federation ranks first, with 16.377 million square kilometers of land area in the World Bank WDI / FAOSTAT 2023 value.
Are these 2026 land-area figures?
No. The data year is 2023. The 2026 label means the page is a 2026 snapshot using the latest available World Bank land-area dataset.
Is land area the same as total area or surface area?
No. Land area excludes inland water bodies, continental shelf claims and exclusive economic zones. Surface or total area can include inland water, so rankings may differ.
Why is Canada below China and the United States here?
This page ranks land area only. Canada has very large inland-water areas, so it can rank differently in total-area or surface-area lists that include inland water.
Does the ranking include territories or economies?
Yes, where they appear in the World Bank country/economy reporting universe and have numeric values. The page is not limited to sovereign states only.
Why is Greenland included, and why does its value look low?
Greenland appears because the World Bank reports countries and economies. The value shown is the WDI / FAOSTAT land-area value for this indicator, not a general encyclopedia total-area figure.
Does the ranking include oceans, EEZs or maritime zones?
No. Exclusive economic zones, maritime claims and continental shelf claims are outside this land-area metric.
Why can land-area values differ from other geography websites?
Sources may use land area, total area, surface area or different territorial conventions. This table follows World Bank WDI indicator AG.LND.TOTL.K2 for comparability.
Does land area show how much land is usable?
No. Land area does not show how much land is arable, forested, urbanized, habitable, mountainous, desert, protected or economically productive.
Sources
Primary numeric source: World Bank Data — Land area (sq. km)
Primary data source for WDI indicator AG.LND.TOTL.K2 and the 2023 country/economy values used in the ranking.
Definition source: World Bank DataBank Metadata Glossary
Used for the land-area definition, including exclusions for inland water bodies, continental shelf claims and exclusive economic zones.
https://databank.worldbank.org/metadataglossary/world-development-indicators/series/AG.LND.TOTL.K2
Original FAOSTAT source: FAO Land Use dataset
Original FAOSTAT / FAO data environment cited by the World Bank for the land-area series.
Supporting cross-check: Our World in Data — Land area in square kilometres
Supporting cross-check and metadata context for the same FAO via World Bank land-area series; not used to override the WDI ranking values.
Related rankings
Closely related StatRanker pages selected by topic. If no strong match exists, fewer links are shown instead of unrelated recommendations.
