

Top 100 Countries by Threatened Mammal and Bird Species Count, 2026 Snapshot
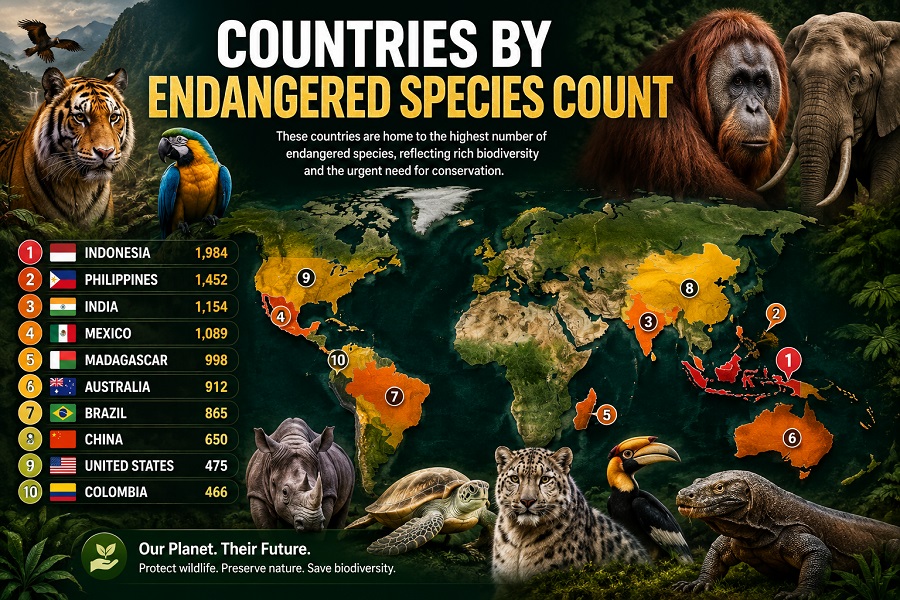
Countries and Economies with the Highest Threatened Mammal and Bird Counts
Indonesia ranks first with 373 threatened mammal and bird species, followed by Brazil with 252, India with 191, China with 172 and Madagascar with 170. The combined indicator adds two World Bank WDI series derived from the IUCN Red List and UNEP-WCMC.
The 2026 label describes the publication snapshot. The underlying country observations used here are the latest WDI values available for the two component series, generally 2022. “Threatened” refers to species assessed as Vulnerable, Endangered or Critically Endangered. Fish, plants, reptiles, amphibians, insects and other taxa are not included.
Indonesia has the highest combined count of threatened mammals and birds.
Continue exploring
More StatRanker rankings on climate, environment, resources and sustainability.
Top 100 Countries by Threatened Mammals and Birds
Open rankingTop 100 Countries by Bird Species Richness, 2026
Open rankingTop 100 Countries by Mammal Species Richness, 2026
Open rankingAll rows are written directly in the HTML table and remain visible without JavaScript.
The snapshot uses the latest available WDI country values for both component series.
The metric excludes fish, plants, reptiles, amphibians, fungi and invertebrates.
What the ranking measures
The ranking measures the absolute number of threatened mammal and bird species recorded for each country or economy in comparable international data. The combined score is calculated as threatened mammals plus threatened birds. It is not normalized by land area, population, number of assessed species or total biodiversity richness.
A high count can signal a heavy conservation workload, but it can also reflect very high biodiversity, island endemism, large tropical habitats, wider species ranges or stronger assessment coverage. The ranking is therefore a workload and exposure indicator, not a simple grade for national environmental policy.
Top 10 countries and economies by threatened mammals and birds
The upper group is dominated by megadiverse tropical countries. Indonesia is a clear outlier because both its threatened mammal and threatened bird counts are high. Brazil, India, China, Madagascar, Colombia and Mexico form the next tier, with large species pools and major pressure on forests, wetlands, mountain systems or endemic island fauna.
| Rank | Country / economy | Threatened mammals + birds | Region |
|---|---|---|---|
| 1 | Indonesia | 373 | Asia |
| 2 | Brazil | 252 | Americas |
| 3 | India | 191 | Asia |
| 4 | China | 172 | Asia |
| 5 | Madagascar | 170 | Africa |
| 6 | Colombia | 165 | Americas |
| 7 | Mexico | 165 | Americas |
| 8 | Malaysia | 147 | Asia |
| 9 | Peru | 144 | Americas |
| 10 | Australia | 135 | Oceania |
Ecuador also records 135 in the full table and sits immediately after Australia. Sequential row ranks are used for a compact Top 100 display.
Chart: highest threatened mammal and bird counts
Indonesia’s combined count is almost 50% higher than Brazil’s and nearly twice the level of India. After the first two positions, the upper tail becomes tighter, with India, China, Madagascar, Colombia and Mexico clustered between 165 and 191.
Methodology
The ranking uses two World Bank World Development Indicators: EN.MAM.THRD.NO for threatened mammal species and EN.BIR.THRD.NO for threatened bird species. The combined count is calculated as threatened mammals plus threatened birds for each country or economy.
The 2026 page label is a publication snapshot, not a new 2026 measurement year. The WDI indicator pages show a 2017–2022 data range, and the country values used here are the latest available observations, generally 2022. Values are whole-species counts and are not adjusted for population, land area, total assessed species, endemic species share or national biodiversity richness.
The indicator is intentionally narrow. It excludes fish, reptiles, amphibians, plants, fungi, insects and other invertebrates. Bird values can include species within breeding or wintering ranges, so cross-country comparison is affected by species ranges, assessment coverage, monitoring intensity and ecological geography. A high score should be read as a larger conservation workload, not as a standalone environmental performance grade.
Full ranking: Top 100 countries and economies by threatened mammals and birds
The table can be searched, filtered by region and reordered without changing the underlying WDI-based combined count. All rows are present in the HTML source; JavaScript only changes the visible order or subset.
| Rank | Country / economy | Threatened mammals + birds | Region |
|---|---|---|---|
| 1 | Indonesia | 373 | Asia |
| 2 | Brazil | 252 | Americas |
| 3 | India | 191 | Asia |
| 4 | China | 172 | Asia |
| 5 | Madagascar | 170 | Africa |
| 6 | Colombia | 165 | Americas |
| 7 | Mexico | 165 | Americas |
| 8 | Malaysia | 147 | Asia |
| 9 | Peru | 144 | Americas |
| 10 | Australia | 135 | Oceania |
| 11 | Ecuador | 135 | Americas |
| 12 | Philippines | 133 | Asia |
| 13 | Thailand | 130 | Asia |
| 14 | United States | 130 | Americas |
| 15 | Viet Nam | 114 | Asia |
| 16 | Myanmar | 111 | Asia |
| 17 | Argentina | 93 | Americas |
| 18 | Russian Federation | 91 | Europe |
| 19 | Tanzania | 91 | Africa |
| 20 | Papua New Guinea | 89 | Oceania |
| 21 | Congo, Dem. Rep. | 88 | Africa |
| 22 | South Africa | 87 | Africa |
| 23 | Venezuela, RB | 80 | Americas |
| 24 | Cameroon | 79 | Africa |
| 25 | Japan | 79 | Asia |
| 26 | Lao PDR | 79 | Asia |
| 27 | Kenya | 77 | Africa |
| 28 | Brunei Darussalam | 76 | Asia |
| 29 | Cambodia | 76 | Asia |
| 30 | New Zealand | 76 | Oceania |
| 31 | Bangladesh | 75 | Asia |
| 32 | Ethiopia | 75 | Africa |
| 33 | Bolivia | 71 | Americas |
| 34 | Nepal | 68 | Asia |
| 35 | Uganda | 65 | Africa |
| 36 | Côte d’Ivoire | 60 | Africa |
| 37 | Nigeria | 58 | Africa |
| 38 | Angola | 57 | Africa |
| 39 | Pakistan | 57 | Asia |
| 40 | Guinea | 54 | Africa |
| 41 | Chile | 52 | Americas |
| 42 | Mozambique | 51 | Africa |
| 43 | Ghana | 48 | Africa |
| 44 | Namibia | 48 | Africa |
| 45 | Bhutan | 47 | Asia |
| 46 | Iran | 47 | Asia |
| 47 | Korea, Rep. | 46 | Asia |
| 48 | Sudan | 46 | Africa |
| 49 | Kazakhstan | 45 | Asia |
| 50 | Senegal | 45 | Africa |
| 51 | Solomon Islands | 45 | Oceania |
| 52 | Rwanda | 44 | Africa |
| 53 | Sri Lanka | 44 | Asia |
| 54 | Sierra Leone | 43 | Africa |
| 55 | Mauritania | 42 | Africa |
| 56 | Spain | 42 | Europe |
| 57 | Morocco | 41 | Africa |
| 58 | South Sudan | 41 | Africa |
| 59 | Canada | 40 | Americas |
| 60 | Korea, Dem. People's Rep. | 40 | Asia |
| 61 | Liberia | 40 | Africa |
| 62 | Singapore | 40 | Asia |
| 63 | Turkiye | 40 | Asia |
| 64 | Paraguay | 39 | Americas |
| 65 | Central African Republic | 38 | Africa |
| 66 | Eritrea | 38 | Africa |
| 67 | Somalia | 38 | Africa |
| 68 | Costa Rica | 37 | Americas |
| 69 | Panama | 37 | Americas |
| 70 | Chad | 36 | Africa |
| 71 | Egypt, Arab Rep. | 36 | Africa |
| 72 | Algeria | 35 | Africa |
| 73 | Guatemala | 35 | Americas |
| 74 | Israel | 35 | Asia |
| 75 | Mongolia | 35 | Asia |
| 76 | Zambia | 35 | Africa |
| 77 | Burundi | 34 | Africa |
| 78 | French Polynesia | 34 | Oceania |
| 79 | Mali | 34 | Africa |
| 80 | Syrian Arab Republic | 33 | Asia |
| 81 | France | 32 | Europe |
| 82 | Portugal | 32 | Europe |
| 83 | Romania | 32 | Europe |
| 84 | Zimbabwe | 32 | Africa |
| 85 | Greece | 31 | Europe |
| 86 | Iraq | 31 | Asia |
| 87 | Togo | 31 | Africa |
| 88 | Ukraine | 31 | Europe |
| 89 | Uruguay | 31 | Americas |
| 90 | Benin | 30 | Africa |
| 91 | Gambia, The | 30 | Africa |
| 92 | Guinea-Bissau | 30 | Africa |
| 93 | Malawi | 30 | Africa |
| 94 | Niger | 30 | Africa |
| 95 | Saudi Arabia | 30 | Asia |
| 96 | Botswana | 29 | Africa |
| 97 | Jordan | 29 | Asia |
| 98 | Tunisia | 29 | Africa |
| 99 | Uzbekistan | 29 | Asia |
| 100 | Yemen | 29 | Asia |
Source basis: World Bank WDI indicators EN.MAM.THRD.NO and EN.BIR.THRD.NO, derived from the IUCN Red List and UNEP-WCMC. The table uses latest available country observations, generally 2022. Some WDI entries are economies or territories, so the page uses “countries and economies” where precision matters.
Key patterns in the Top 100
Key Insight
Indonesia is the dominant outlier with 373 combined threatened mammal and bird species. Its island geography, forest conversion, high endemism and large species pool push the count far above every other country in the table.
Notable Pattern
The second tier is not purely Latin American. Brazil remains second, but India, China and Madagascar now sit ahead of Colombia and Mexico after calculating the table strictly from the latest WDI mammal and bird values.
Regional Concentration
Southeast Asia, tropical South America, South Asia, Sub-Saharan Africa and Oceania account for much of the upper ranking. These regions combine high species richness with habitat pressure, island vulnerability or large numbers of range-restricted species.
Outlier
The United States ranks high because the bird component is large, while Madagascar ranks high mainly because its threatened mammal count is exceptionally elevated relative to its bird count.
What it means for readers
The ranking is most useful as a conservation workload indicator. It highlights where large numbers of threatened mammal and bird species overlap with habitat fragmentation, forest conversion, hunting, invasive species, wetland loss, island vulnerability or limited ecological range.
Policymakers can use this type of ranking to prioritize protected-area quality, habitat corridors, anti-poaching enforcement, invasive-species control and long-term monitoring. Donors and researchers can use it to identify countries where species recovery programmes and field surveys may have high biodiversity value. Readers should avoid interpreting the count as a complete measure of environmental performance because it does not account for recovery progress, enforcement quality, conservation spending or total species richness.
FAQ
Which country has the highest threatened mammal and bird species count?
Indonesia ranks first with 373 threatened mammal and bird species in the combined WDI/IUCN indicator used for this table.
Does the 2026 snapshot mean the data were measured in 2026?
No. The 2026 label is the publication snapshot. The underlying WDI country observations used here are the latest available values, generally 2022.
Does this ranking cover all endangered animals?
No. The table covers threatened mammals plus threatened birds only. Fish, plants, reptiles, amphibians, insects, fungi and other taxa are outside the ranking.
Why use “threatened” instead of only “endangered”?
The IUCN Red List commonly groups Vulnerable, Endangered and Critically Endangered species as threatened. That broader grouping is more useful for measuring extinction-risk workload than the Endangered category alone.
Does a high count mean poor environmental policy?
No. A high count can reflect high biodiversity, island endemism, large tropical habitats or better assessment coverage. Policy quality requires additional indicators such as habitat loss, enforcement, protected-area quality and species recovery outcomes.
Sources
-
IUCN Red List of Threatened Species
Global framework for species extinction-risk assessment and Red List categories. -
IUCN Red List Categories and Criteria
Technical basis for Vulnerable, Endangered and Critically Endangered categories. -
World Bank WDI — Mammal species, threatened
Primary country indicator used for the threatened mammal component. -
World Bank WDI — Bird species, threatened
Primary country indicator used for the threatened bird component. -
Our World in Data — Threatened mammal species
Secondary processed reference for metadata and cross-checking the WDI/IUCN mammal indicator. -
Our World in Data — Threatened bird species
Secondary processed reference for metadata and cross-checking the WDI/IUCN bird indicator.
Related rankings
More StatRanker rankings on climate, environment, resources and sustainability.
Top 100 Countries by Threatened Plant Species, 2025
Open rankingTop 100 Countries by Bird Species Diversity, 2025
Open rankingTop 100 Countries by Wild Mammal Species Richness, 2025
Open rankingTop 100 Countries by Reptile Species Richness, 2026
Open ranking
StatRanker (Website)
administrator
