
Top 100 Countries by Public EV Chargers per
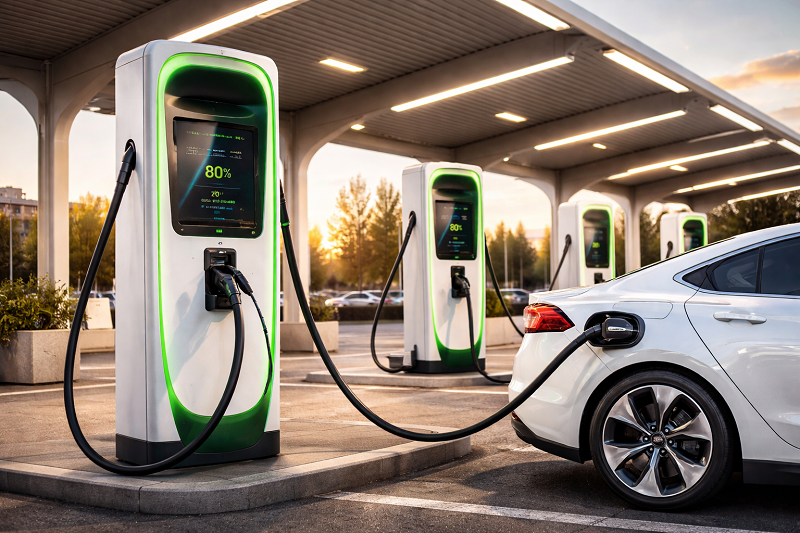
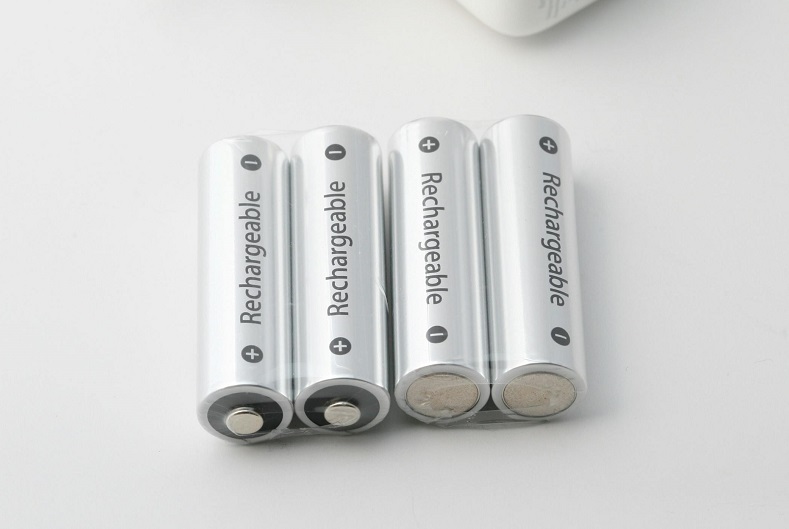
Public EV chargers per 1,000 EVs: 2025 edition This edition does not pretend to be a Top 100. It is
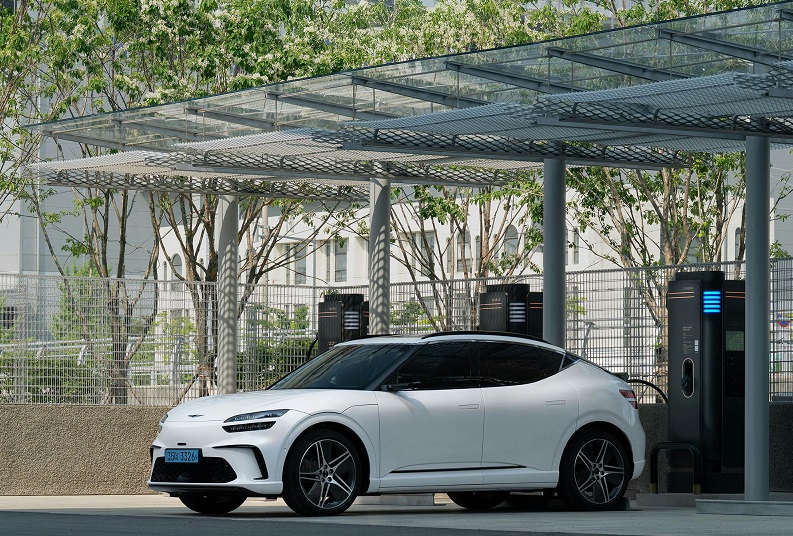
Public EV chargers per 1,000 EVs: 2025 edition This edition does not pretend to be a Top 100. It is
Public EV Chargers per 100,000 People (2025): Top-100 Density Ranking Metric: public EV charging points per 100,000 people Year: 2025.
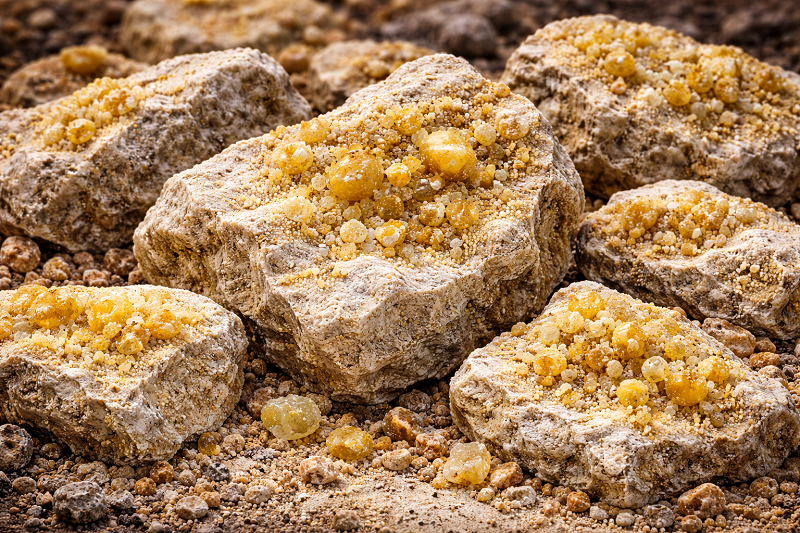
2025 Edition Snapshot: Who Mines the Most Phosphate Rock (Latest Reported Year: 2023) This ranking measures phosphate rock mine production,

Uranium mine production (tU): quick ranking snapshot for the 2025 edition Metric: uranium mine production Unit: tonnes of uranium (tU)

Top bauxite mine producers (2025 edition): the latest ranking snapshot This ranking orders countries by bauxite mine production (crude ore)

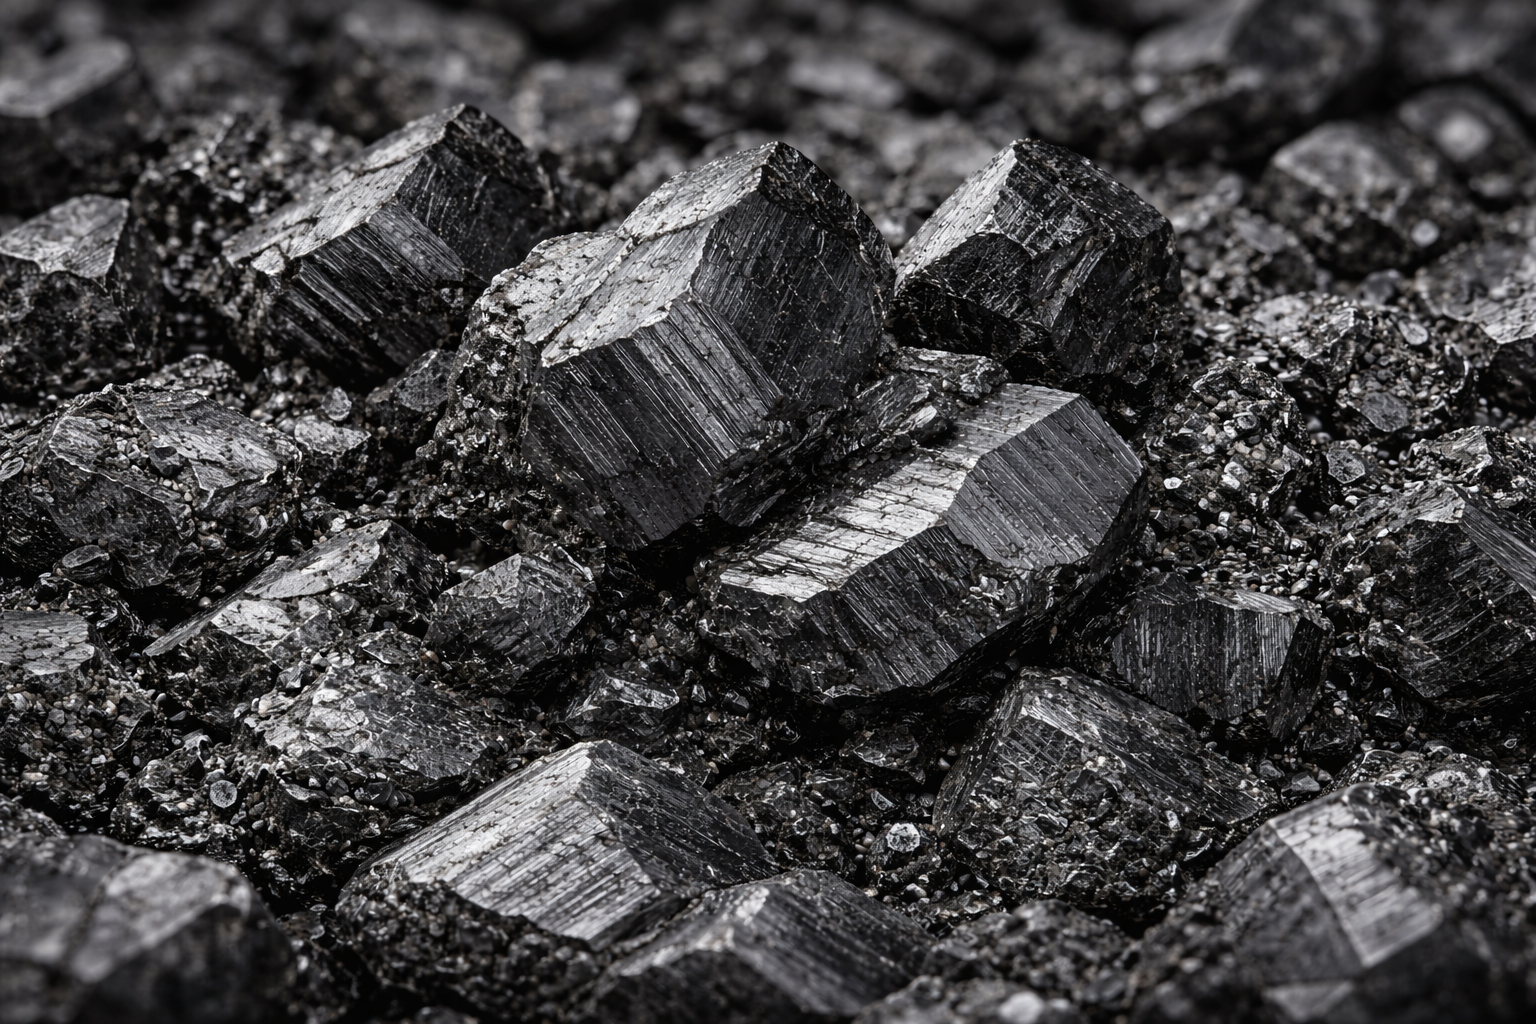
Rare Earth Mine Production in 2025: Where Output Is Concentrated (t REO) Rare earth mine production is typically reported in
This ranking summarizes natural graphite mine output by country using the latest USGS 2024e estimates. Values are shown in kilotons

Global mined cobalt supply in 2024 (estimated): who produces it, and why the ranking matters Unit: metric tons (cobalt content)

Nickel • mine production Year: 2023 Unit: tonnes (Ni metal content) Nickel mine output in 2023: the global leaders and
Critical minerals • Energy transition Lithium mine production (2023): why “mine output” is not the same as battery supply Lithium

Copper mine output: why “who digs it” matters in the 2025 electrification cycle Mine production is the amount of copper

StatRanker • Payments & Digital Economy • 2025 Beyond “cashless”: what a high digital-payments share actually signals in consumer markets

Startup Density in 2025: A Per-Capita View of Tech Ecosystems This ranking compares countries by tech startup density — the

StatRanker · Labour market structure · 2025 snapshot High-Skilled Employment as a “Knowledge Economy” Signal The high-skilled jobs share measures

R&D Intensity in 2025: Why “% of GDP” is the most comparable innovation gauge This ranking tracks R&D spending as

Education & knowledge economy • 2025 snapshot Global Top-1,000 University Footprint by Country: Where World-Ranked Institutions Concentrate Counting how many

Fixed broadband Metric: median download speed (Mbps) Reference: 2025 release (country ranking) Beyond “advertised speeds”: what the median fixed broadband

StatRanker • Digital access statistics • 2025 edition Internet penetration rate (commonly reported as “Individuals using the Internet, % of

StatRanker • Cities & Innovation Start-up Density in 2025: Why “Per 100,000 Residents” Beats Raw Totals Definition used in this

Nighttime Light Intensity in Cities: A Satellite-Based Economic Activity Proxy (2025) Index: VIIRS DNB / “Black Marble”-style NTL • Normalised

Cities · Housing · Affordability Reading the price-to-income ratio in cities (2025 snapshot) The price-to-income ratio compares a typical home
International Tourist Arrivals by City (2025) At the city level, “international arrivals” are best read as inbound travel trips linked
Urban environment • 2025 ranking Which cities offer the most green space per resident? Green space per capita expresses how

Cost of living for expats • 2025 city ranking What “cost of living for expats” means in practice (and what
Cities & Urban Life · 2025 ranking snapshot Top 100 Cities by Quality of Life, 2025 Quality of life in

This page ranks countries by the size of their commercial vehicle (CV) fleet and provides two complementary views: (1) total

Public transport access in “major-city” terms: the SDG 11.2.1 lens behind this ranking “Public transport use” is often reported as
