
Top 100 Countries by Adult Smoking Prevalence (%),
Morbidity rate · Disease incidence by type This ranking compares countries by the WHO modelled, age-standardized prevalence of current tobacco

Morbidity rate · Disease incidence by type This ranking compares countries by the WHO modelled, age-standardized prevalence of current tobacco

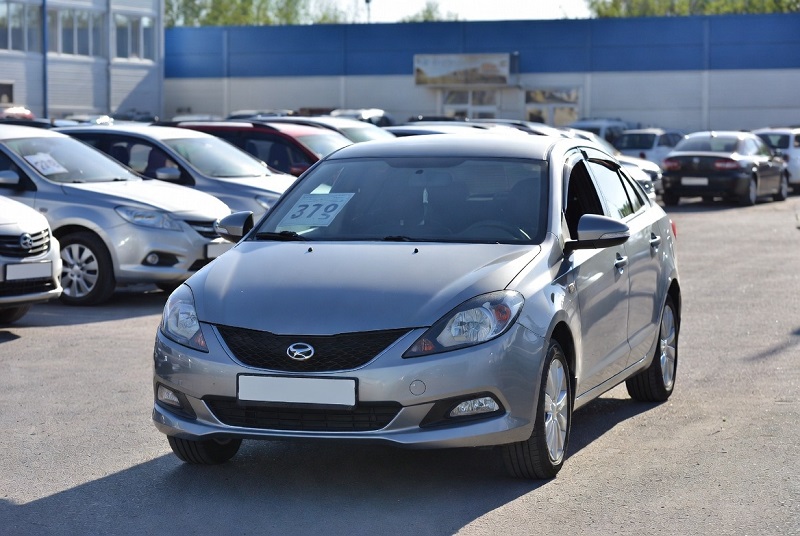
A model-level ranking of the world’s highest-volume vehicles in 2025, with a practical, publisher-friendly layout: overview, methodology, a Top 100

Primary data: WHO (SDG 3.4.2 indicator) Health context: WHO mental health estimates Coverage: 183 countries Median: 8.93 per 100k Reporting

Macroeconomics • 2025 snapshot What this ranking measures (and why it matters) Nominal GDP is the market value of all

Analytical Insights · Demographics & Human Capital Homicide rates remain one of the clearest, most comparable signals of extreme violence
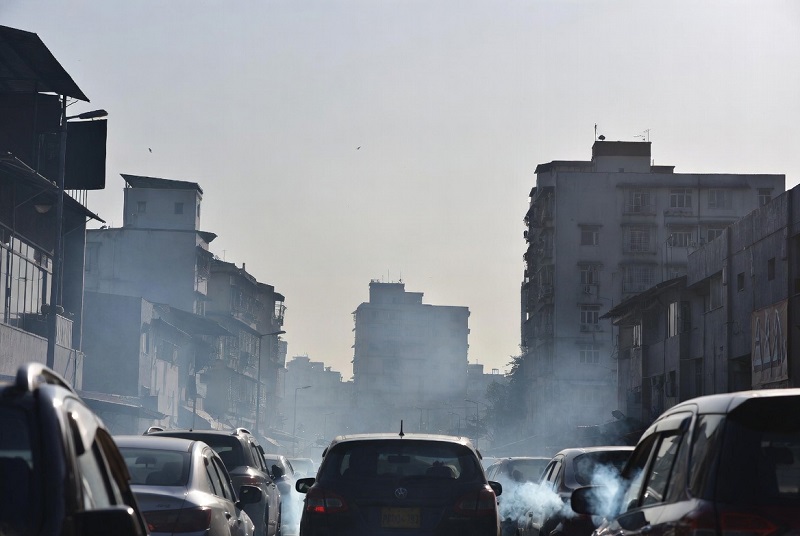
Climate, Weather & Environmental Risks PM2.5 is “fine particulate matter” — particles small enough to reach deep into the lungs.

Environment & Resources · Energy & EV Analysis “Per capita” CO₂ is one of the fastest ways to understand how

Economy & Living Standards · Wages & incomes Data refresh: loading… People often google “median household income by country” expecting
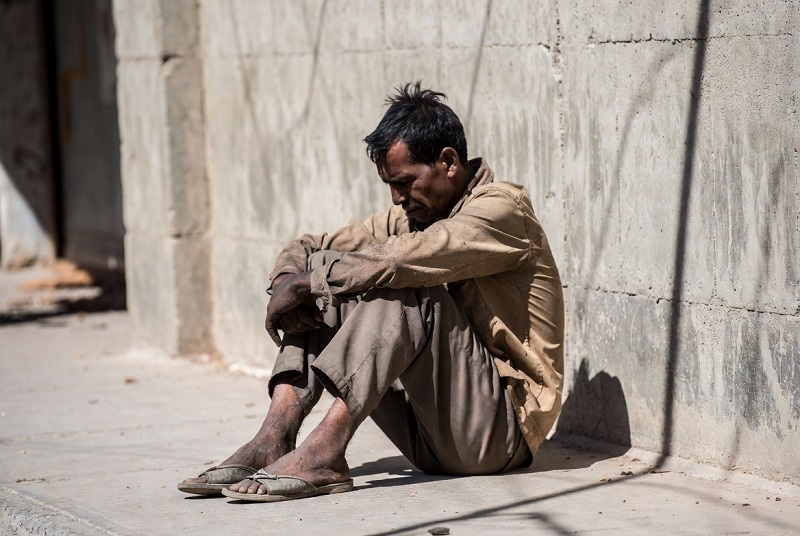
Economy & Living Standards · Global ranking (Top 100) This ranking compares poverty headcount rates across countries using the World
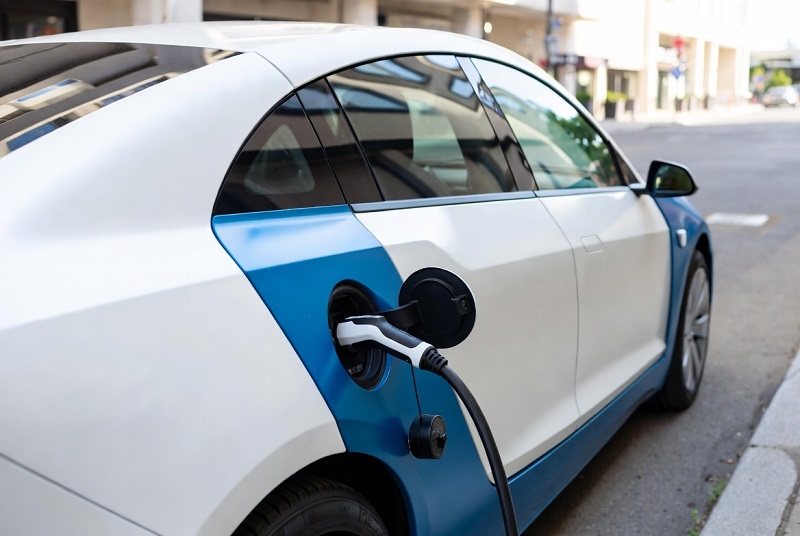
Top Electric Vehicles by Maximum Range (EPA Miles per Charge), 2025 Mobility • Rankings • 2025 Top Electric Vehicles by
StatRanker · Mobility This 2025 ranking focuses on real-world-friendly efficiency signals: EPA combined MPG for gasoline/hybrids and combined MPGe +
Mobility · Safety ranking · 2025 edition “Safest car” is not a single star rating, and it is not only

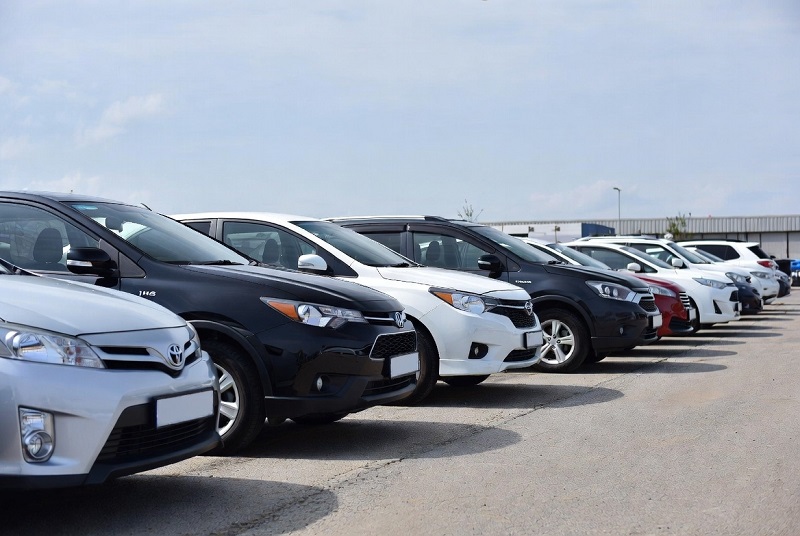
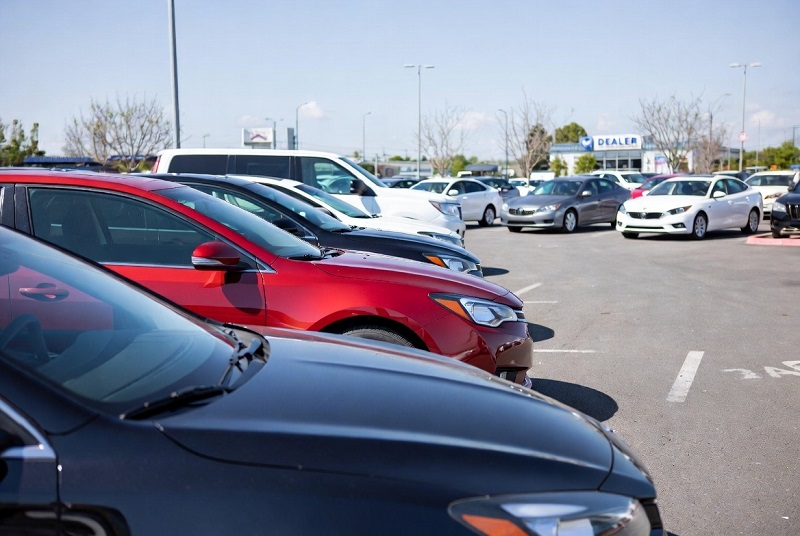
Mobility • Vehicle market “Best-selling” sounds simple until you define the unit of counting. In the U.S. market, sales leadership
“Most sold cars” sounds like a simple list. In practice it’s a measurement problem: the same badge on the trunk
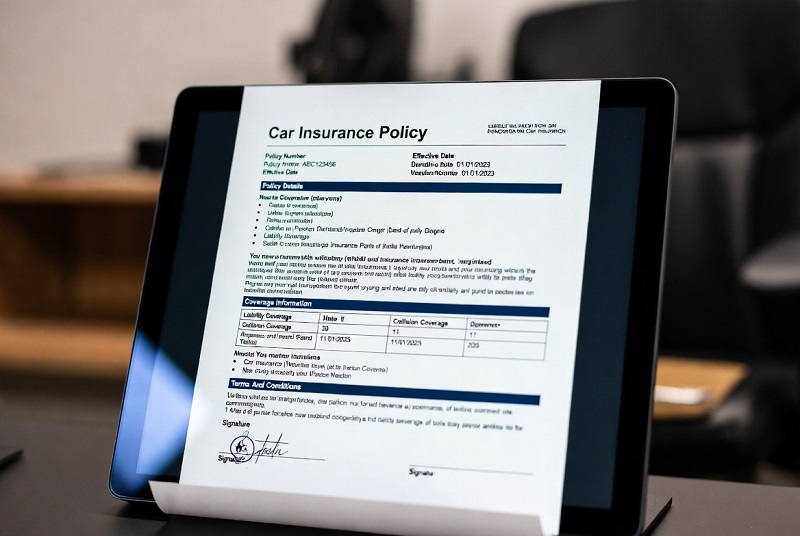
This “car insurance cost by state” ranking uses the latest NAIC state average expenditure data available at publication time. It’s

Mobility • U.S. Insurance • 2026 composite ranking Composite score (0–100) Complaints • Claims • Financial strength Coverage & UX

“Cheapest” is only meaningful if everyone is priced on the same driver profile, the same coverage limits, and the same

Telecom · Coverage · 2025 snapshot This ranking compares countries by the share of people living within the footprint of

Digital Innovation · Connectivity · Mobile broadband This ranking compares median mobile download speeds (Mbps) across countries, using a 2025
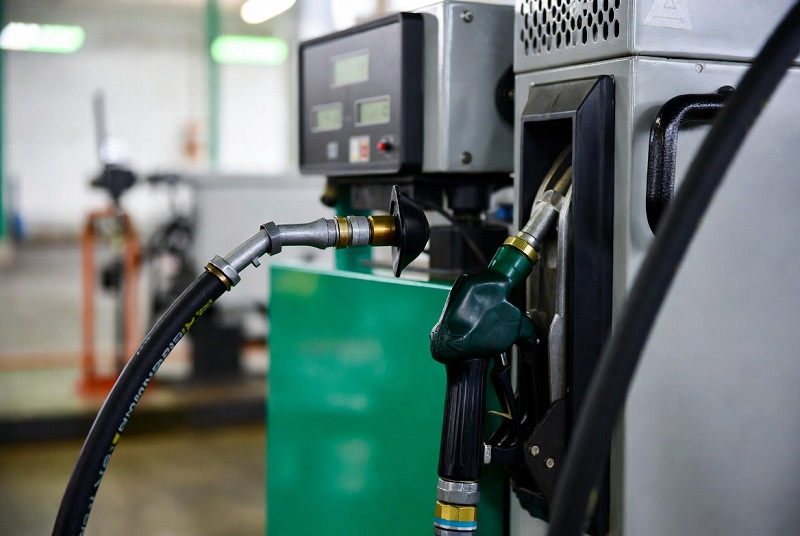
World ranking • Fuel markets Diesel is the “workhorse” fuel behind freight, agriculture, construction and public transport, so pump prices
Economy · Budget & Taxes · Country ranking The tax-to-GDP ratio (tax revenue as a share of GDP) is a

Macroeconomy • 2025 ranking This page ranks countries by general government gross debt as a share of GDP (Debt-to-GDP). It

Net salary rankings are popular because they feel “practical”: what lands in your account each month. But as a benchmark,

This page is an expanded framing of the existing “wages beat inflation” idea: same core question (did pay rises outpace

Minimum wages • Real PPP • 2025 Minimum wages are a “wage floor” policy: a statutory minimum, a collectively bargained

Wages • Purchasing Power • 2025 “Median wage (PPP)” is one of the most reader-friendly ways to compare pay across

2025 snapshot “Food inflation” is the year-over-year change in the CPI food index (typically “Food & Non-Alcoholic Beverages”). Because food
