

Where Are U.S. Bank Deposits Most Concentrated? 2026 FDIC State Analysis
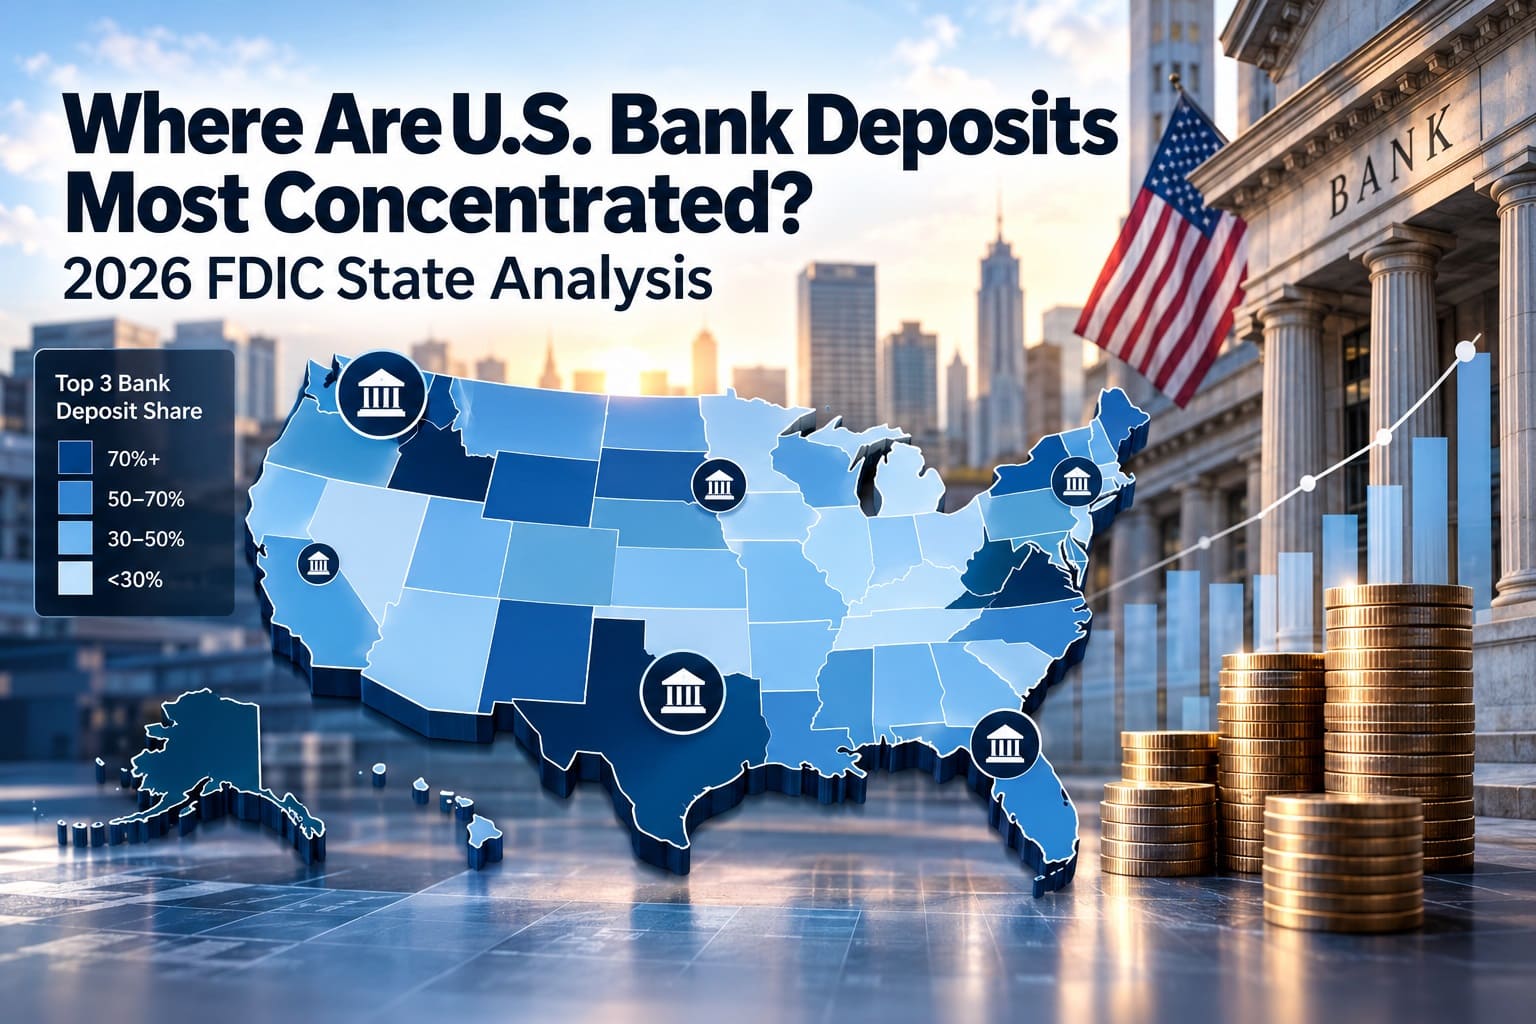
Where Are U.S. Bank Deposits Most Concentrated? 2026 FDIC State Analysis
South Dakota ranks first by the combined deposit share of its three largest bank charters, at 96.16% in the June 30, 2026 Summary of Deposits snapshot. Kansas ranks last at 18.66%, a gap of 77.50 percentage points. Delaware ranks second by CR3, while a separate six-state full-share calculation identifies Delaware's HHI at approximately 5,041.
This analysis covers 50 U.S. states and the District of Columbia (51 jurisdictions). The metric is CR3: percent of FDIC-insured bank deposits assigned to offices of the three largest individual bank charters in each jurisdiction; higher CR3 ranks higher. Ranking values are calculated_value (51) from observed industry-published top-three bank shares, not FDIC-published CR3 values. Units: percentage of state bank-office deposits and HHI index points. Source survey: June 30, 2026; research retrieval: October 28, 2026.
This is a compiled research dataset drawing on two independent publishing organizations: BankRegReports (numeric inputs) and Finantrix (independent numeric validation). The 51 sums are independently recalculated and cross-checked; row-level source and calculation notes appear in the main table. Calculated values are calculated from observed inputs, not an official forecast or projection. Official FDIC branch-level extracts were not independently reaggregated. No unverified 2025-to-2026 HHI change is claimed.
The leading two bank charters alone account for 95.51% of booked deposits.
The largest charter has 6.93% of reported bank-office deposits.
50 states plus DC; 51 calculated CR3 rows independently cross-checked.
Computed from 36 rounded bank shares; exceeds the conservative upper bound in any other jurisdiction.
Overview: CR3 shows more than the size of the largest bank
CR3 is the combined share held by the three largest distinct FDIC-insured bank charters operating offices in a state. It measures the concentration of booked deposits rather than how many residents bank with those institutions. A bank's office can book deposits belonging to customers elsewhere, so this is not a consumer-market-share or customer-location ranking.
Two independent industry datasets permit a row-by-row check of 2026 CR3. StatRanker summed the top-three 0.01-point shares from BankRegReports for all 51 jurisdictions and compared those totals to Finantrix's published 0.1-point CR3. Every difference was no more than 0.06 percentage points. That validation limits rounding-related uncertainty, but it is not an independent reaggregation of the FDIC's raw branch records.
HHI, which squares every individual charter's deposit share, measures concentration differently. It is calculated here from every listed charter for six jurisdictions; the remaining 45 show mathematically conservative intervals instead of invented precise indices. A 2025–2026 HHI trend is deliberately omitted until both years can be recalculated against current official source versions.
Top 10 states by three-bank deposit concentration, 2026
The percentages are StatRanker sums of the three largest published bank-charter shares, not a copied CR3 ranking. Higher percentages indicate more deposits booked to the largest three charters. The HHI column is either an approximate all-bank index or a conservative range, not another rank.
| Rank | State / DC | CR3 2026 | HHI 2026 | Source / method |
|---|---|---|---|---|
| 1 | South Dakota | 96.16% | 4,672–4,678 | 2026 calculated_value. BankRegReports June 30 2026: first/second/third bank shares 55.25% + 40.26% + 0.65% = 96.16% CR3. Leader: Citibank (CR1 55.25%). Finantrix independently reports CR3 96.2%; difference 0.04 percentage points, due to published rounding. 2026 HHI bound 4,672–4,678, calculated from top-three shares using the N-independent conservative method. No verified cross-year HHI comparison. |
| 2 | Delaware | 86.66% | approx. 5,041 | 2026 calculated_value. BankRegReports June 30 2026: first/second/third bank shares 69.64% + 10.67% + 6.35% = 86.66% CR3. Leader: Capital One (CR1 69.64%). Finantrix independently reports CR3 86.7%; difference 0.04 percentage points, due to published rounding. 2026 HHI approx. 5,041, derived by summing squared rounded shares of all 36 banks; full inputs in Methodology. No verified cross-year HHI comparison. |
| 3 | Alaska | 82.86% | approx. 2,730 | 2026 calculated_value. BankRegReports June 30 2026: first/second/third bank shares 42.89% + 22.26% + 17.71% = 82.86% CR3. Leader: Wells Fargo Bank (CR1 42.89%). Finantrix independently reports CR3 82.9%; difference 0.04 percentage points, due to published rounding. 2026 HHI approx. 2,730, derived by summing squared rounded shares of all 7 banks; full inputs in Methodology. No verified cross-year HHI comparison. |
| 4 | Hawaii | 79.92% | approx. 2,512 | 2026 calculated_value. BankRegReports June 30 2026: first/second/third bank shares 34.26% + 31.24% + 14.42% = 79.92% CR3. Leader: Bank of Hawaii (CR1 34.26%). Finantrix independently reports CR3 79.9%; difference 0.02 percentage points, due to published rounding. 2026 HHI approx. 2,512, derived by summing squared rounded shares of all 13 banks; full inputs in Methodology. No verified cross-year HHI comparison. |
| 5 | North Carolina | 74.14% | 2,384–2,721 | 2026 calculated_value. BankRegReports June 30 2026: first/second/third bank shares 43.80% + 16.92% + 13.42% = 74.14% CR3. Leader: Bank of America (CR1 43.80%). Finantrix independently reports CR3 74.1%; difference 0.04 percentage points, due to published rounding. 2026 HHI bound 2,384–2,721, calculated from top-three shares using the N-independent conservative method. No verified cross-year HHI comparison. |
| 6 | Rhode Island | 69.06% | approx. 2,018 | 2026 calculated_value. BankRegReports June 30 2026: first/second/third bank shares 35.73% + 21.69% + 11.64% = 69.06% CR3. Leader: Citizens Bank (CR1 35.73%). Finantrix independently reports CR3 69.1%; difference 0.04 percentage points, due to published rounding. 2026 HHI approx. 2,018, derived by summing squared rounded shares of all 17 banks; full inputs in Methodology. No verified cross-year HHI comparison. |
| 7 | Massachusetts | 62.26% | 1,732–2,074 | 2026 calculated_value. BankRegReports June 30 2026: first/second/third bank shares 37.51% + 15.56% + 9.19% = 62.26% CR3. Leader: State Street Bank and Trust Company (CR1 37.51%). Finantrix independently reports CR3 62.3%; difference 0.04 percentage points, due to published rounding. 2026 HHI bound 1,732–2,074, calculated from top-three shares using the N-independent conservative method. No verified cross-year HHI comparison. |
| 8 | Arizona | 61.24% | 1,267–1,870 | 2026 calculated_value. BankRegReports June 30 2026: first/second/third bank shares 22.60% + 21.65% + 16.99% = 61.24% CR3. Leader: Western Alliance Bank (CR1 22.60%). Finantrix independently reports CR3 61.2%; difference 0.04 percentage points, due to published rounding. 2026 HHI bound 1,267–1,870, calculated from top-three shares using the N-independent conservative method. No verified cross-year HHI comparison. |
| 9 | District of Columbia | 59.17% | 1,251–1,804 | 2026 calculated_value. BankRegReports June 30 2026: first/second/third bank shares 26.53% + 19.10% + 13.54% = 59.17% CR3. Leader: Bank of America (CR1 26.53%). Finantrix independently reports CR3 59.2%; difference 0.03 percentage points, due to published rounding. 2026 HHI bound 1,251–1,804, calculated from top-three shares using the N-independent conservative method. No verified cross-year HHI comparison. |
| 10 | Minnesota | 58.88% | 1,492–1,788 | 2026 calculated_value. BankRegReports June 30 2026: first/second/third bank shares 33.32% + 18.07% + 7.49% = 58.88% CR3. Leader: U.S. Bank (CR1 33.32%). Finantrix independently reports CR3 58.9%; difference 0.02 percentage points, due to published rounding. 2026 HHI bound 1,492–1,788, calculated from top-three shares using the N-independent conservative method. No verified cross-year HHI comparison. |
CR3 = sum of three shares reported to 0.01 percentage points; display precision is not equivalent to precision from original unrounded FDIC deposits. Ranks use the calculated two-decimal values.
Chart: Top 20 states by calculated 2026 CR3
The bars reproduce exactly the numeric CR3 values in the main ranking; the leader is normalized to 100% of chart width. Each label shows the share of deposits booked to the top three bank charters, not the proportion of bank customers.
Top 20 range: South Dakota 96.16% to Ohio 47.61%. Bars use values calculated from BankRegReports top-three shares, with independent Finantrix validation.
Methodology: source shares, independent validation and HHI
Metric, formula and unit
CR3 = bank charter 1 share + bank charter 2 share + bank charter 3 share. Each share is a percentage of all FDIC-insured bank deposits attributed to in-state reporting offices. CR1 = the first bank's share. Sort direction: higher CR3 first. Values are calculated from observations rounded to two decimals; no projected bank deposits or forecast values are used.
Survey, coverage and status
FDIC Summary of Deposits survey as of June 30, 2026, for 50 states plus DC. Puerto Rico, other territories and credit unions are outside this ranking. All 51 CR3 rows have calculated_value status, using three industry-observed share inputs per jurisdiction, and are not labeled FDIC official CR3 figures. Retrieval date: October 28, 2026.
Numeric versus validation roles
Numeric source: BankRegReports 2026 state pages, with one record per bank charter and market shares shown to 0.01 points. Independent validation: Finantrix Atlas, reporting 2026 CR3 to 0.1 point. Official methodology and survey dates: FDIC SOD. All 51 independently calculated CR3 values differ from Finantrix by at most 0.06 percentage points. These are two independent publishers of related industry outputs, not two official SOD extracts.
Definition and limits
One FDIC certificate is treated as one bank charter, even when multiple charters have a shared holding company. Deposits are located by reporting branch, not depositor residence. This does not measure credit-union deposits, financial-sector competition overall, bank customer counts, total institution deposits across all states, or branch accessibility. Institution counts in provider summaries can differ; no institution-count input is used in interval calculations.
HHI from all observed bank shares: six states
HHI = sum of squared charter percentage shares (range 0–10,000). Six 2026 examples are calculated from every bank listed in BankRegReports for that state, each share rounded to 0.01 percentage points. Because the inputs are rounded, these are approximate calculated values, not official FDIC-published HHIs. They use the same 2026 survey and market definitions as the CR3 figures. Expand each example to see the complete inputs and reproduce the calculation.
Delaware: 36 charters, 2026 HHI approximately 5,041
Source: BankRegReports 2026 state institution list; survey: June 30, 2026; unit: percent of state bank-office deposits. All observed charter shares (%): 69.64, 10.67, 6.35, 4.89, 2.81, 1.73, 1.04, 0.72, 0.47, 0.47, 0.31, 0.18, 0.12, 0.12, 0.10, 0.07, 0.07, 0.05, 0.04, 0.04, 0.03, 0.03, 0.02, 0.01, 0.01, 0.01, 0.00, 0.00, 0.00, 0.00, 0.00, 0.00, 0.00, 0.00, 0.00, 0.00. Sum of listed shares: 100.00%. Formula: HHI = sum of share squared = 5040.9292. Rounding uncertainty is present; this is a calculation from published rounded inputs.
Alaska: 7 charters, 2026 HHI approximately 2,730
Source: BankRegReports 2026 state institution list; survey: June 30, 2026; unit: percent of state bank-office deposits. All observed charter shares (%): 42.89, 22.26, 17.71, 6.27, 4.93, 3.16, 2.77. Sum of listed shares: 99.99%. Formula: HHI = sum of share squared = 2729.9801. Rounding uncertainty is present; this is a calculation from published rounded inputs.
Hawaii: 13 charters, 2026 HHI approximately 2,512
Source: BankRegReports 2026 state institution list; survey: June 30, 2026; unit: percent of state bank-office deposits. All observed charter shares (%): 34.26, 31.24, 14.42, 11.73, 3.58, 1.35, 0.91, 0.82, 0.56, 0.52, 0.37, 0.22, 0.02. Sum of listed shares: 100.00%. Formula: HHI = sum of share squared = 2512.1236. Rounding uncertainty is present; this is a calculation from published rounded inputs.
Rhode Island: 17 charters, 2026 HHI approximately 2,018
Source: BankRegReports 2026 state institution list; survey: June 30, 2026; unit: percent of state bank-office deposits. All observed charter shares (%): 35.73, 21.69, 11.64, 6.24, 5.89, 5.41, 4.01, 3.00, 1.52, 1.36, 1.08, 0.93, 0.65, 0.58, 0.14, 0.13, 0.01. Sum of listed shares: 100.01%. Formula: HHI = sum of share squared = 2017.5433. Rounding uncertainty is present; this is a calculation from published rounded inputs.
Vermont: 25 charters, 2026 HHI approximately 1,057
Source: BankRegReports 2026 state institution list; survey: June 30, 2026; unit: percent of state bank-office deposits. All observed charter shares (%): 20.21, 19.21, 7.89, 7.01, 5.36, 5.19, 5.14, 4.91, 4.88, 2.64, 2.61, 2.52, 1.99, 1.84, 1.80, 1.49, 1.38, 1.24, 0.79, 0.69, 0.54, 0.42, 0.16, 0.10, 0.00. Sum of listed shares: 100.01%. Formula: HHI = sum of share squared = 1056.8519. Rounding uncertainty is present; this is a calculation from published rounded inputs.
Maine: 29 charters, 2026 HHI approximately 657
Source: BankRegReports 2026 state institution list; survey: June 30, 2026; unit: percent of state bank-office deposits. All observed charter shares (%): 11.67, 11.00, 10.06, 8.15, 6.17, 5.85, 5.02, 4.98, 4.83, 4.46, 3.41, 3.12, 3.07, 2.93, 2.52, 2.19, 2.12, 2.11, 1.63, 1.56, 1.31, 0.40, 0.38, 0.32, 0.17, 0.16, 0.15, 0.15, 0.10. Sum of listed shares: 99.99%. Formula: HHI = sum of share squared = 657.1159. Rounding uncertainty is present; this is a calculation from published rounded inputs.
Conservative 2026 HHI intervals for 45 jurisdictions
The remaining jurisdictions do not have fully verified all-bank share vectors in this research. They receive a calculated lower–upper interval, not a fictitious point estimate. Let p1, p2 and p3 be the observed first, second and third shares to 0.01 percentage points. Set ε = 0.005 percentage points for each rounded share.
Each displayed range uses BankRegReports's individually published 2026 shares as inputs. Display bounds are rounded outward to whole HHI points. A range is not a measured HHI, and it is not suitable for a precise year-on-year change calculation.
Cross-source checks, conflicts and historical-data control
All 51 BankRegReports CR3 sums were independently checked against the Finantrix 2026 CR3 list. The maximum absolute difference is 0.06 percentage points, consistent with the two publishers' different display precision. No conflicting figures were averaged. Published institution counts vary on some state overview and detailed pages (notably California, New York and Texas); those counts were excluded from every calculation. Exact 2026 FDIC SOD branch-level aggregation was unavailable for this version, and that limitation is disclosed explicitly.
2025 HHI data are not used for historical comparisons. FDIC made SOD 2025 amendments available on August 14, 2026. A previously available secondary HHI series does not establish that its 2025 numbers incorporate those updates. Therefore this article makes no claims that 2026 HHI increased or decreased from 2025. A comparable trend requires reprocessing both FDIC survey years at the same scope and institution level.
Rounding: all CR3 rankings are calculated from individually published 0.01-point shares; results are then displayed to 0.01 point. HHI from complete shares is displayed to the nearest whole number as “approx.”; conservative intervals are rounded outward. Nothing here measures competitive conduct, consumer switching, or regulatory banking-market antitrust conclusions.
Main ranking: 51 jurisdictions by 2026 top-three bank deposit share
Search a state or leading bank, filter the Census region, select HHI method, and sort the existing records. The table is ranked by calculated CR3, not HHI. The right-hand column shows the three observed inputs, calculation, year, statuses, and independent validation for every row.
All 51 CR3 rows are calculated_value. Six HHI cells show approximate all-charter 2026 calculations; the remaining 45 show calculated, conservative intervals. Top 10/20 follows the original CR3 rank regardless of the current sort order. No 2025 HHI trend is asserted.
| Rank | State / DC | CR3 2026 | HHI 2026 | Source / calculation / validation |
|---|---|---|---|---|
| 1 | South Dakota | 96.16% | 4,672–4,678 | 2026 calculated_value. BankRegReports June 30 2026: first/second/third bank shares 55.25% + 40.26% + 0.65% = 96.16% CR3. Leader: Citibank (CR1 55.25%). Finantrix independently reports CR3 96.2%; difference 0.04 percentage points, due to published rounding. 2026 HHI bound 4,672–4,678, calculated from top-three shares using the N-independent conservative method. No verified cross-year HHI comparison. |
| 2 | Delaware | 86.66% | approx. 5,041 | 2026 calculated_value. BankRegReports June 30 2026: first/second/third bank shares 69.64% + 10.67% + 6.35% = 86.66% CR3. Leader: Capital One (CR1 69.64%). Finantrix independently reports CR3 86.7%; difference 0.04 percentage points, due to published rounding. 2026 HHI approx. 5,041, derived by summing squared rounded shares of all 36 banks; full inputs in Methodology. No verified cross-year HHI comparison. |
| 3 | Alaska | 82.86% | approx. 2,730 | 2026 calculated_value. BankRegReports June 30 2026: first/second/third bank shares 42.89% + 22.26% + 17.71% = 82.86% CR3. Leader: Wells Fargo Bank (CR1 42.89%). Finantrix independently reports CR3 82.9%; difference 0.04 percentage points, due to published rounding. 2026 HHI approx. 2,730, derived by summing squared rounded shares of all 7 banks; full inputs in Methodology. No verified cross-year HHI comparison. |
| 4 | Hawaii | 79.92% | approx. 2,512 | 2026 calculated_value. BankRegReports June 30 2026: first/second/third bank shares 34.26% + 31.24% + 14.42% = 79.92% CR3. Leader: Bank of Hawaii (CR1 34.26%). Finantrix independently reports CR3 79.9%; difference 0.02 percentage points, due to published rounding. 2026 HHI approx. 2,512, derived by summing squared rounded shares of all 13 banks; full inputs in Methodology. No verified cross-year HHI comparison. |
| 5 | North Carolina | 74.14% | 2,384–2,721 | 2026 calculated_value. BankRegReports June 30 2026: first/second/third bank shares 43.80% + 16.92% + 13.42% = 74.14% CR3. Leader: Bank of America (CR1 43.80%). Finantrix independently reports CR3 74.1%; difference 0.04 percentage points, due to published rounding. 2026 HHI bound 2,384–2,721, calculated from top-three shares using the N-independent conservative method. No verified cross-year HHI comparison. |
| 6 | Rhode Island | 69.06% | approx. 2,018 | 2026 calculated_value. BankRegReports June 30 2026: first/second/third bank shares 35.73% + 21.69% + 11.64% = 69.06% CR3. Leader: Citizens Bank (CR1 35.73%). Finantrix independently reports CR3 69.1%; difference 0.04 percentage points, due to published rounding. 2026 HHI approx. 2,018, derived by summing squared rounded shares of all 17 banks; full inputs in Methodology. No verified cross-year HHI comparison. |
| 7 | Massachusetts | 62.26% | 1,732–2,074 | 2026 calculated_value. BankRegReports June 30 2026: first/second/third bank shares 37.51% + 15.56% + 9.19% = 62.26% CR3. Leader: State Street Bank and Trust Company (CR1 37.51%). Finantrix independently reports CR3 62.3%; difference 0.04 percentage points, due to published rounding. 2026 HHI bound 1,732–2,074, calculated from top-three shares using the N-independent conservative method. No verified cross-year HHI comparison. |
| 8 | Arizona | 61.24% | 1,267–1,870 | 2026 calculated_value. BankRegReports June 30 2026: first/second/third bank shares 22.60% + 21.65% + 16.99% = 61.24% CR3. Leader: Western Alliance Bank (CR1 22.60%). Finantrix independently reports CR3 61.2%; difference 0.04 percentage points, due to published rounding. 2026 HHI bound 1,267–1,870, calculated from top-three shares using the N-independent conservative method. No verified cross-year HHI comparison. |
| 9 | District of Columbia | 59.17% | 1,251–1,804 | 2026 calculated_value. BankRegReports June 30 2026: first/second/third bank shares 26.53% + 19.10% + 13.54% = 59.17% CR3. Leader: Bank of America (CR1 26.53%). Finantrix independently reports CR3 59.2%; difference 0.03 percentage points, due to published rounding. 2026 HHI bound 1,251–1,804, calculated from top-three shares using the N-independent conservative method. No verified cross-year HHI comparison. |
| 10 | Minnesota | 58.88% | 1,492–1,788 | 2026 calculated_value. BankRegReports June 30 2026: first/second/third bank shares 33.32% + 18.07% + 7.49% = 58.88% CR3. Leader: U.S. Bank (CR1 33.32%). Finantrix independently reports CR3 58.9%; difference 0.02 percentage points, due to published rounding. 2026 HHI bound 1,492–1,788, calculated from top-three shares using the N-independent conservative method. No verified cross-year HHI comparison. |
| 11 | Connecticut | 57.06% | 1,194–1,636 | 2026 calculated_value. BankRegReports June 30 2026: first/second/third bank shares 23.52% + 23.08% + 10.46% = 57.06% CR3. Leader: Webster Bank (CR1 23.52%). Finantrix independently reports CR3 57.1%; difference 0.04 percentage points, due to published rounding. 2026 HHI bound 1,194–1,636, calculated from top-three shares using the N-independent conservative method. No verified cross-year HHI comparison. |
| 12 | California | 56.38% | 1,102–1,750 | 2026 calculated_value. BankRegReports June 30 2026: first/second/third bank shares 24.19% + 16.27% + 15.92% = 56.38% CR3. Leader: Bank of America (CR1 24.19%). Finantrix independently reports CR3 56.4%; difference 0.02 percentage points, due to published rounding. 2026 HHI bound 1,102–1,750, calculated from top-three shares using the N-independent conservative method. No verified cross-year HHI comparison. |
| 13 | New York | 54.35% | 1,413–1,832 | 2026 calculated_value. BankRegReports June 30 2026: first/second/third bank shares 35.03% + 10.08% + 9.24% = 54.35% CR3. Leader: JPMorgan Chase Bank (CR1 35.03%). Finantrix independently reports CR3 54.3%; difference 0.05 percentage points, due to published rounding. 2026 HHI bound 1,413–1,832, calculated from top-three shares using the N-independent conservative method. No verified cross-year HHI comparison. |
| 14 | Montana | 53.03% | 957–1,695 | 2026 calculated_value. BankRegReports June 30 2026: first/second/third bank shares 21.41% + 15.97% + 15.65% = 53.03% CR3. Leader: Glacier Bank (CR1 21.41%). Finantrix independently reports CR3 53.0%; difference 0.03 percentage points, due to published rounding. 2026 HHI bound 957–1,695, calculated from top-three shares using the N-independent conservative method. No verified cross-year HHI comparison. |
| 15 | Oregon | 52.46% | 948–1,535 | 2026 calculated_value. BankRegReports June 30 2026: first/second/third bank shares 21.02% + 18.30% + 13.14% = 52.46% CR3. Leader: U.S. Bank (CR1 21.02%). Finantrix independently reports CR3 52.5%; difference 0.04 percentage points, due to published rounding. 2026 HHI bound 948–1,535, calculated from top-three shares using the N-independent conservative method. No verified cross-year HHI comparison. |
| 16 | Michigan | 52.43% | 955–1,529 | 2026 calculated_value. BankRegReports June 30 2026: first/second/third bank shares 21.29% + 18.60% + 12.54% = 52.43% CR3. Leader: JPMorgan Chase Bank (CR1 21.29%). Finantrix independently reports CR3 52.4%; difference 0.03 percentage points, due to published rounding. 2026 HHI bound 955–1,529, calculated from top-three shares using the N-independent conservative method. No verified cross-year HHI comparison. |
| 17 | Nevada | 52.01% | 939–1,518 | 2026 calculated_value. BankRegReports June 30 2026: first/second/third bank shares 19.89% + 19.87% + 12.25% = 52.01% CR3. Leader: Bank of America (CR1 19.89%). Finantrix independently reports CR3 52.0%; difference 0.01 percentage points, due to published rounding. 2026 HHI bound 939–1,518, calculated from top-three shares using the N-independent conservative method. No verified cross-year HHI comparison. |
| 18 | Utah | 51.65% | 923–1,552 | 2026 calculated_value. BankRegReports June 30 2026: first/second/third bank shares 21.88% + 15.80% + 13.97% = 51.65% CR3. Leader: Morgan Stanley Bank (CR1 21.88%). Finantrix independently reports CR3 51.7%; difference 0.05 percentage points, due to published rounding. 2026 HHI bound 923–1,552, calculated from top-three shares using the N-independent conservative method. No verified cross-year HHI comparison. |
| 19 | New Hampshire | 51.09% | 929–1,442 | 2026 calculated_value. BankRegReports June 30 2026: first/second/third bank shares 21.85% + 18.19% + 11.05% = 51.09% CR3. Leader: TD Bank (CR1 21.85%). Finantrix independently reports CR3 51.1%; difference 0.01 percentage points, due to published rounding. 2026 HHI bound 929–1,442, calculated from top-three shares using the N-independent conservative method. No verified cross-year HHI comparison. |
| 20 | Ohio | 47.61% | 769–1,434 | 2026 calculated_value. BankRegReports June 30 2026: first/second/third bank shares 17.89% + 16.86% + 12.86% = 47.61% CR3. Leader: U.S. Bank (CR1 17.89%). Finantrix independently reports CR3 47.6%; difference 0.01 percentage points, due to published rounding. 2026 HHI bound 769–1,434, calculated from top-three shares using the N-independent conservative method. No verified cross-year HHI comparison. |
| 21 | Virginia | 47.33% | 749–1,472 | 2026 calculated_value. BankRegReports June 30 2026: first/second/third bank shares 17.09% + 15.57% + 14.67% = 47.33% CR3. Leader: Capital One (CR1 17.09%). Finantrix independently reports CR3 47.3%; difference 0.03 percentage points, due to published rounding. 2026 HHI bound 749–1,472, calculated from top-three shares using the N-independent conservative method. No verified cross-year HHI comparison. |
| 22 | Vermont | 47.31% | approx. 1,057 | 2026 calculated_value. BankRegReports June 30 2026: first/second/third bank shares 20.21% + 19.21% + 7.89% = 47.31% CR3. Leader: TD Bank (CR1 20.21%). Finantrix independently reports CR3 47.3%; difference 0.01 percentage points, due to published rounding. 2026 HHI approx. 1,057, derived by summing squared rounded shares of all 25 banks; full inputs in Methodology. No verified cross-year HHI comparison. |
| 23 | Maryland | 46.66% | 792–1,373 | 2026 calculated_value. BankRegReports June 30 2026: first/second/third bank shares 22.15% + 13.15% + 11.36% = 46.66% CR3. Leader: Bank of America (CR1 22.15%). Finantrix independently reports CR3 46.7%; difference 0.04 percentage points, due to published rounding. 2026 HHI bound 792–1,373, calculated from top-three shares using the N-independent conservative method. No verified cross-year HHI comparison. |
| 24 | Georgia | 46.62% | 743–1,388 | 2026 calculated_value. BankRegReports June 30 2026: first/second/third bank shares 18.77% + 15.27% + 12.58% = 46.62% CR3. Leader: Truist Bank (CR1 18.77%). Finantrix independently reports CR3 46.6%; difference 0.02 percentage points, due to published rounding. 2026 HHI bound 743–1,388, calculated from top-three shares using the N-independent conservative method. No verified cross-year HHI comparison. |
| 25 | Texas | 46.24% | 737–1,386 | 2026 calculated_value. BankRegReports June 30 2026: first/second/third bank shares 19.44% + 14.20% + 12.60% = 46.24% CR3. Leader: JPMorgan Chase Bank (CR1 19.44%). Finantrix independently reports CR3 46.2%; difference 0.04 percentage points, due to published rounding. 2026 HHI bound 737–1,386, calculated from top-three shares using the N-independent conservative method. No verified cross-year HHI comparison. |
| 26 | Washington | 45.39% | 725–1,324 | 2026 calculated_value. BankRegReports June 30 2026: first/second/third bank shares 19.82% + 14.52% + 11.05% = 45.39% CR3. Leader: Bank of America (CR1 19.82%). Finantrix independently reports CR3 45.4%; difference 0.01 percentage points, due to published rounding. 2026 HHI bound 725–1,324, calculated from top-three shares using the N-independent conservative method. No verified cross-year HHI comparison. |
| 27 | Colorado | 42.58% | 632–1,271 | 2026 calculated_value. BankRegReports June 30 2026: first/second/third bank shares 18.47% + 12.84% + 11.27% = 42.58% CR3. Leader: Wells Fargo Bank (CR1 18.47%). Finantrix independently reports CR3 42.6%; difference 0.02 percentage points, due to published rounding. 2026 HHI bound 632–1,271, calculated from top-three shares using the N-independent conservative method. No verified cross-year HHI comparison. |
| 28 | Louisiana | 41.29% | 582–1,275 | 2026 calculated_value. BankRegReports June 30 2026: first/second/third bank shares 16.85% + 12.38% + 12.06% = 41.29% CR3. Leader: JPMorgan Chase Bank (CR1 16.85%). Finantrix independently reports CR3 41.3%; difference 0.01 percentage points, due to published rounding. 2026 HHI bound 582–1,275, calculated from top-three shares using the N-independent conservative method. No verified cross-year HHI comparison. |
| 29 | Idaho | 40.44% | 599–1,043 | 2026 calculated_value. BankRegReports June 30 2026: first/second/third bank shares 16.65% + 16.36% + 7.43% = 40.44% CR3. Leader: Wells Fargo Bank (CR1 16.65%). Finantrix independently reports CR3 40.4%; difference 0.04 percentage points, due to published rounding. 2026 HHI bound 599–1,043, calculated from top-three shares using the N-independent conservative method. No verified cross-year HHI comparison. |
| 30 | Wisconsin | 40.11% | 552–1,165 | 2026 calculated_value. BankRegReports June 30 2026: first/second/third bank shares 16.35% + 13.11% + 10.65% = 40.11% CR3. Leader: U.S. Bank (CR1 16.35%). Finantrix independently reports CR3 40.1%; difference 0.01 percentage points, due to published rounding. 2026 HHI bound 552–1,165, calculated from top-three shares using the N-independent conservative method. No verified cross-year HHI comparison. |
| 31 | South Carolina | 39.26% | 523–1,146 | 2026 calculated_value. BankRegReports June 30 2026: first/second/third bank shares 14.90% + 13.78% + 10.58% = 39.26% CR3. Leader: Bank of America (CR1 14.90%). Finantrix independently reports CR3 39.2%; difference 0.06 percentage points, due to published rounding. 2026 HHI bound 523–1,146, calculated from top-three shares using the N-independent conservative method. No verified cross-year HHI comparison. |
| 32 | New Mexico | 39.19% | 615–957 | 2026 calculated_value. BankRegReports June 30 2026: first/second/third bank shares 20.11% + 13.35% + 5.73% = 39.19% CR3. Leader: Wells Fargo Bank (CR1 20.11%). Finantrix independently reports CR3 39.2%; difference 0.01 percentage points, due to published rounding. 2026 HHI bound 615–957, calculated from top-three shares using the N-independent conservative method. No verified cross-year HHI comparison. |
| 33 | Florida | 38.79% | 565–1,105 | 2026 calculated_value. BankRegReports June 30 2026: first/second/third bank shares 19.43% + 10.34% + 9.02% = 38.79% CR3. Leader: Bank of America (CR1 19.43%). Finantrix independently reports CR3 38.8%; difference 0.01 percentage points, due to published rounding. 2026 HHI bound 565–1,105, calculated from top-three shares using the N-independent conservative method. No verified cross-year HHI comparison. |
| 34 | Illinois | 38.70% | 561–965 | 2026 calculated_value. BankRegReports June 30 2026: first/second/third bank shares 17.51% + 14.53% + 6.66% = 38.70% CR3. Leader: JPMorgan Chase Bank (CR1 17.51%). Finantrix independently reports CR3 38.7%; difference 0.00 percentage points, due to published rounding. 2026 HHI bound 561–965, calculated from top-three shares using the N-independent conservative method. No verified cross-year HHI comparison. |
| 35 | New Jersey | 38.52% | 517–1,078 | 2026 calculated_value. BankRegReports June 30 2026: first/second/third bank shares 16.30% + 12.78% + 9.44% = 38.52% CR3. Leader: Bank of America (CR1 16.30%). Finantrix independently reports CR3 38.5%; difference 0.02 percentage points, due to published rounding. 2026 HHI bound 517–1,078, calculated from top-three shares using the N-independent conservative method. No verified cross-year HHI comparison. |
| 36 | Pennsylvania | 37.81% | 697–1,079 | 2026 calculated_value. BankRegReports June 30 2026: first/second/third bank shares 24.74% + 6.91% + 6.16% = 37.81% CR3. Leader: PNC Bank (CR1 24.74%). Finantrix independently reports CR3 37.8%; difference 0.01 percentage points, due to published rounding. 2026 HHI bound 697–1,079, calculated from top-three shares using the N-independent conservative method. No verified cross-year HHI comparison. |
| 37 | Mississippi | 36.15% | 437–1,122 | 2026 calculated_value. BankRegReports June 30 2026: first/second/third bank shares 12.93% + 12.24% + 10.98% = 36.15% CR3. Leader: Trustmark Bank (CR1 12.93%). Finantrix independently reports CR3 36.2%; difference 0.05 percentage points, due to published rounding. 2026 HHI bound 437–1,122, calculated from top-three shares using the N-independent conservative method. No verified cross-year HHI comparison. |
| 38 | Tennessee | 35.94% | 439–1,033 | 2026 calculated_value. BankRegReports June 30 2026: first/second/third bank shares 13.57% + 12.84% + 9.53% = 35.94% CR3. Leader: First Horizon Bank (CR1 13.57%). Finantrix independently reports CR3 35.9%; difference 0.04 percentage points, due to published rounding. 2026 HHI bound 439–1,033, calculated from top-three shares using the N-independent conservative method. No verified cross-year HHI comparison. |
| 39 | Alabama | 35.81% | 558–984 | 2026 calculated_value. BankRegReports June 30 2026: first/second/third bank shares 21.29% + 7.75% + 6.77% = 35.81% CR3. Leader: Regions Bank (CR1 21.29%). Finantrix independently reports CR3 35.8%; difference 0.01 percentage points, due to published rounding. 2026 HHI bound 558–984, calculated from top-three shares using the N-independent conservative method. No verified cross-year HHI comparison. |
| 40 | West Virginia | 35.76% | 442–990 | 2026 calculated_value. BankRegReports June 30 2026: first/second/third bank shares 14.50% + 12.51% + 8.75% = 35.76% CR3. Leader: United Bank (CR1 14.50%). Finantrix independently reports CR3 35.8%; difference 0.04 percentage points, due to published rounding. 2026 HHI bound 442–990, calculated from top-three shares using the N-independent conservative method. No verified cross-year HHI comparison. |
| 41 | Nebraska | 33.89% | 457–947 | 2026 calculated_value. BankRegReports June 30 2026: first/second/third bank shares 18.37% + 7.99% + 7.53% = 33.89% CR3. Leader: First National Bank of Omaha (CR1 18.37%). Finantrix independently reports CR3 33.9%; difference 0.01 percentage points, due to published rounding. 2026 HHI bound 457–947, calculated from top-three shares using the N-independent conservative method. No verified cross-year HHI comparison. |
| 42 | Maine | 32.73% | approx. 657 | 2026 calculated_value. BankRegReports June 30 2026: first/second/third bank shares 11.67% + 11.00% + 10.06% = 32.73% CR3. Leader: Bangor Savings Bank (CR1 11.67%). Finantrix independently reports CR3 32.7%; difference 0.03 percentage points, due to published rounding. 2026 HHI approx. 657, derived by summing squared rounded shares of all 29 banks; full inputs in Methodology. No verified cross-year HHI comparison. |
| 43 | Oklahoma | 31.93% | 358–865 | 2026 calculated_value. BankRegReports June 30 2026: first/second/third bank shares 13.57% + 10.87% + 7.49% = 31.93% CR3. Leader: BOKF (CR1 13.57%). Finantrix independently reports CR3 31.9%; difference 0.03 percentage points, due to published rounding. 2026 HHI bound 358–865, calculated from top-three shares using the N-independent conservative method. No verified cross-year HHI comparison. |
| 44 | Arkansas | 31.39% | 345–848 | 2026 calculated_value. BankRegReports June 30 2026: first/second/third bank shares 13.28% + 10.67% + 7.44% = 31.39% CR3. Leader: Arvest Bank (CR1 13.28%). Finantrix independently reports CR3 31.4%; difference 0.01 percentage points, due to published rounding. 2026 HHI bound 345–848, calculated from top-three shares using the N-independent conservative method. No verified cross-year HHI comparison. |
| 45 | Wyoming | 29.46% | 308–762 | 2026 calculated_value. BankRegReports June 30 2026: first/second/third bank shares 12.56% + 10.46% + 6.44% = 29.46% CR3. Leader: First Interstate Bank (CR1 12.56%). Finantrix independently reports CR3 29.5%; difference 0.04 percentage points, due to published rounding. 2026 HHI bound 308–762, calculated from top-three shares using the N-independent conservative method. No verified cross-year HHI comparison. |
| 46 | Missouri | 28.94% | 296–807 | 2026 calculated_value. BankRegReports June 30 2026: first/second/third bank shares 12.98% + 8.64% + 7.32% = 28.94% CR3. Leader: UMB Bank (CR1 12.98%). Finantrix independently reports CR3 28.9%; difference 0.04 percentage points, due to published rounding. 2026 HHI bound 296–807, calculated from top-three shares using the N-independent conservative method. No verified cross-year HHI comparison. |
| 47 | Indiana | 26.54% | 252–737 | 2026 calculated_value. BankRegReports June 30 2026: first/second/third bank shares 12.30% + 7.62% + 6.62% = 26.54% CR3. Leader: JPMorgan Chase Bank (CR1 12.30%). Finantrix independently reports CR3 26.5%; difference 0.04 percentage points, due to published rounding. 2026 HHI bound 252–737, calculated from top-three shares using the N-independent conservative method. No verified cross-year HHI comparison. |
| 48 | North Dakota | 25.92% | 226–791 | 2026 calculated_value. BankRegReports June 30 2026: first/second/third bank shares 10.07% + 8.05% + 7.80% = 25.92% CR3. Leader: First International Bank and Trust (CR1 10.07%). Finantrix independently reports CR3 25.9%; difference 0.02 percentage points, due to published rounding. 2026 HHI bound 226–791, calculated from top-three shares using the N-independent conservative method. No verified cross-year HHI comparison. |
| 49 | Kentucky | 24.59% | 204–705 | 2026 calculated_value. BankRegReports June 30 2026: first/second/third bank shares 9.32% + 8.55% + 6.72% = 24.59% CR3. Leader: PNC Bank (CR1 9.32%). Finantrix independently reports CR3 24.6%; difference 0.01 percentage points, due to published rounding. 2026 HHI bound 204–705, calculated from top-three shares using the N-independent conservative method. No verified cross-year HHI comparison. |
| 50 | Iowa | 18.97% | 120–596 | 2026 calculated_value. BankRegReports June 30 2026: first/second/third bank shares 7.03% + 5.98% + 5.96% = 18.97% CR3. Leader: Principal Bank (CR1 7.03%). Finantrix independently reports CR3 19.0%; difference 0.03 percentage points, due to published rounding. 2026 HHI bound 120–596, calculated from top-three shares using the N-independent conservative method. No verified cross-year HHI comparison. |
| 51 | Kansas | 18.66% | 117–542 | 2026 calculated_value. BankRegReports June 30 2026: first/second/third bank shares 6.93% + 6.44% + 5.29% = 18.66% CR3. Leader: Bank of America (CR1 6.93%). Finantrix independently reports CR3 18.7%; difference 0.04 percentage points, due to published rounding. 2026 HHI bound 117–542, calculated from top-three shares using the N-independent conservative method. No verified cross-year HHI comparison. |
BankRegReports numeric source, 2026 state-level institution observations; Finantrix independent validation, 2026. Per-jurisdiction source URLs are provided in Sources. All CR3 figures are computed from three observed shares, not an official direct FDIC CR3 publication.
Four findings from the 2026 bank-deposit concentration study
Key Insight: 77.50 percentage-point difference
South Dakota (rank 1, 96.16%) exceeds Kansas (rank 51, 18.66%) by 77.50 percentage points of bank-office deposits assigned to the top three charters. The calculation is 96.16 − 18.66, using observed 2026 shares.
Notable Pattern: Delaware's single-charter dominance
Delaware ranks 2nd by CR3 (86.66%), but its largest bank alone holds 69.64%. That is 80.36% of deposits within Delaware's leading three (69.64 ÷ 86.66 × 100), the largest such ratio in the 51-jurisdiction dataset. Its all-charter HHI is approximately 5,041.
Regional concentration: West versus Midwest
The median CR3 among 13 Western jurisdictions is 52.0%, compared with 36.3% across 12 Midwestern jurisdictions—a difference of approximately 15.7 percentage points. These are medians of state-level percentages, not deposit-weighted regional shares.
Outlier: South Dakota's third bank adds only 0.65 points
South Dakota's largest two charters hold 55.25% + 40.26% = 95.51%; the third adds 0.65 percentage points to reach CR3 96.16%. The full HHI must lie within 4,672–4,678 under the stated two-decimal rounding assumptions.
What the 2026 ranking means and what it does not
CR3 tells readers where three individual FDIC bank charters account for a greater proportion of deposits reported by in-state branches. It can identify concentration worth investigating; it does not establish monopoly power, bank pricing, competition for small-business lending, or a bank's share of resident households. Multiple charters belonging to the same holding company are still distinct here.
Large national banks and specialty deposit-taking institutions can book deposits to relatively few reporting offices, so the numbers may differ sharply from residents' experience with local bank branches. Comparing CR3 with CR1 and the six full-share HHI calculations highlights the difference between concentration dominated by one bank and concentration spread across the top three.
For regulatory competition analysis or year-over-year claims, reproduce the dataset directly from current FDIC SOD raw bank/branch records for both years. The verified 2026 cross-source calculations in this study are useful for descriptive comparison but do not replace that official reconstruction.
Frequently asked questions
Which state has the most concentrated bank-office deposits in 2026?
South Dakota has the highest calculated CR3, 96.16%, based on the three largest individual bank charter shares published for June 30, 2026. Delaware follows with 86.66%.
What exactly is CR3, and how was the 2026 ranking calculated?
CR3 is the sum of the largest three individual bank-charter deposit market shares within a jurisdiction. StatRanker added three BankRegReports percentages published to 0.01 percentage points for each state, then ranked the resulting 51 calculated sums. The source is industry-published; the combined value is StatRanker-calculated.
Is this an official FDIC-published CR3 or HHI ranking?
No. The underlying source survey is FDIC Summary of Deposits for June 30, 2026. CR3 is calculated from industry-published state bank shares and independently compared with Finantrix. Approximate HHI values and intervals are also StatRanker calculations, not official FDIC-published indices.
Why are exact HHI values missing for 45 jurisdictions?
An exact full HHI requires the complete set of bank-charter deposit shares for each state. Full rounded share vectors were verified only for six jurisdictions. Conservative lower and upper HHI bounds are calculated for the remaining 45; these ranges should not be interpreted as precise index values.
Why are 2025 and 2026 HHI changes not shown?
The 2025 SOD survey received official amendments on August 14, 2026. The historical HHI figures in an earlier secondary dataset were not verified against that updated release. This version therefore excludes claims of changes in concentration until both years can be recalculated using the same version and method.
Do deposits in this ranking belong only to people living in each state?
No. SOD deposits are attributed to the reporting bank office in a state. Customer residence and branch address are different concepts. This is a state office-booked deposit distribution, not a population-based count of banking customers.
How do CR1, CR3 and HHI differ?
CR1 is the largest charter share, CR3 is the sum of the top three charter shares, and HHI is the sum of squared shares across all charters. CR3 alone cannot determine exact HHI, and HHI is more sensitive to single-charter dominance.
Are credit unions, bank holding companies or Puerto Rico included?
Credit unions are excluded; the unit is the FDIC-insured bank charter (CERT), not consolidated bank holding company. The ranking covers the 50 U.S. states plus Washington, DC, and excludes Puerto Rico and other territories.
Sources and reproducibility
The ranking uses one bank-charter market-share publisher for numerical components and a second publisher for independent validation. Both use FDIC SOD as the underlying survey, so two industry publications are not two independent primary official sources. Source purpose and status are separated below; only absolute URLs are provided.
Input percentages for CR1, CR3, conservative HHI bounds and six approximate all-charter HHIs. State detail links are supplied below.
https://www.bankregreports.com/rankings/deposits-by-state/51 independently reported one-decimal CR3 figures compared with StatRanker's 51 sums of BankRegReports' top-three shares. Largest absolute discrepancy: 0.06 percentage points.
https://www.finantrix.com/articles/banks-by-stateDefines survey coverage, reporting basis and official 2026 data availability; an official raw extract was not independently aggregated for this page.
https://banks.data.fdic.gov/bankfind-suite/SODSource for a future raw branch and charter aggregation by state for both 2025 and 2026.
https://banks.data.fdic.gov/bankfind-suite/SOD/customDownloadOfficial amendment notice used to avoid a potentially stale 2025-versus-2026 HHI trend.
https://banks.data.fdic.gov/bankfind-suite/help?helpTopic=summary-of-deposits-data-amendmentsRelated analysis of total domestic deposits by bank. This is different from state-level branch-office deposit concentration and supplies no input values to the present ranking.
https://statranker.org/economy/u-s-bank-deposit-rankings-2026-top-100-banks-by-domestic-deposits/BankRegReports: full source pages for all 51 jurisdictions
Each link leads to the state-specific 2026 bank-charter list used to calculate the CR3 row.
Related rankings
Closely related StatRanker ranking and data pages selected by topic, entity scope and category. Fewer links are shown when strong matches are limited.
