

Median Household Income by State: 2026 Snapshot Based on 2024 ACS Data
How Median Household Income Differs Across U.S. States in the Latest ACS Release
Information updated: May 3, 2026
This ranking compares median household income across the 50 U.S. states and the District of Columbia using the latest official American Community Survey state-level estimates available at this update. The underlying data are from the 2024 ACS 1-year estimates, expressed in 2024 inflation-adjusted dollars.
No full-year 2026 state-level median household income dataset is available yet. The ranking therefore uses the latest official ACS release, not a forecast and not observed 2026 income. Median household income is useful because it describes the midpoint household: half of households have income above the median and half below it. It is less distorted by very high earners than average household income.
Key income benchmarks
Overview: what the income ranking shows
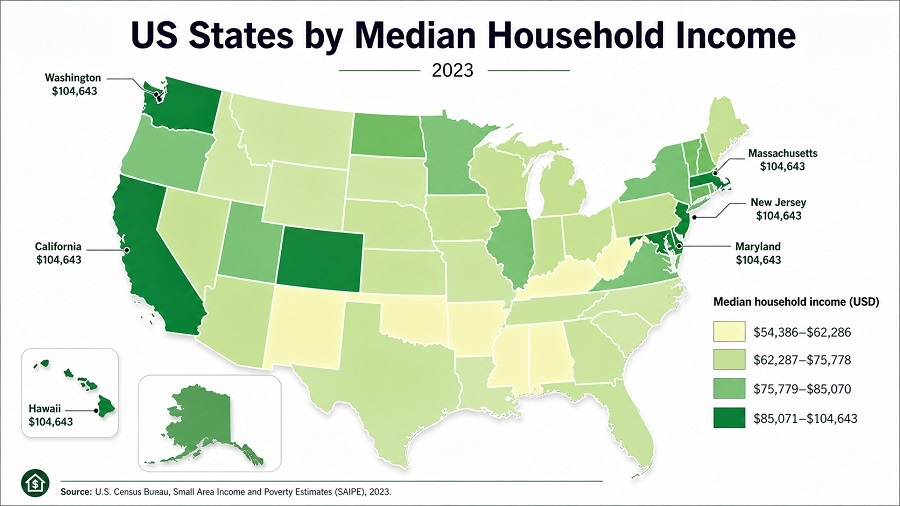
The upper end of the ranking is concentrated in the Northeast, the Washington, D.C. corridor, the Pacific Coast, and several high-income Mountain or Western states. Massachusetts, New Jersey, Maryland, Hawaii, California, New Hampshire, Washington, Colorado, Utah, and Connecticut form the highest state group in the ACS estimate. The District of Columbia sits above every state, but it is shown as a separate district benchmark rather than folded into the state-only Top 10.
The distribution is not only about pay levels. A state’s median household income reflects household composition, labor-force participation, industry mix, education levels, commuting patterns, age structure, and the share of dual-earner households. A high median income may coexist with high housing costs, while a lower median may support stronger purchasing power in lower-cost states.
The lower part of the ranking contains Mississippi, West Virginia, Louisiana, Arkansas, Kentucky, Oklahoma, Alabama, and New Mexico. Several of these states had positive real income changes between the 2023 and 2024 ACS estimates, but their income levels remain below the national median.
Top 10 states by median household income
This compact table excludes the District of Columbia so the state-only leaders are clear. The full table includes D.C. as a separate reference row.
| Rank | State | Median household income | Change vs 2023 |
|---|---|---|---|
| 1 | Massachusetts | $104,828 | +2.0% |
| 2 | New Jersey | $104,294 | +1.5% |
| 3 | Maryland | $102,905 | +1.3% |
| 4 | Hawaii | $100,745 | +2.7% |
| 5 | California | $100,149 | +1.9% |
| 6 | New Hampshire | $99,782 | +0.1% |
| 7 | Washington | $99,389 | +2.1% |
| 8 | Colorado | $97,113 | +1.5% |
| 9 | Utah | $96,658 | +0.5% |
| 10 | Connecticut | $96,049 | +1.8% |
Source: 2024 ACS 1-year estimates, in 2024 inflation-adjusted dollars. Change compares ACS 2024 with ACS 2023; close or small changes should be read with ACS margins of error in mind.
Chart: highest median household incomes
The visual ranking below shows the highest entries in the full table, including the District of Columbia. Bar lengths compare the published ACS median household income estimates.
Values shown in the chart: D.C. $109,707; Massachusetts $104,828; New Jersey $104,294; Maryland $102,905; Hawaii $100,745; California $100,149; New Hampshire $99,782; Washington $99,389.
Methodology
The indicator is median household income in the past 12 months. Household income includes the income of the householder and all other people aged 15 and older in the household, whether or not they are related to the householder. The median divides the household income distribution into two equal halves: 50 percent of households are above the value and 50 percent are below it.
The ranking uses the U.S. Census Bureau’s 2024 American Community Survey 1-year estimates because those are the latest official state-level ACS estimates available at this update. The Census release expresses income in 2024 inflation-adjusted dollars. The ACS is conducted monthly, and income is reported for the 12 months before each interview, so the 2024 ACS contains some income reported from 2023. That is why the ranking is not described as actual 2026 income.
Rows are sorted from highest to lowest median household income. The table includes the 50 states and the District of Columbia. Puerto Rico appears in the Census appendix but is excluded here to keep the ranking focused on states and D.C. Values are shown as published estimates and rounded to whole dollars. The change column is the ACS percent change from 2023 to 2024, shown with a plus or minus sign.
The main limitation is that ACS figures are survey estimates, not a complete administrative count of every household. Margins of error and statistical significance matter when comparing states with similar medians. The Census brief notes that Massachusetts, New Jersey, and Maryland had the highest state medians and were not statistically different from each other. Readers should therefore interpret small rank differences cautiously.
Main table: US states and D.C. by median household income
The table lists all 50 states and the District of Columbia. Use the controls to search, sort, or switch between all rows, Top 20 and Top 10 views.
Showing 51 rows.
| Rank | State / district | Median household income | Change vs 2023 |
|---|---|---|---|
| 1 | District of Columbia | $109,707 | −1.5% |
| 2 | Massachusetts | $104,828 | +2.0% |
| 3 | New Jersey | $104,294 | +1.5% |
| 4 | Maryland | $102,905 | +1.3% |
| 5 | Hawaii | $100,745 | +2.7% |
| 6 | California | $100,149 | +1.9% |
| 7 | New Hampshire | $99,782 | +0.1% |
| 8 | Washington | $99,389 | +2.1% |
| 9 | Colorado | $97,113 | +1.5% |
| 10 | Utah | $96,658 | +0.5% |
| 11 | Connecticut | $96,049 | +1.8% |
| 12 | Alaska | $95,665 | +7.3% |
| 13 | Virginia | $92,090 | −0.5% |
| 14 | Delaware | $87,534 | +4.5% |
| 15 | Minnesota | $87,117 | −0.5% |
| 16 | New York | $85,820 | +1.6% |
| 17 | Oregon | $85,220 | +3.3% |
| 18 | Rhode Island | $83,504 | −4.5% |
| 19 | Illinois | $83,211 | +0.7% |
| 20 | Vermont | $82,730 | −1.0% |
| 21 | Arizona | $81,486 | +2.4% |
| 22 | Idaho | $81,166 | +5.2% |
| 23 | Nevada | $81,134 | +3.2% |
| 24 | Georgia | $79,991 | +4.1% |
| 25 | Texas | $79,721 | +2.2% |
| 26 | North Dakota | $77,871 | −1.1% |
| 27 | Florida | $77,735 | +3.0% |
| 28 | Pennsylvania | $77,545 | +2.0% |
| 29 | Wisconsin | $77,488 | +0.9% |
| 30 | South Dakota | $76,881 | +4.0% |
| 31 | Maine | $76,442 | +0.7% |
| 32 | Nebraska | $76,376 | −0.5% |
| 33 | Wyoming | $75,532 | +1.3% |
| 34 | Kansas | $75,514 | +4.3% |
| 35 | Iowa | $75,501 | +2.7% |
| 36 | Montana | $75,340 | +3.4% |
| 37 | North Carolina | $73,958 | +1.5% |
| 38 | Michigan | $72,389 | +1.6% |
| 39 | South Carolina | $72,350 | +3.7% |
| 40 | Ohio | $72,212 | +3.5% |
| 41 | Tennessee | $71,997 | +3.4% |
| 42 | Indiana | $71,959 | +0.6% |
| 43 | Missouri | $71,589 | +1.5% |
| 44 | New Mexico | $67,816 | +5.8% |
| 45 | Alabama | $66,659 | +4.1% |
| 46 | Oklahoma | $66,148 | +3.4% |
| 47 | Kentucky | $64,526 | +2.6% |
| 48 | Arkansas | $62,106 | +2.8% |
| 49 | Louisiana | $60,986 | +1.7% |
| 50 | West Virginia | $60,798 | +5.6% |
| 51 | Mississippi | $59,127 | +6.0% |
Source: 2024 ACS 1-year estimates, in 2024 inflation-adjusted dollars. Coverage: 51 rows, including the 50 states and the District of Columbia. Figures are estimates and should be compared with ACS margins of error when ranks are close.
Insights from the ranking
- High-income clusters are not random. The leading states tend to combine high-skill labor markets, large professional-services sectors, technology or research hubs, and access to major metropolitan economies.
- D.C. is a special case. The District of Columbia ranks first in the full table, but it is not a state and has a different urban, labor-market, and household structure from most states.
- State medians do not equal affordability. Hawaii, California, Massachusetts, and Washington show high incomes, yet households also face some of the country’s most expensive housing markets.
- Growth and level are different stories. Several lower-income states posted positive changes versus 2023, but a one-year increase does not erase long-term differences in industrial structure, education, and wage composition.
- Small differences should not be overread. Because ACS values are survey estimates with margins of error, states close together in the ranking may not be meaningfully different in statistical terms.
What the ranking means for readers
Median household income is a practical starting point for comparing earning power, but it should not be used alone to judge quality of life. A household earning $95,000 in a high-cost coastal state may have less disposable income after housing, childcare, transportation, and taxes than a household earning less in a lower-cost state.
For workers, the ranking helps frame salary negotiations and relocation decisions. For policymakers, it points to differences in wage structure, education pathways, labor-force participation, and access to higher-paying industries. For businesses, it helps estimate consumer purchasing power, but it should be paired with cost-of-living, housing, age, and household-composition data before choosing markets.
For readers comparing states, the most useful interpretation is not simply “higher is better.” The stronger question is whether income, housing costs, job access, taxes, and public services align with the real living standard a household can achieve in that state.
FAQ
Is this actual 2026 median household income?
No. The latest official state-level ACS data used here are 2024 estimates. They are the latest official ACS release available at this update, but they are not observed 2026 household income.
Why is the District of Columbia included?
The Census brief discusses the 50 states and the District of Columbia together for national comparisons. This page includes D.C. as a separate district benchmark and labels the main table as “State / district.”
Why does median income differ from average income?
The median is the midpoint of the household income distribution. It is less affected by very high incomes than the average, so it is usually better for comparing a typical household’s income level.
Can two close-ranked states be treated as clearly different?
Not always. ACS values are estimates and have margins of error. When states have similar medians, their apparent rank difference may be smaller than the uncertainty around the estimates.
Why does a high-income state sometimes feel unaffordable?
Income is only one side of household finances. Housing costs, taxes, insurance, transportation, childcare, and local prices can absorb much of the income advantage in high-cost states.
Sources
-
U.S. Census Bureau — Household Income in States and Metropolitan Areas: 2024
Primary source for state median household income, percent change, ACS definitions, methodology notes, and sampling limitations.
https://www.census.gov/library/publications/2025/acs/acsbr-025.html -
U.S. Census Bureau — ACSBR-025 PDF appendix table
Appendix Table 1 provides the 2023 and 2024 median household income estimates by state, D.C., and Puerto Rico.
https://www2.census.gov/library/publications/2025/demo/acsbr-025.pdf -
U.S. Census Bureau — S1901 Income in the Past 12 Months
Official ACS subject table for income in the past 12 months, expressed in 2024 inflation-adjusted dollars.
https://data.census.gov/table/ACSST1Y2024.S1901 -
U.S. Census Bureau — American Community Survey 1-year data
Documentation for ACS 1-year data coverage, release structure, and estimate-based use.
https://www.census.gov/data/developers/data-sets/acs-1year.html
Information updated: May 3, 2026. Data year: 2024 ACS 1-year estimates. Status: latest available official state-level ACS data.
StatRanker (Website)
administrator
