

Top 100 U.S. Universities by R&D Expenditures 2026 Forecast
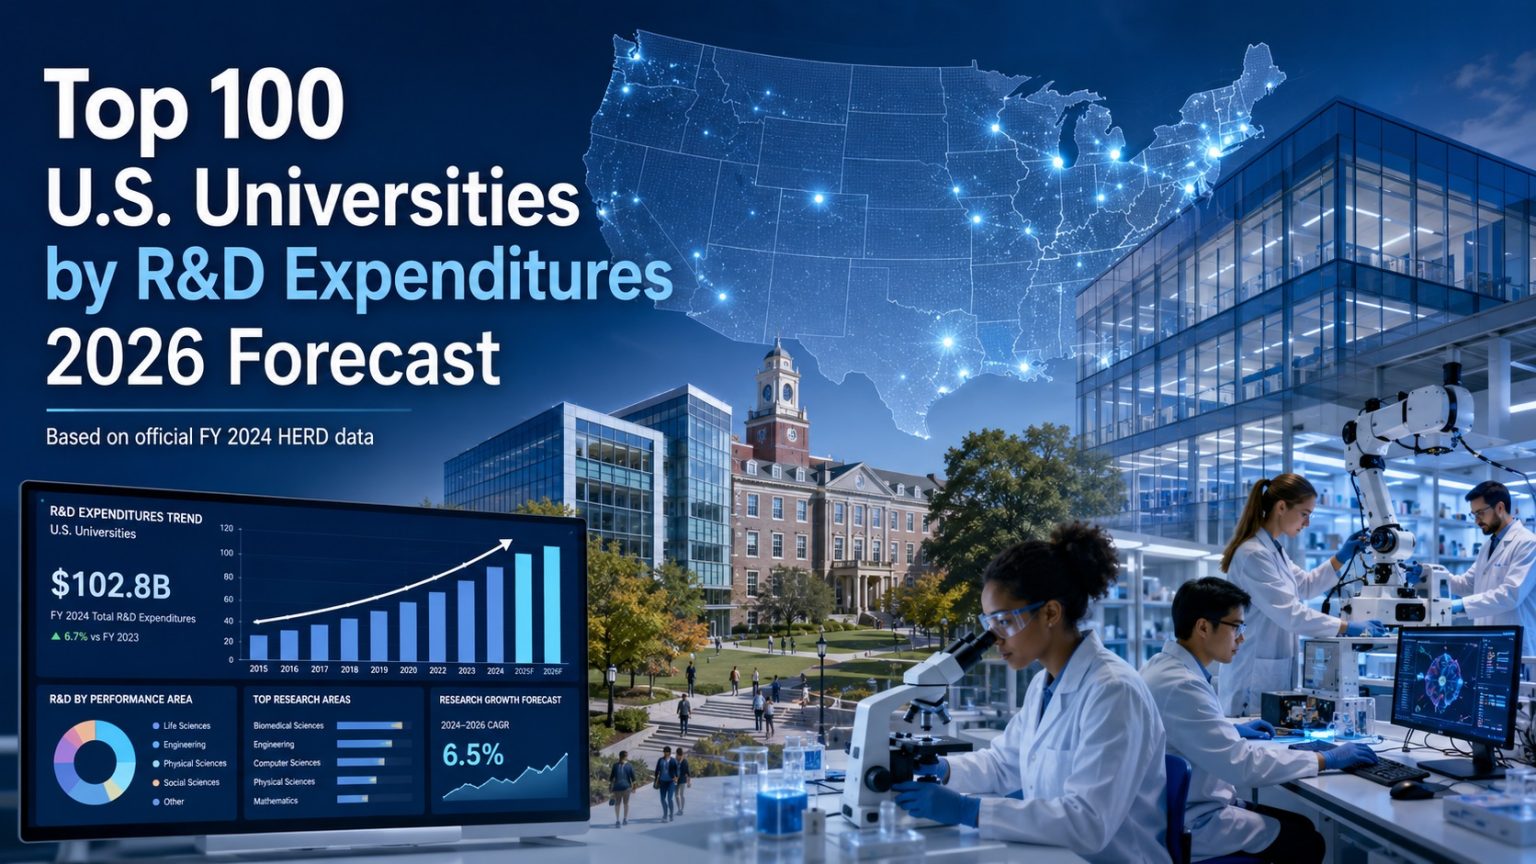
U.S. Universities by R&D Expenditures: 2026 Forecast Based on FY 2024 HERD Data
Johns Hopkins University leads this 2026 forecast scenario with $4.825B in projected research and development expenditures, followed by the University of Pennsylvania, the University of California, San Francisco, and the University of Michigan, Ann Arbor. The ranking measures total separately accounted-for R&D expenditures, shown in current U.S. dollars.
The 2024 column is the official NSF/NCSES HERD FY 2024 institution value. The 2025 and 2026 columns are calculated scenario values using the published national HERD growth rate of 8.1% from FY 2023 to FY 2024 as a uniform annual assumption.
The table is a compiled research dataset based on two NSF/NCSES source items: Table 6 for institution-level FY 2024 values and the NCSES FY 2024 HERD analysis for the 8.1% sector-wide growth parameter. Because the same multiplier is applied to every institution, the forecast preserves the official FY 2024 rank order.
Summary cards
Johns Hopkins U. remains the scale outlier because the official FY 2024 reporting unit includes the Applied Physics Laboratory.
U. Notre Dame is the 100th confirmed institution in this Top 100 forecast scenario.
Top 100 institutions from NSF/NCSES HERD FY 2024 Table 6.
100 official FY 2024 base values and 200 calculated 2025–2026 scenario values.
What this metric means
What is counted?
HERD measures separately accounted-for research and development expenditures at U.S. higher education institutions. The metric covers research activity organized to produce research outcomes and funded through federal, state, local, business, nonprofit, institutional, foreign, and other sources.
How to read the table
Rank is based on the 2026 scenario value. The 2024 number is the official base value. The 2025 and 2026 numbers are calculated by multiplying the 2024 base by 1.081 and 1.081².
Why ranks stay fixed
Every institution receives the same multiplier. That means the scenario changes the scale of spending but not the order of institutions.
What it does not measure
The ranking does not measure research quality, citations, patents, student outcomes, teaching quality, research efficiency, or R&D spending per student or employee.
Top 10 forecast table
The Top 10 shows the official FY 2024 base and the calculated 2025–2026 path. Johns Hopkins is almost twice the size of the second-ranked institution in the 2026 scenario, while the next six institutions cluster between roughly $2.0B and $2.5B.
| Rank / Institution | 2024 official | 2025 scenario | 2026 scenario |
|---|---|---|---|
| 1. Johns Hopkins U.2024 official NSF/NCSES base; 2026 = 2024 × 1.081². Includes APL reporting note. | $4.129B | $4.464B | $4.825B |
| 2. U. Pennsylvania2024 official NSF/NCSES base; 2026 = 2024 × 1.081². | $2.168B | $2.343B | $2.533B |
| 3. U. California, San Francisco2024 official NSF/NCSES base; 2026 = 2024 × 1.081². | $2.128B | $2.300B | $2.486B |
| 4. U. Michigan, Ann Arbor2024 official NSF/NCSES base; 2026 = 2024 × 1.081². | $2.111B | $2.282B | $2.467B |
| 5. U. Wisconsin-Madison2024 official NSF/NCSES base; 2026 = 2024 × 1.081². | $1.933B | $2.090B | $2.259B |
| 6. U. California, Los Angeles2024 official NSF/NCSES base; 2026 = 2024 × 1.081². | $1.896B | $2.050B | $2.216B |
| 7. U. California, San Diego2024 official NSF/NCSES base; 2026 = 2024 × 1.081². | $1.881B | $2.034B | $2.198B |
| 8. U. Washington, Seattle2024 official NSF/NCSES base; 2026 = 2024 × 1.081². | $1.691B | $1.828B | $1.976B |
| 9. Stanford U.2024 official NSF/NCSES base; 2026 = 2024 × 1.081². | $1.642B | $1.775B | $1.919B |
| 10. Cornell U.2024 official NSF/NCSES base; 2026 = 2024 × 1.081². | $1.614B | $1.744B | $1.886B |
NSF/NCSES reports official FY 2024 values in dollars in thousands. Display values are rounded to readable billions or millions.
Chart: Top 20 by 2026 R&D expenditure scenario
Bars show calculated 2026 values using official FY 2024 HERD institution totals and the +8.1% annual growth assumption. Johns Hopkins is the 100% reference bar.
Methodology
The base dataset is NSF/NCSES HERD FY 2024 Table 6, which ranks higher education institutions by total R&D expenditures. The source reports institution values in dollars in thousands. This page converts those values into readable current-dollar billions or millions and applies a transparent two-year scenario.
Metric and unit
Total higher education R&D expenditures, current U.S. dollars. Rank direction is descending: larger expenditure means a higher rank.
Base and target years
Base year is FY 2024. Target year is 2026. The 2025 column is an intermediate scenario value, not a published institution-level NSF total.
Formula
2025 = FY 2024 value × 1.081. 2026 = FY 2024 value × 1.081². The growth parameter comes from the NCSES FY 2024 HERD analysis.
Rounding
Calculations use the FY 2024 source values in thousands of dollars. Display values are rounded; table data attributes keep the calculated 2026 value in thousands.
Reporting-unit notes
Some rows represent combined or special reporting units, including Johns Hopkins with APL, University of Maryland, University of Nebraska, and University of Oklahoma.
Limits
The scenario does not model institution-specific grants, federal budget shifts, clinical trial funding, endowment support, state appropriations, or one-time research awards.
The source hierarchy is official for the FY 2024 base values and transparent for the scenario layer. The 2026 numbers are calculated estimates, not official NCSES institution-level data. Data checked: June 20, 2026.
Main ranking table: 2024 official base, 2025 scenario, 2026 forecast
Use the controls to search institutions, show special reporting-unit notes, sort the table, or switch between Top 10, Top 20, and the full Top 100.
| Rank / Institution | 2024 official | 2025 scenario | 2026 scenario |
|---|---|---|---|
| 1. Johns Hopkins U.2024 base 4,129,264; 2026 = 2024 × 1.081²; includes Applied Physics Laboratory. | $4.129B | $4.464B | $4.825B |
| 2. U. Pennsylvania2024 base 2,167,504; 2026 = 2024 × 1.081². | $2.168B | $2.343B | $2.533B |
| 3. U. California, San Francisco2024 base 2,127,637; 2026 = 2024 × 1.081². | $2.128B | $2.300B | $2.486B |
| 4. U. Michigan, Ann Arbor2024 base 2,110,961; 2026 = 2024 × 1.081². | $2.111B | $2.282B | $2.467B |
| 5. U. Wisconsin-Madison2024 base 1,933,229; 2026 = 2024 × 1.081². | $1.933B | $2.090B | $2.259B |
| 6. U. California, Los Angeles2024 base 1,896,227; 2026 = 2024 × 1.081². | $1.896B | $2.050B | $2.216B |
| 7. U. California, San Diego2024 base 1,881,289; 2026 = 2024 × 1.081². | $1.881B | $2.034B | $2.198B |
| 8. U. Washington, Seattle2024 base 1,691,302; 2026 = 2024 × 1.081². | $1.691B | $1.828B | $1.976B |
| 9. Stanford U.2024 base 1,641,961; 2026 = 2024 × 1.081². | $1.642B | $1.775B | $1.919B |
| 10. Cornell U.2024 base 1,613,631; 2026 = 2024 × 1.081². | $1.614B | $1.744B | $1.886B |
| 11. U. North Carolina, Chapel Hill2024 base 1,598,751; 2026 = 2024 × 1.081². | $1.599B | $1.728B | $1.868B |
| 12. Ohio State U.2024 base 1,581,570; 2026 = 2024 × 1.081². | $1.582B | $1.710B | $1.848B |
| 13. Duke U.2024 base 1,580,756; 2026 = 2024 × 1.081². | $1.581B | $1.709B | $1.847B |
| 14. U. Maryland2024 base 1,539,520; includes Baltimore and College Park as one research unit. | $1.540B | $1.664B | $1.799B |
| 15. Georgia Institute of Technology2024 base 1,528,637; 2026 = 2024 × 1.081². | $1.529B | $1.652B | $1.786B |
| 16. Yale U.2024 base 1,519,694; 2026 = 2024 × 1.081². | $1.520B | $1.643B | $1.776B |
| 17. U. Pittsburgh, Pittsburgh2024 base 1,504,665; 2026 = 2024 × 1.081². | $1.505B | $1.627B | $1.758B |
| 18. New York U.2024 base 1,500,732; 2026 = 2024 × 1.081². | $1.501B | $1.622B | $1.754B |
| 19. Harvard U.2024 base 1,494,527; 2026 = 2024 × 1.081². | $1.495B | $1.616B | $1.747B |
| 20. Columbia U. in the City of New York2024 base 1,449,535; 2026 = 2024 × 1.081². | $1.450B | $1.567B | $1.694B |
| 21. U. Minnesota, Twin Cities2024 base 1,409,710; 2026 = 2024 × 1.081². | $1.410B | $1.524B | $1.648B |
| 22. Texas A&M U., College Station and Health Science Center2024 base 1,393,825; 2026 = 2024 × 1.081². | $1.394B | $1.507B | $1.629B |
| 23. U. Texas M. D. Anderson Cancer Center2024 base 1,363,321; 2026 = 2024 × 1.081². | $1.363B | $1.474B | $1.593B |
| 24. Vanderbilt U. and Vanderbilt U. Medical Center2024 base 1,327,870; 2026 = 2024 × 1.081². | $1.328B | $1.435B | $1.552B |
| 25. Pennsylvania State U., University Park and Hershey Medical Center2024 base 1,302,971; 2026 = 2024 × 1.081². | $1.303B | $1.409B | $1.523B |
| 26. U. Florida2024 base 1,272,493; 2026 = 2024 × 1.081². | $1.272B | $1.376B | $1.487B |
| 27. U. Southern California2024 base 1,264,197; 2026 = 2024 × 1.081². | $1.264B | $1.367B | $1.477B |
| 28. Northwestern U.2024 base 1,257,859; 2026 = 2024 × 1.081². | $1.258B | $1.360B | $1.470B |
| 29. Emory U.2024 base 1,246,507; 2026 = 2024 × 1.081². | $1.247B | $1.348B | $1.457B |
| 30. Washington U., Saint Louis2024 base 1,243,115; 2026 = 2024 × 1.081². | $1.243B | $1.344B | $1.453B |
| 31. U. Texas, Austin2024 base 1,143,917; 2026 = 2024 × 1.081². | $1.144B | $1.237B | $1.337B |
| 32. U. California, Berkeley2024 base 1,126,782; 2026 = 2024 × 1.081². | $1.127B | $1.218B | $1.317B |
| 33. Massachusetts Institute of Technology2024 base 1,065,554; 2026 = 2024 × 1.081². | $1.066B | $1.152B | $1.245B |
| 34. Icahn School of Medicine at Mount Sinai2024 base 1,015,600; 2026 = 2024 × 1.081². | $1.016B | $1.098B | $1.187B |
| 35. U. Arizona2024 base 1,012,404; 2026 = 2024 × 1.081². | $1.012B | $1.094B | $1.183B |
| 36. U. California, Davis2024 base 1,005,757; 2026 = 2024 × 1.081². | $1.006B | $1.087B | $1.175B |
| 37. Arizona State U.2024 base 1,003,271; 2026 = 2024 × 1.081². | $1.003B | $1.085B | $1.172B |
| 38. Michigan State U.2024 base 931,848; 2026 = 2024 × 1.081². | $931.8M | $1.007B | $1.089B |
| 39. Purdue U., West Lafayette2024 base 931,513; 2026 = 2024 × 1.081². | $931.5M | $1.007B | $1.088B |
| 40. U. Illinois, Urbana-Champaign2024 base 906,751; 2026 = 2024 × 1.081². | $906.8M | $980.2M | $1.060B |
| 41. Indiana U., Bloomington2024 base 896,983; 2026 = 2024 × 1.081². | $897.0M | $969.6M | $1.048B |
| 42. Baylor C. of Medicine2024 base 881,226; 2026 = 2024 × 1.081². | $881.2M | $952.6M | $1.030B |
| 43. U. Texas Southwestern Medical Center2024 base 869,297; 2026 = 2024 × 1.081². | $869.3M | $939.7M | $1.016B |
| 44. U. Alabama, Birmingham2024 base 865,868; 2026 = 2024 × 1.081². | $865.9M | $936.0M | $1.012B |
| 45. Rutgers, State U. New Jersey, New Brunswick2024 base 836,800; 2026 = 2024 × 1.081². | $836.8M | $904.6M | $977.9M |
| 46. U. Virginia, Charlottesville2024 base 813,772; 2026 = 2024 × 1.081². | $813.8M | $879.7M | $950.9M |
| 47. U. Utah2024 base 789,271; 2026 = 2024 × 1.081². | $789.3M | $853.2M | $922.3M |
| 48. Boston U.2024 base 784,355; 2026 = 2024 × 1.081². | $784.4M | $847.9M | $916.6M |
| 49. U. Colorado Anschutz Medical Campus2024 base 741,643; 2026 = 2024 × 1.081². | $741.6M | $801.7M | $866.7M |
| 50. U. Cincinnati2024 base 739,878; 2026 = 2024 × 1.081². | $739.9M | $799.8M | $864.6M |
| 51. U. Colorado Boulder2024 base 717,920; 2026 = 2024 × 1.081². | $717.9M | $776.1M | $838.9M |
| 52. North Carolina State U.2024 base 717,004; 2026 = 2024 × 1.081². | $717.0M | $775.1M | $837.9M |
| 53. U. Iowa2024 base 703,326; 2026 = 2024 × 1.081². | $703.3M | $760.3M | $821.9M |
| 54. U. Chicago2024 base 680,753; 2026 = 2024 × 1.081². | $680.8M | $735.9M | $795.5M |
| 55. U. Nebraska, Lincoln and Medical Center2024 base 657,468; combined Lincoln, Medical Center, and Central Administration reporting unit. | $657.5M | $710.7M | $768.3M |
| 56. Virginia Polytechnic Institute and State U.2024 base 656,916; 2026 = 2024 × 1.081². | $656.9M | $710.1M | $767.6M |
| 57. U. California, Irvine2024 base 644,948; 2026 = 2024 × 1.081². | $644.9M | $697.2M | $753.7M |
| 58. Case Western Reserve U.2024 base 642,546; 2026 = 2024 × 1.081². | $642.5M | $694.6M | $750.9M |
| 59. U. Georgia2024 base 628,117; 2026 = 2024 × 1.081². | $628.1M | $679.0M | $734.0M |
| 60. Uniformed Services U. of the Health Sciences2024 base 569,050; 2026 = 2024 × 1.081². | $569.1M | $615.1M | $665.0M |
| 61. U. Miami2024 base 559,013; 2026 = 2024 × 1.081². | $559.0M | $604.3M | $653.2M |
| 62. Princeton U.2024 base 558,624; 2026 = 2024 × 1.081². | $558.6M | $603.9M | $652.8M |
| 63. U. Kansas2024 base 546,110; 2026 = 2024 × 1.081². | $546.1M | $590.3M | $638.2M |
| 64. Oregon Health and Science U.2024 base 545,214; 2026 = 2024 × 1.081². | $545.2M | $589.4M | $637.1M |
| 65. SUNY, U. Buffalo2024 base 541,880; 2026 = 2024 × 1.081². | $541.9M | $585.8M | $633.2M |
| 66. U. Illinois, Chicago2024 base 532,181; 2026 = 2024 × 1.081². | $532.2M | $575.3M | $621.9M |
| 67. U. Kentucky2024 base 527,658; 2026 = 2024 × 1.081². | $527.7M | $570.4M | $616.6M |
| 68. Virginia Commonwealth U.2024 base 524,295; 2026 = 2024 × 1.081². | $524.3M | $566.8M | $612.7M |
| 69. U. South Florida2024 base 521,892; consolidated Tampa, Saint Petersburg, and Sarasota-Manatee reporting unit. | $521.9M | $564.2M | $609.9M |
| 70. U. Missouri, Columbia2024 base 508,580; 2026 = 2024 × 1.081². | $508.6M | $549.8M | $594.3M |
| 71. Carnegie Mellon U.2024 base 505,262; 2026 = 2024 × 1.081². | $505.3M | $546.2M | $590.4M |
| 72. Scripps Research Institute2024 base 501,468; 2026 = 2024 × 1.081². | $501.5M | $542.1M | $586.0M |
| 73. U. Rochester2024 base 492,372; 2026 = 2024 × 1.081². | $492.4M | $532.3M | $575.4M |
| 74. U. Oklahoma2024 base 474,043; includes Tulsa, Norman, and Health Science Center campuses as one unit. | $474.0M | $512.4M | $553.9M |
| 75. SUNY, U. Albany2024 base 471,605; 2026 = 2024 × 1.081². | $471.6M | $509.8M | $551.1M |
| 76. Colorado State U., Fort Collins2024 base 466,386; 2026 = 2024 × 1.081². | $466.4M | $504.2M | $545.0M |
| 77. U. Delaware2024 base 465,780; 2026 = 2024 × 1.081². | $465.8M | $503.5M | $544.3M |
| 78. Iowa State U.2024 base 462,347; 2026 = 2024 × 1.081². | $462.3M | $499.8M | $540.3M |
| 79. Florida State U.2024 base 460,733; 2026 = 2024 × 1.081². | $460.7M | $498.1M | $538.4M |
| 80. Utah State U.2024 base 451,379; 2026 = 2024 × 1.081². | $451.4M | $487.9M | $527.5M |
| 81. California Institute of Technology2024 base 445,173; 2026 = 2024 × 1.081². | $445.2M | $481.2M | $520.2M |
| 82. U. Connecticut2024 base 433,545; 2026 = 2024 × 1.081². | $433.5M | $468.7M | $506.6M |
| 83. Louisiana State U., Baton Rouge2024 base 431,439; 2026 = 2024 × 1.081². | $431.4M | $466.4M | $504.2M |
| 84. U. Texas Health Science Center, Houston2024 base 419,123; 2026 = 2024 × 1.081². | $419.1M | $453.1M | $489.8M |
| 85. Dartmouth C. and Dartmouth Hitchcock Medical Center2024 base 418,429; 2026 = 2024 × 1.081². | $418.4M | $452.3M | $489.0M |
| 86. Washington State U.2024 base 403,369; 2026 = 2024 × 1.081². | $403.4M | $436.0M | $471.4M |
| 87. Auburn U., Auburn2024 base 393,557; 2026 = 2024 × 1.081². | $393.6M | $425.4M | $459.9M |
| 88. Wichita State U.2024 base 392,333; 2026 = 2024 × 1.081². | $392.3M | $424.1M | $458.5M |
| 89. U. Tennessee, Knoxville2024 base 386,949; includes Institute of Agriculture reporting note. | $386.9M | $418.3M | $452.2M |
| 90. George Washington U.2024 base 381,582; 2026 = 2024 × 1.081². | $381.6M | $412.5M | $445.9M |
| 91. Georgetown U.2024 base 376,600; 2026 = 2024 × 1.081². | $376.6M | $407.1M | $440.1M |
| 92. U. Hawaii, Manoa2024 base 375,631; 2026 = 2024 × 1.081². | $375.6M | $406.1M | $438.9M |
| 93. Brown U.2024 base 374,504; 2026 = 2024 × 1.081². | $374.5M | $404.8M | $437.6M |
| 94. Oregon State U.2024 base 371,904; 2026 = 2024 × 1.081². | $371.9M | $402.0M | $434.6M |
| 95. Albert Einstein C. of Medicine2024 base 360,789; 2026 = 2024 × 1.081². | $360.8M | $390.0M | $421.6M |
| 96. Medical C. Wisconsin2024 base 360,309; 2026 = 2024 × 1.081². | $360.3M | $389.5M | $421.0M |
| 97. U. New Mexico2024 base 354,874; 2026 = 2024 × 1.081². | $354.9M | $383.6M | $414.7M |
| 98. U. Massachusetts, Medical School2024 base 349,616; 2026 = 2024 × 1.081². | $349.6M | $377.9M | $408.5M |
| 99. Northeastern U.2024 base 346,900; 2026 = 2024 × 1.081². | $346.9M | $375.0M | $405.4M |
| 100. U. Notre Dame2024 base 345,791; 2026 = 2024 × 1.081². | $345.8M | $373.8M | $404.1M |
Source snapshot: NSF/NCSES HERD FY 2024 Table 6 for official FY 2024 base values. 2025 and 2026 are calculated scenario values, not official NCSES institution-level releases. The row data-value attribute stores calculated 2026 dollars in thousands.
Insights
Johns Hopkins is the dominant outlier. Its 2026 scenario value is $4.825B, almost twice the second-ranked University of Pennsylvania.
Medical schools and biomedical research shape the upper tier. UCSF, Duke, Yale, Pittsburgh, NYU, MD Anderson, Vanderbilt, Baylor, and several other medical-heavy institutions rank high by expenditure scale.
University of California campuses are repeatedly visible in the upper half: San Francisco, Los Angeles, San Diego, Berkeley, Davis, and Irvine all rank in the Top 60.
Defense, engineering, and applied research matter. Johns Hopkins includes APL, Georgia Tech has a major engineering and applied research profile, and Purdue, Virginia Tech, and Carnegie Mellon remain prominent technology-focused performers.
The Top 100 is not simply a list of famous universities. It is a spending-scale ranking shaped by medical centers, federal funding, applied laboratories, engineering portfolios, combined reporting units, and the accounting boundaries used in HERD.
What it means
R&D expenditure scale shows where large research portfolios are concentrated. For policymakers, it indicates where major federal, medical, engineering, and institutional research flows are being administered. For universities, it helps benchmark research scale against peers, but it should not be treated as a quality ranking.
A large R&D expenditure total can reflect clinical research, sponsored projects, defense work, specialized laboratories, medical schools, or system-level reporting. A lower rank does not mean weaker research quality; it may mean a smaller medical school footprint, a narrower research portfolio, or a different institutional mission.
The 2026 numbers should be read as a transparent scenario based on the latest official FY 2024 institution values and one sector-wide growth assumption. They are useful for scale comparison, but not for judging actual future budgets at individual universities.
Download the Top 100 U.S. Universities by R&D Expenditures 2026 Forecast dataset
Top 100 U.S. Universities by R&D Expenditures 2026 Forecast
100 ranked entries · Excel + CSV + methodology + sources + chart · Snapshot: FY2024 NSF/NCSES HERD base / modeled 2026 scenario · Version 1.0
No signup required. The archive includes machine-readable data, methodology and source documentation. Quick human verification is required before the ZIP is delivered.
Download Excel + CSV Data PackFAQ
Which U.S. university spends the most on R&D?
Johns Hopkins U. ranks first in the FY 2024 HERD base data and remains first in the 2026 scenario. Its official FY 2024 value is $4.129B, and its calculated 2026 scenario value is $4.825B.
Is this an official 2026 NSF ranking?
No. The official institution-level base is FY 2024. The 2025 and 2026 values are calculated from the FY 2024 base using a uniform 8.1% annual growth assumption.
Why is Johns Hopkins so far ahead?
The HERD reporting unit for Johns Hopkins includes the Applied Physics Laboratory, which contributes a very large amount of R&D expenditure. That reporting boundary makes Johns Hopkins a scale outlier.
Does higher R&D spending mean better research?
No. The metric measures expenditure scale. It does not measure citation impact, discovery quality, patents, research efficiency, faculty productivity, or teaching outcomes.
Why do the 2026 ranks match the FY 2024 ranks?
The same multiplier is applied to every institution. Multiplying every row by the same factor changes the values but not the order.
Why do medical universities rank so high?
Health sciences, biomedical research, clinical trials, and federally funded medical research can create very large separately accounted-for R&D expenditure totals.
Why are some rows combined reporting units?
HERD uses institutional reporting units. Some universities report combined campuses or special units, such as University of Maryland, University of Nebraska, University of Oklahoma, and Johns Hopkins with APL.
What is the main limitation of this forecast?
The growth assumption is national and historical. It does not predict institution-specific grant wins, losses, appropriations, clinical trial volumes, state support, or capital shifts.
Sources
NSF/NCSES HERD FY 2024 Data Tables, Table 6
Primary numeric source for institution rank and official FY 2024 total R&D expenditure base values, reported in dollars in thousands.
https://ncses.nsf.gov/pubs/nsf26304/assets/nsf26304.pdfNSF/NCSES HERD Survey 2024
Survey page for HERD methodology, data tables, definitions, and detailed FY 2024 release materials.
https://ncses.nsf.gov/surveys/higher-education-research-development/2024NCSES InfoBrief NSF 26-305
Source for the FY 2024 national HERD growth parameter: total higher education R&D expenditures were 8.1% greater than FY 2023.
https://ncses.nsf.gov/pubs/nsf26305NSF/NCSES Academic Institution Profiles
Supplementary source for institution profile context and historical ranking access by total R&D expenditures.
https://ncsesdata.nsf.gov/profiles/site?ds=herd&method=rankingBySourceRelated rankings
More StatRanker rankings on public finance, tax burden, debt and government spending.
