

Top 100 Companies by R&D Spending, 2026
Article updated: April 26, 2026
Top corporate R&D investors shaping AI, pharma, chips and industrial technology
This ranking compares the world’s 100 largest corporate research and development spenders using the latest available company-account data. The 2026 edition uses the latest complete Scoreboard dataset available for publication: the 2025 EU Industrial R&D Investment Scoreboard, which reports financial year 2024 R&D investment for the world’s top corporate R&D investors. Values are shown in billions of euros and should be read as annual R&D input, not as a direct measure of innovation quality, patent value or stock-market potential.
What the R&D spending ranking measures
Corporate R&D spending measures how much a company commits to research, product development, engineering, clinical trials, software platforms, semiconductor design, manufacturing technology and future product pipelines. It is especially important in 2026 because the largest R&D budgets are tied to the AI build-out, cloud infrastructure, drug discovery, semiconductor process nodes, electric vehicles, autonomy, batteries and software-defined industrial systems.
Continue exploring
More StatRanker rankings on public finance, tax burden, debt and government spending.
Top 100 Global Companies by R&D Spending
Open rankingTop 100 Countries by R&D Spending as a Share of GDP, 2025
Open rankingTop 100 Countries by E-Government Development Index, 2025
Open rankingThe top of the list is not simply a list of the biggest companies by revenue or market capitalization. A company can be enormous but not especially R&D-intensive, while a smaller pharma, chip or biotech group may spend a much larger share of sales on research. The ranking is therefore most useful when read together with sector context.
R&D investment of about €65.0bn makes Amazon the largest corporate R&D investor in the 2025 Scoreboard snapshot.
ICT software and ICT hardware together account for the largest share of global corporate R&D, reflecting AI, cloud, chips and platform engineering.
The upper tier spans mega-cap platform companies, chipmakers, pharma groups and automotive manufacturers.
High R&D spending does not automatically mean better products, stronger patents or higher future returns.
Why the top of the ranking is concentrated in technology, health, semiconductors and autos
The Top 20 is dominated by four research-heavy business models. Large technology platforms spend heavily on AI infrastructure, cloud services, advertising systems, operating systems, consumer devices and platform security. Pharmaceutical and biotechnology companies spend heavily because discovery, trials and regulatory approval require long, expensive pipelines. Semiconductor firms invest in chip architecture, process technology, packaging and manufacturing equipment. Automotive companies remain large R&D investors because electrification, autonomy, software-defined vehicles and safety systems require multi-year engineering programs.
Amazon, Alphabet, Meta, Microsoft and Apple sit at the center of the AI and platform economy. Their R&D budgets are unusually large because software, data centers, chips, AI models and product ecosystems now reinforce one another. Below them, Samsung, Huawei, Intel, TSMC and NVIDIA show the capital- and knowledge-intensive nature of the chip industry, while Volkswagen and Toyota show why the automotive transition remains one of the largest industrial R&D projects in the world.
Amazon
The leading position reflects cloud infrastructure, AI systems, logistics technology, devices, marketplace software and large-scale platform engineering.
Alphabet
Spending is linked to AI models, search, cloud, YouTube infrastructure, Android, chips, security and long-horizon research.
Meta Platforms
A very large budget reflects generative AI, recommendation systems, social platforms, infrastructure and mixed-reality development.
Microsoft
R&D supports Azure, AI services, enterprise software, developer platforms, security, gaming and productivity systems.
Apple
Apple’s R&D is tied to silicon, devices, operating systems, services, wearables, privacy engineering and product ecosystems.
Samsung Electronics
Spending spans memory, foundry, displays, smartphones, advanced electronics and manufacturing technology.
Volkswagen
The budget reflects electrification, platform engineering, batteries, software, emissions systems, safety and model renewal.
Huawei
R&D supports telecom equipment, devices, enterprise systems, cloud, chips, AI and resilience under technology restrictions.
Roche
Roche ranks highly because pharmaceuticals and diagnostics require continuous investment in discovery, trials and regulatory pipelines.
Toyota Motor
Toyota’s spending reflects hybrid systems, EVs, batteries, safety, manufacturing processes, software and vehicle platforms.
Top 20 companies by R&D spending
| Rank | Company | R&D spending | Sector |
|---|---|---|---|
| 1 | Amazon | €65.0bn | ICT software |
| 2 | Alphabet | €47.2bn | ICT software |
| 3 | Meta Platforms | €40.5bn | ICT software |
| 4 | Microsoft | €33.7bn | ICT software |
| 5 | Apple | €29.4bn | ICT hardware |
| 6 | Samsung Electronics | €24.8bn | ICT hardware |
| 7 | Volkswagen | €23.4bn | Automotive |
| 8 | Huawei | €22.8bn | ICT hardware |
| 9 | Roche | €15.7bn | Health |
| 10 | Toyota Motor | €14.3bn | Automotive |
| 11 | Intel | €14.1bn | ICT hardware |
| 12 | NVIDIA | €13.9bn | ICT hardware |
| 13 | Merck & Co. | €13.7bn | Health |
| 14 | Johnson & Johnson | €13.4bn | Health |
| 15 | Novartis | €13.0bn | Health |
| 16 | TSMC | €12.7bn | ICT hardware |
| 17 | Pfizer | €12.4bn | Health |
| 18 | AstraZeneca | €12.1bn | Health |
| 19 | Bosch | €11.9bn | Industrials |
| 20 | Bayer | €11.6bn | Health |
Charts: the scale and sector structure of corporate R&D
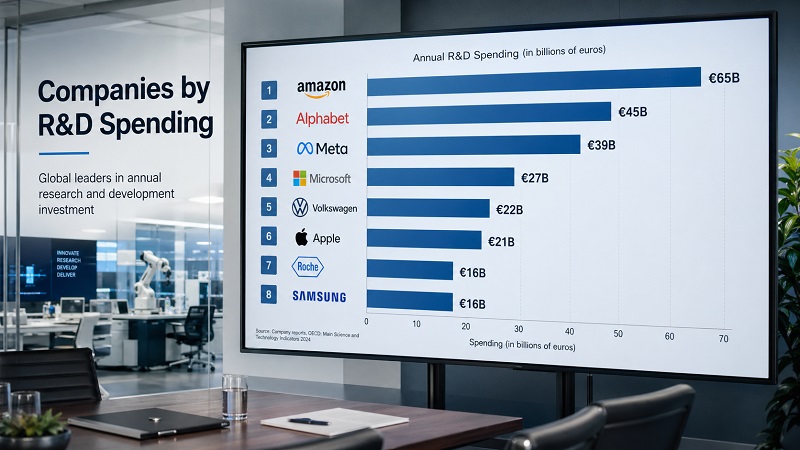
The first chart shows why R&D spending is concentrated at the top: the gap between the first five companies and the rest of the table is large. The second chart groups the Top 100 by sector, showing that these companies are better understood through innovation capacity than through revenue or market value alone.
Chart 1. Top 20 companies by R&D spending
Chart 2. Top 100 R&D spending by sector
Main ranking table: Top 100 companies by R&D spending
Search by company, compare sectors and switch between Top 10, Top 20, Top 50 and All 100. Spending values are rounded to one decimal billion euros. The share column is calculated against the rounded Top 100 total used on this page, not against all global business R&D. For formal research, use the downloadable JRC Scoreboard dataset as the reference file.
| Rank | Company | R&D spending | Sector |
|---|---|---|---|
| 1 | Amazon | €65.0bn8.94% | ICT software |
| 2 | Alphabet | €47.2bn6.49% | ICT software |
| 3 | Meta Platforms | €40.5bn5.57% | ICT software |
| 4 | Microsoft | €33.7bn4.63% | ICT software |
| 5 | Apple | €29.4bn4.04% | ICT hardware |
| 6 | Samsung Electronics | €24.8bn3.41% | ICT hardware |
| 7 | Volkswagen | €23.4bn3.22% | Automotive |
| 8 | Huawei | €22.8bn3.14% | ICT hardware |
| 9 | Roche | €15.7bn2.16% | Health |
| 10 | Toyota Motor | €14.3bn1.97% | Automotive |
| 11 | Intel | €14.1bn1.94% | ICT hardware |
| 12 | NVIDIA | €13.9bn1.91% | ICT hardware |
| 13 | Merck & Co. | €13.7bn1.88% | Health |
| 14 | Johnson & Johnson | €13.4bn1.84% | Health |
| 15 | Novartis | €13.0bn1.79% | Health |
| 16 | TSMC | €12.7bn1.75% | ICT hardware |
| 17 | Pfizer | €12.4bn1.71% | Health |
| 18 | AstraZeneca | €12.1bn1.66% | Health |
| 19 | Bosch | €11.9bn1.64% | Industrials |
| 20 | Bayer | €11.6bn1.60% | Health |
| 21 | Bristol Myers Squibb | €11.3bn1.55% | Health |
| 22 | Eli Lilly | €11.1bn1.53% | Health |
| 23 | Sanofi | €10.8bn1.49% | Health |
| 24 | General Motors | €10.6bn1.46% | Automotive |
| 25 | Mercedes-Benz | €10.4bn1.43% | Automotive |
| 26 | Ford Motor | €10.1bn1.39% | Automotive |
| 27 | BMW | €9.9bn1.36% | Automotive |
| 28 | Oracle | €9.7bn1.33% | ICT software |
| 29 | Cisco Systems | €9.5bn1.31% | ICT hardware |
| 30 | ASML | €9.3bn1.28% | ICT hardware |
| 31 | Broadcom | €9.1bn1.25% | ICT hardware |
| 32 | Qualcomm | €8.9bn1.22% | ICT hardware |
| 33 | Alibaba | €8.7bn1.20% | ICT software |
| 34 | Tencent | €8.5bn1.17% | ICT software |
| 35 | Siemens | €8.3bn1.14% | Industrials |
| 36 | Sony | €8.1bn1.11% | ICT hardware |
| 37 | Honda Motor | €7.9bn1.09% | Automotive |
| 38 | Stellantis | €7.8bn1.07% | Automotive |
| 39 | ByteDance | €7.6bn1.05% | ICT software |
| 40 | SAP | €7.4bn1.02% | ICT software |
| 41 | Amgen | €7.2bn0.99% | Health |
| 42 | Gilead Sciences | €7.0bn0.96% | Health |
| 43 | AbbVie | €6.9bn0.95% | Health |
| 44 | Boeing | €6.7bn0.92% | Aerospace & defence |
| 45 | Airbus | €6.6bn0.91% | Aerospace & defence |
| 46 | Tesla | €6.4bn0.88% | Automotive |
| 47 | BYD | €6.3bn0.87% | Automotive |
| 48 | Hyundai Motor | €6.1bn0.84% | Automotive |
| 49 | Kia | €6.0bn0.83% | Automotive |
| 50 | Renault | €5.8bn0.80% | Automotive |
| 51 | Ericsson | €5.7bn0.78% | ICT hardware |
| 52 | Nokia | €5.6bn0.77% | ICT hardware |
| 53 | AMD | €5.5bn0.76% | ICT hardware |
| 54 | Micron Technology | €5.4bn0.74% | ICT hardware |
| 55 | SK Hynix | €5.3bn0.73% | ICT hardware |
| 56 | Medtronic | €5.2bn0.72% | Health |
| 57 | Danaher | €5.1bn0.70% | Health |
| 58 | Thermo Fisher Scientific | €5.0bn0.69% | Health |
| 59 | GlaxoSmithKline | €4.9bn0.67% | Health |
| 60 | Novo Nordisk | €4.8bn0.66% | Health |
| 61 | BASF | €4.7bn0.65% | Chemicals |
| 62 | Dow | €4.6bn0.63% | Chemicals |
| 63 | Mitsubishi Electric | €4.5bn0.62% | Industrials |
| 64 | Hitachi | €4.4bn0.61% | Industrials |
| 65 | Panasonic | €4.3bn0.59% | ICT hardware |
| 66 | LG Electronics | €4.2bn0.58% | ICT hardware |
| 67 | Dell Technologies | €4.1bn0.56% | ICT hardware |
| 68 | HP Inc. | €4.0bn0.55% | ICT hardware |
| 69 | Salesforce | €3.9bn0.54% | ICT software |
| 70 | Adobe | €3.8bn0.52% | ICT software |
| 71 | ServiceNow | €3.7bn0.51% | ICT software |
| 72 | Netflix | €3.6bn0.50% | ICT software |
| 73 | Baidu | €3.5bn0.48% | ICT software |
| 74 | JD.com | €3.4bn0.47% | ICT software |
| 75 | ZTE | €3.3bn0.45% | ICT hardware |
| 76 | Xiaomi | €3.2bn0.44% | ICT hardware |
| 77 | Lenovo | €3.1bn0.43% | ICT hardware |
| 78 | Applied Materials | €3.0bn0.41% | ICT hardware |
| 79 | Lam Research | €2.9bn0.40% | ICT hardware |
| 80 | KLA | €2.8bn0.39% | ICT hardware |
| 81 | Tokyo Electron | €2.8bn0.39% | ICT hardware |
| 82 | Nissan Motor | €2.7bn0.37% | Automotive |
| 83 | Mazda Motor | €2.7bn0.37% | Automotive |
| 84 | Subaru | €2.6bn0.36% | Automotive |
| 85 | Volvo Cars | €2.6bn0.36% | Automotive |
| 86 | Continental | €2.5bn0.34% | Automotive |
| 87 | ZF Friedrichshafen | €2.5bn0.34% | Automotive |
| 88 | Lockheed Martin | €2.4bn0.33% | Aerospace & defence |
| 89 | RTX | €2.4bn0.33% | Aerospace & defence |
| 90 | Northrop Grumman | €2.3bn0.32% | Aerospace & defence |
| 91 | L3Harris Technologies | €2.3bn0.32% | Aerospace & defence |
| 92 | Regeneron | €2.2bn0.30% | Health |
| 93 | Vertex Pharmaceuticals | €2.2bn0.30% | Health |
| 94 | Moderna | €2.1bn0.29% | Health |
| 95 | Biogen | €2.1bn0.29% | Health |
| 96 | Takeda Pharmaceutical | €2.0bn0.28% | Health |
| 97 | Daiichi Sankyo | €2.0bn0.28% | Health |
| 98 | Mitsubishi Chemical | €1.9bn0.26% | Chemicals |
| 99 | 3M | €1.9bn0.26% | Industrials |
| 100 | Caterpillar | €1.8bn0.25% | Industrials |
Source basis: European Commission / Joint Research Centre, 2025 EU Industrial R&D Investment Scoreboard, financial year 2024 company-account data. Updated for this page on 26 April 2026. Values are rounded to one decimal billion euros; sector names are harmonised for readability. Company filings and the downloadable Scoreboard dataset should be treated as the reference version for formal work.
Methodology
The ranking uses corporate research and development investment reported in company financial accounts. The main source is the European Commission’s Joint Research Centre Industrial R&D Investment Scoreboard, which compiles economic and financial information for the world’s largest corporate R&D investors. The 2026 edition of this page uses the latest available complete Scoreboard dataset, based on financial year 2024 accounts published in the 2025 Scoreboard. The table is designed for analytical reading; formal research should use the downloadable Scoreboard file and company filings as the reference version.
R&D spending is shown in billions of euros and rounded to one decimal place. Company names are normalised for readability, while sector labels are grouped into broad categories: ICT software, ICT hardware, health, automotive, industrials, chemicals, and aerospace & defence. These sector groups are used to make the page easier to interpret; detailed accounting classifications can differ across companies and reporting jurisdictions.
The share figure in the table is calculated against the rounded Top 100 total used on this page. It is not a share of all global business R&D. The broader Scoreboard covers the world’s top 2,000 R&D investors, which together account for the great majority of business-funded R&D. The Top 100 table therefore captures the most visible part of global corporate research spending, but it does not capture all private R&D, smaller private firms, university research, public laboratories or defence programmes reported outside company accounts.
The main limitation is that R&D spending is an input measure. It tells us how much a company spends, not whether that spending produces valuable patents, successful drugs, better chips, safer cars or stronger software. Accounting rules also matter. Some companies expense R&D immediately, while others may capitalise parts of development spending. Pharmaceutical R&D is shaped by clinical trials and regulatory risk; software R&D is shaped by engineering talent, infrastructure and data; semiconductor R&D is tied to design, process technology and equipment. Direct comparison is useful, but it must be read with sector context.
The ranking should be read as a spending comparison, not as a measure of patent quality, product success, stock quality or future returns. It uses the latest complete Scoreboard dataset available for the 2026 page edition.
Insights from the 2026 R&D spending ranking
The top tier is now an AI and platform story
The most striking pattern is the weight of US technology platforms. Amazon, Alphabet, Meta, Microsoft and Apple together represent an unusually concentrated block of corporate R&D. Their budgets are not limited to traditional software coding. They include AI models, data-center systems, chips, cybersecurity, devices, cloud services and platform infrastructure. This explains why R&D spending is now closely linked to the AI race.
Health remains structurally R&D-intensive
Pharmaceutical and biotech companies appear throughout the upper and middle parts of the list. Their spending reflects discovery, trials, regulatory submissions and pipeline renewal. Unlike software, where products can scale rapidly after development, pharma often requires years of preclinical and clinical work before a product reaches the market.
Semiconductors sit behind both AI and industrial policy
Semiconductor companies rank highly because the sector requires constant investment in architecture, process nodes, packaging, lithography, memory and manufacturing technology. TSMC, Samsung, Intel, NVIDIA, ASML and other chip-related firms are not only commercial companies; they are also strategic nodes in global technology competition.
Automotive R&D is being rewritten
Large auto manufacturers remain major R&D spenders, but the reason is changing. Traditional model development is now combined with electrification, batteries, software-defined vehicle platforms, autonomous systems, safety, manufacturing automation and emissions compliance. This is why Volkswagen, Toyota, Mercedes-Benz, Ford, BMW, BYD and other automakers remain prominent.
The middle of the Top 100 is more diverse. It includes industrial automation, aerospace, telecom equipment, chemicals, medical devices, enterprise software and semiconductor equipment. These companies may not receive as much public attention as consumer AI platforms, but many of them provide the production systems, chips, sensors, aircraft technologies, enterprise tools and scientific instruments that make the wider innovation economy function.
What this means for readers
This ranking helps readers understand where the future economy is being financed. A high R&D budget signals that a company is trying to build future capabilities, whether in AI, drugs, chips, vehicles, cloud infrastructure, diagnostics, industrial automation or materials. It also shows which sectors require heavy, repeated investment just to remain competitive.
For technology readers, the page shows why AI is not only a software trend. The companies at the top are investing in models, chips, cloud capacity, data centers, devices and developer ecosystems. For healthcare readers, the ranking explains why pharma companies require large research budgets even when near-term product launches are uncertain. For industrial readers, the table shows how automotive, aerospace, chemicals and manufacturing technology remain deeply research-driven.
The important caution is that more R&D does not automatically mean a better company, a safer investment or a stronger product pipeline. Large firms may spend more because they operate at greater scale, because regulation is costly, because existing products need renewal or because competition is intense. The best use of the ranking is to compare sectors, understand innovation concentration and identify which regions and industries are funding the next generation of technology.
FAQ
What does R&D spending mean in this ranking?
It means the amount a company reports as research and development investment or expense in its financial accounts. Depending on the company and accounting rules, this can include research teams, engineering, software development, clinical trials, product development, prototypes, chip design, manufacturing technology and other innovation-related work.
Why does Amazon rank first?
Amazon’s R&D investment is exceptionally large because the company operates across cloud computing, AI infrastructure, logistics technology, marketplace systems, devices, advertising technology and software platforms. The 2025 Scoreboard includes Amazon as the leading corporate R&D investor.
Can R&D spending be compared directly across sectors?
It can be compared as a financial input, but the interpretation must be sector-specific. A pharma company spends heavily on clinical trials and regulatory pipelines; a semiconductor firm spends on chip architecture and process technology; a software platform spends on engineering, AI and infrastructure. The same euro amount can mean different things in different sectors.
Is the company with the highest R&D spending always the most innovative?
No. Spending is not the same as output. A company can spend heavily and still fail to produce successful products. Another company can spend less but have a more focused research pipeline or higher R&D intensity. To judge innovation quality, R&D spending should be combined with patents, product launches, scientific output, revenue from new products and sector-specific performance.
Why is this called a 2026 ranking if the data year is 2024?
Corporate R&D rankings depend on audited financial accounts, which appear with a reporting lag. The 2026 page uses the latest complete Scoreboard dataset available for publication, based on financial year 2024 company accounts in the 2025 EU Industrial R&D Investment Scoreboard. It is a 2026 snapshot, not a forecast of full-year 2026 spending.
What is the difference between R&D spending and R&D intensity?
R&D spending is the absolute amount invested. R&D intensity is R&D spending as a percentage of revenue. Very large companies often dominate absolute spending, while smaller biotech, software or semiconductor firms can have higher intensity because research is a larger share of their business model.
Why do pharma, semiconductor and automotive companies appear so often?
These sectors require long-term, expensive development cycles. Pharma must fund discovery and trials; semiconductors require continuous work on chip design, process nodes and manufacturing equipment; automotive companies must develop vehicle platforms, batteries, software, autonomy, safety and emissions systems. Their competitiveness depends on sustained R&D.
Sources
The page prioritises official and primary sources. Company-level values are based on the European Commission / JRC Scoreboard framework. For formal research, the downloadable Scoreboard dataset and company filings should be used as the reference version.
Related rankings
More StatRanker rankings on public finance, tax burden, debt and government spending.
Top 100 Countries by Fixed Broadband Subscriptions per 100 People
Open rankingTop 100 Countries by Global Cybersecurity Index: 2026 Snapshot Based on Latest Official 2024 Data
Open rankingCountries by Mobile Data Price, 2026
Open rankingCountries by Internet Price, 2026
Open rankingStatRanker (Website)
administrator
