

Top 100 Companies by Number of Employees, 2026
Article updated: April 26, 2026
Largest Corporate Workforces in the 2026 Snapshot
This ranking compares the world’s largest publicly reported corporate employers by number of employees. The metric is easy to read, but it reveals a major part of corporate scale: how many people a company directly employs across stores, warehouses, factories, offices, delivery networks, branches, call centers and service operations. The 2026 edition uses the latest available reported workforce figures, mostly from recent annual reports, company filings and structured public-company datasets. It is a workforce snapshot, not a live payroll count.
Employee counts show operational scale rather than corporate value. Walmart and Amazon employ far more people than many higher-market-cap technology firms because retail, logistics and distribution require large front-line teams. Manufacturing groups such as BYD, Foxconn and Volkswagen also rank highly because global production networks remain labour-intensive even as automation expands.
Continue exploring
More StatRanker pages connected by topic, category or ranking theme.
Largest employer
Around 2.1 million employees, reflecting the scale of its store network, supply chain, clubs, distribution centers and U.S. retail operations.
Top 10 range
The tenth-ranked company still reports roughly 580,000 employees, showing how concentrated workforce scale is among retail, logistics, food-service, consulting and manufacturing giants.
Sector concentration
The upper ranks are dominated by businesses that need large distributed workforces: retail chains, e-commerce logistics, electronics assembly, automotive production and outsourced services.
Main limitation
Companies do not always define employees in the same way. Some include part-time and seasonal workers; contractors, franchise employees and agency workers may be excluded unless disclosed together.
Why retailers, logistics groups and manufacturers lead the ranking
The Top 20 is not a list of the world’s most valuable companies. It is a list of organizations with very large operating footprints. Walmart and Amazon sit at the top because they combine huge retail or e-commerce demand with store, warehouse, delivery and support networks. BYD, Foxconn and Volkswagen show the role of manufacturing scale. Accenture, Teleperformance, Concentrix, TCS and Compass Group show another pattern: service businesses can become massive employers when their revenue model depends on people deployed across many client sites and countries.
Technology firms stand out for the opposite reason. Microsoft appears in the Top 100, but not near the top, because software and cloud businesses can generate enormous revenue and market value with fewer employees than retailers or logistics companies. This is why employee count should be interpreted together with sector, labour intensity and business model.
Top 10 companies by employees
Walmart
2,100,000 employees. A vast global retail network, U.S. supercenters, Sam’s Club operations and distribution infrastructure keep Walmart at the top of corporate employment rankings.
Amazon
1,546,000 employees. The company’s workforce reflects e-commerce fulfillment, logistics, cloud operations, corporate functions and customer support across many countries.
BYD
968,900 employees. Rapid expansion in electric vehicles, batteries and manufacturing gives BYD one of the largest industrial workforces in the world.
JD.com
900,000 employees. JD.com combines e-commerce, warehouses, delivery networks and logistics services, creating a very large operational workforce.
Foxconn
826,608 employees. Electronics assembly and contract manufacturing remain highly labour-intensive despite automation and robotics investment.
Accenture
791,000 employees. Consulting, outsourcing, technology delivery and managed services create a large global professional workforce.
Volkswagen
656,134 employees. A multi-brand automotive group with global factories, engineering teams, sales networks and financial services operations.
Tata Consultancy Services
607,979 employees. Large-scale IT services, consulting and outsourcing contracts require extensive delivery teams across India and international markets.
DHL Group
594,879 employees. Parcel delivery, freight forwarding, contract logistics and postal operations create one of the largest logistics workforces globally.
Compass Group
580,000 employees. Food services across offices, schools, hospitals, stadiums and industrial sites require a very large site-based workforce.
Short table: Top 20 largest reported corporate employers
| Rank | Company | Employees | Sector |
|---|---|---|---|
| 1 | Walmart | 2,100,000 | Retail |
| 2 | Amazon | 1,546,000 | E-commerce & logistics |
| 3 | BYD | 968,900 | Automotive & manufacturing |
| 4 | JD.com | 900,000 | E-commerce & logistics |
| 5 | Foxconn (Hon Hai Precision Industry) | 826,608 | Electronics manufacturing |
| 6 | Accenture | 791,000 | Professional services |
| 7 | Volkswagen | 656,134 | Automotive & manufacturing |
| 8 | Tata Consultancy Services | 607,979 | IT services |
| 9 | DHL Group (Deutsche Post) | 594,879 | Logistics |
| 10 | Compass Group | 580,000 | Food services |
| 11 | JD Logistics | 498,709 | Logistics |
| 12 | United Parcel Service | 490,000 | Logistics |
| 13 | Home Depot | 470,000 | Retail |
| 14 | Gazprom | 468,000 | Energy |
| 15 | China Mobile | 455,405 | Telecommunications |
| 16 | Agricultural Bank of China | 454,716 | Banking & finance |
| 17 | Concentrix | 450,000 | Business services |
| 18 | Teleperformance | 446,052 | Business services |
| 19 | Target | 440,000 | Retail |
| 20 | ICBC | 419,252 | Banking & finance |
Employee counts are latest reported figures and may reflect different fiscal-year reporting dates. Values are rounded or reproduced as disclosed by companies and structured public-company datasets.
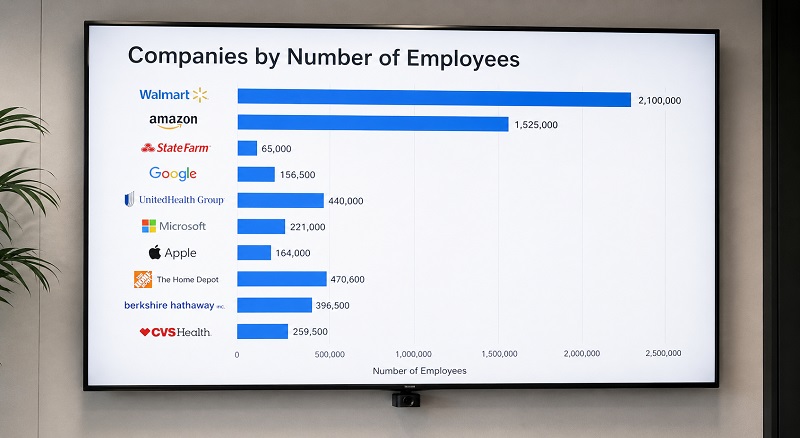
Charts: workforce scale and sector mix
The charts make the pattern visible: workforce scale follows operating model more than market capitalization. The largest bars belong to companies built around stores, warehouses, factories, delivery routes, branches and client-service teams.
- Walmart — 2,100,000
- Amazon — 1,546,000
- BYD — 968,900
- JD.com — 900,000
- Foxconn — 826,608
- Accenture — 791,000
- Volkswagen — 656,134
- Tata Consultancy Services — 607,979
- DHL Group — 594,879
- Compass Group — 580,000
Retail, logistics, manufacturing, IT services, banking and business services account for most of the Top 100. This reflects industries where physical networks, client delivery teams or branch systems require large headcounts.
Top 100 companies by number of employees, 2026 edition
The main table ranks 100 publicly reported corporate employers by latest available employee count. The default view highlights the Top 20; choose “All 100” to scan the full ranking.
| Rank | Company | Employees | Sector |
|---|---|---|---|
| 1 | Walmart | 2,100,000 | Retail |
| 2 | Amazon | 1,546,000 | E-commerce & logistics |
| 3 | BYD | 968,900 | Automotive & manufacturing |
| 4 | JD.com | 900,000 | E-commerce & logistics |
| 5 | Foxconn (Hon Hai Precision Industry) | 826,608 | Electronics manufacturing |
| 6 | Accenture | 791,000 | Professional services |
| 7 | Volkswagen | 656,134 | Automotive & manufacturing |
| 8 | Tata Consultancy Services | 607,979 | IT services |
| 9 | DHL Group (Deutsche Post) | 594,879 | Logistics |
| 10 | Compass Group | 580,000 | Food services |
| 11 | JD Logistics | 498,709 | Logistics |
| 12 | United Parcel Service | 490,000 | Logistics |
| 13 | Home Depot | 470,000 | Retail |
| 14 | Gazprom | 468,000 | Energy |
| 15 | China Mobile | 455,405 | Telecommunications |
| 16 | Agricultural Bank of China | 454,716 | Banking & finance |
| 17 | Concentrix | 450,000 | Business services |
| 18 | Teleperformance | 446,052 | Business services |
| 19 | Target | 440,000 | Retail |
| 20 | ICBC | 419,252 | Banking & finance |
| 21 | Marriott International | 418,000 | Hospitality |
| 22 | Kroger | 410,000 | Retail |
| 23 | UnitedHealth Group | 400,000 | Healthcare |
| 24 | PetroChina | 398,440 | Energy |
| 25 | Berkshire Hathaway | 392,400 | Conglomerate |
| 26 | FEMSA | 390,156 | Retail & beverages |
| 27 | Ahold Delhaize | 390,000 | Retail |
| 28 | Toyota | 389,144 | Automotive & manufacturing |
| 29 | China Construction Bank | 376,847 | Banking & finance |
| 30 | TJX Companies | 364,000 | Retail |
| 31 | China State Construction Engineering | 361,249 | Construction & infrastructure |
| 32 | Starbucks | 361,000 | Restaurants & retail |
| 33 | Magnit | 357,000 | Retail |
| 34 | Sinopec | 355,952 | Energy |
| 35 | Cognizant Technology Solutions | 343,800 | IT services |
| 36 | TriNet | 343,025 | Business services |
| 37 | Capgemini | 341,118 | IT services |
| 38 | Tesco | 340,000 | Retail |
| 39 | NTT (Nippon Telegraph & Telephone) | 338,467 | Telecommunications |
| 40 | Securitas AB | 336,000 | Security services |
| 41 | Costco | 333,000 | Retail |
| 42 | Siemens | 327,000 | Industrial technology |
| 43 | X5 Retail Group | 325,000 | Retail |
| 44 | Infosys | 323,788 | IT services |
| 45 | PepsiCo | 319,000 | Food & beverages |
| 46 | Sodexo | 317,177 | Food services |
| 47 | JPMorgan Chase | 317,160 | Banking & finance |
| 48 | Bank of China | 312,757 | Banking & finance |
| 49 | Insperity | 306,023 | Business services |
| 50 | Carrefour | 305,309 | Retail |
| 51 | CK Hutchison Holdings | 300,000 | Conglomerate |
| 52 | FedEx | 300,000 | Logistics |
| 53 | Lowe's Companies | 300,000 | Retail |
| 54 | China Railway Group | 299,652 | Construction & infrastructure |
| 55 | Sumitomo Electric Industries | 293,266 | Industrial manufacturing |
| 56 | Sberbank | 287,866 | Banking & finance |
| 57 | Albertsons | 285,000 | Retail |
| 58 | Vinci | 279,426 | Construction & infrastructure |
| 59 | China Telecom | 278,539 | Telecommunications |
| 60 | Luxshare Precision | 278,103 | Electronics manufacturing |
| 61 | Ping An Insurance | 273,053 | Insurance & finance |
| 62 | IBM | 270,300 | IT services |
| 63 | JBS | 270,000 | Food production |
| 64 | Nestlé | 270,000 | Food & beverages |
| 65 | Hitachi | 268,655 | Industrial technology |
| 66 | Aramark | 266,680 | Food services |
| 67 | China Railway Construction | 264,045 | Construction & infrastructure |
| 68 | Mahindra & Mahindra | 260,000 | Automotive & manufacturing |
| 69 | ISS A/S | 257,922 | Facility services |
| 70 | Brookfield Corporation | 250,000 | Investment & real assets |
| 71 | Coal India | 248,550 | Mining |
| 72 | Stellantis | 248,243 | Automotive & manufacturing |
| 73 | China Unicom | 242,891 | Telecommunications |
| 74 | Jardine Cycle & Carriage | 240,000 | Conglomerate |
| 75 | Reliance Industries | 236,334 | Energy & conglomerate |
| 76 | Walmex | 235,132 | Retail |
| 77 | State Bank of India | 232,296 | Banking & finance |
| 78 | Wipro | 230,000 | IT services |
| 79 | Citigroup | 230,000 | Banking & finance |
| 80 | Microsoft | 228,000 | Technology |
| 81 | HCA Healthcare | 226,000 | Healthcare |
| 82 | HCL Technologies | 223,420 | IT services |
| 83 | Japan Post Holdings | 221,387 | Postal & finance |
| 84 | George Weston | 220,000 | Retail & food |
| 85 | Loblaw Companies | 220,000 | Retail |
| 86 | CVS Health | 219,000 | Healthcare & retail |
| 87 | HDFC Bank | 214,521 | Banking & finance |
| 88 | DFI Retail Group | 213,000 | Retail |
| 89 | Bank of America | 213,000 | Banking & finance |
| 90 | Wells Fargo | 212,804 | Banking & finance |
| 91 | HSBC | 211,130 | Banking & finance |
| 92 | Panasonic | 207,548 | Electronics manufacturing |
| 93 | Santander | 204,330 | Banking & finance |
| 94 | Foxconn Industrial Internet | 202,818 | Electronics manufacturing |
| 95 | Veolia | 202,332 | Utilities & environmental services |
| 96 | Woolworths Group | 201,413 | Retail |
| 97 | LVMH | 200,518 | Luxury goods |
| 98 | Bouygues | 200,200 | Construction & telecommunications |
| 99 | Jardine Matheson | 200,000 | Conglomerate |
| 100 | Deutsche Telekom | 198,678 | Telecommunications |
Employee counts are latest reported figures and may reflect different fiscal-year reporting dates. The table uses structured public-company rankings checked against filings and annual reports where possible. Data snapshot for this page: 2026 edition, based on latest available reported figures as of April 2026. Values are employees, not revenue, market capitalization or payroll cost.
Methodology
The ranking uses the latest reported number of employees for each company. “Employees” means the workforce directly disclosed by the company or by structured public-company datasets built from company filings and official reports. In most cases this includes full-time and part-time employees. Seasonal employees, temporary workers, contractors and franchise workers may or may not be included depending on company disclosure practice. Where a company reports only a consolidated employee figure, the consolidated number is used.
The 2026 edition uses the latest available disclosures rather than one synchronized fiscal year. Large companies have different reporting calendars: some report on calendar years, some on fiscal years ending in January, March or September, and some publish annual reports later than others. For that reason, the table should be read as a latest reported workforce snapshot rather than as a payroll count on one day.
Companies are ranked by absolute employee count from highest to lowest. Values are reproduced or rounded in the same practical style used in public disclosures and market-data compilations. Sector names are grouped into broad categories so similar employers can be compared more easily; they are not legal classifications. Conglomerates are assigned to the category that best explains their employment scale.
The main limitation is comparability. A retailer with many part-time store employees, a consulting group with client-delivery staff, a manufacturer with factory workers, and a bank with branch employees can all report “employees,” but the economic meaning differs. Employee count also does not measure job quality, wage levels, productivity, contractor dependence, unionization, working hours or regional distribution of jobs.
This is a corporate ranking, so it excludes governments, armies, public health systems and state administrations. It focuses on companies and publicly reported business groups with comparable employee disclosures.
Insights from the ranking
The upper tier is shaped by labour-intensive operating systems. Walmart, Amazon, JD.com, Home Depot, Target, Kroger and other retailers need large front-line teams because stores, warehouses and delivery networks cannot be fully reduced to software. Even when automation improves productivity, these companies still require workers close to customers and physical goods.
Manufacturing remains another major source of large headcounts. BYD, Foxconn, Volkswagen, Toyota, Stellantis, Luxshare, Panasonic and Sumitomo Electric show that global supply chains still depend on vast production and engineering workforces. Automation changes job mix but does not remove the need for large manufacturing organizations when companies operate at global scale.
The middle of the ranking contains banks, telecoms, IT services, facility services and construction groups. These sectors combine large customer bases with complex service delivery. Banks such as ICBC, Agricultural Bank of China, China Construction Bank, JPMorgan Chase, Bank of China and HSBC employ large teams because branch systems, compliance, technology and operations remain people-heavy.
The lower part of the Top 100 is still exceptionally large. A company near rank 100 has roughly 200,000 employees, more than the entire labour force of many small cities. This is why the ranking is useful for understanding exposure to wage inflation, labour regulation, automation, workplace safety, union negotiations, training costs and regional employment shocks.
The biggest interpretation trap is assuming that more employees means a stronger company. Large headcount can indicate reach and resilience, but it can also indicate lower labour productivity, high fixed costs or operational complexity. A software company with 200,000 employees may be more profitable than a retailer with 2 million employees, while the retailer may have a much larger direct impact on household employment.
What this means for readers
Employee count connects corporate size with real labour-market footprint. A large workforce means the company matters not only to shareholders but also to local labour markets, suppliers, transport networks, city economies and wage-setting norms. When a company with hundreds of thousands of employees changes hiring plans, store formats, factory locations or automation strategy, the effect can spread far beyond its own balance sheet.
Job seekers can use the ranking to understand which companies operate large internal labour markets. Analysts can use it to compare labour intensity across sectors. Journalists and students can use it to explain why some companies dominate employment even when they are not the most valuable by market cap. Policymakers can use it as a starting point for questions about regional dependence, workplace standards and exposure to restructuring.
The cautious reading is equally important. A high employee count does not automatically mean high wages, good working conditions, high productivity or low automation risk. It is one lens on corporate scale, best combined with revenue per employee, labour cost, geographic distribution, turnover, wage data and sector structure.
FAQ
What does “number of employees” mean in this ranking?
It means the latest reported workforce count for a company or consolidated business group. In most disclosures this includes full-time and part-time employees, but companies differ in how they treat seasonal workers, temporary workers, contractors and employees of franchises.
Why is Walmart usually at or near the top?
Walmart operates a massive retail network with stores, clubs, distribution centers and support operations. Retail is a labour-intensive sector because customer service, shelf stocking, fulfillment, logistics and store management require large teams in many locations.
Are part-time and seasonal workers included?
Often yes, but not always in the same way. Retailers and logistics companies commonly disclose total associates or employees including part-time roles. Seasonal workers may be included if they are part of the reported year-end or average workforce figure. The ranking follows the company’s reported number rather than trying to rebuild payroll definitions.
Why are some technology giants not in the very top?
Many technology companies generate very high revenue and market value with fewer employees because software, cloud infrastructure and digital platforms scale differently from stores, factories or delivery networks. Microsoft appears in the Top 100, but it employs far fewer people than Walmart or Amazon.
Can employee counts from different companies be compared directly?
They can be compared as broad indicators of workforce scale, but not as perfect like-for-like measures. A bank employee, a factory worker, a store associate, a software engineer and a contracted delivery worker sit inside very different reporting and operating systems.
Why does the 2026 edition use latest reported annual data?
Companies do not publish live employee counts every day, and fiscal calendars differ. The most reliable comparable data usually comes from annual reports, Form 10-K filings, integrated reports and official investor disclosures. That makes the 2026 edition a latest available reporting snapshot.
How is this different from ranking companies by revenue or market capitalization?
Revenue measures sales, while market capitalization measures the stock market value of equity. Employee count measures workforce scale. A company can rank very high by employees and lower by market cap, or very high by market cap and far lower by employees. The difference reveals how labour-intensive the business model is.
Sources
The ranking is based on latest publicly available employee disclosures and structured public-company datasets. Official annual reports and filings should be treated as the primary reference for formal use.
CompaniesMarketCap employee ranking
Capital.com largest companies by employees
Walmart annual reports and proxies
Amazon annual reports, proxies and shareholder letters
Hon Hai annual reports
Volkswagen Group annual report
Accenture annual reports
SEC EDGAR company filings search
Fortune Global 500 ranking
Related rankings
More StatRanker pages connected by topic, category or ranking theme.
Top 100 Semiconductor Companies by Revenue, 2026
Open rankingTop 100 AI Companies by Funding, 2026
Open rankingTop 1000 Global Companies by Operating Profit
Open rankingTop 100 Defense Companies by Revenue, 2026 Snapshot
Open rankingStatRanker (Website)
administrator
