
Top 50 U.S. States by Manufacturing GDP
Ranking • Production focus Manufacturing GDP by state: where real output is concentrated (latest year: 2024) Metric: Manufacturing GDP (NAICS
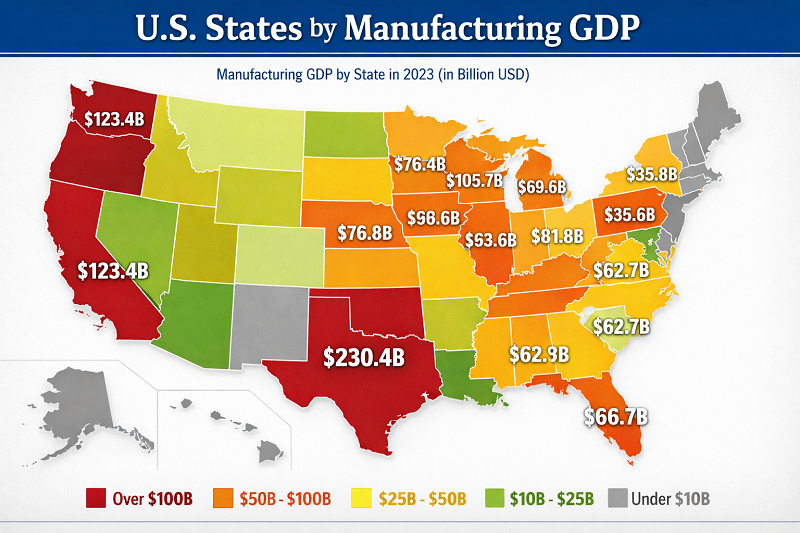
Ranking • Production focus Manufacturing GDP by state: where real output is concentrated (latest year: 2024) Metric: Manufacturing GDP (NAICS
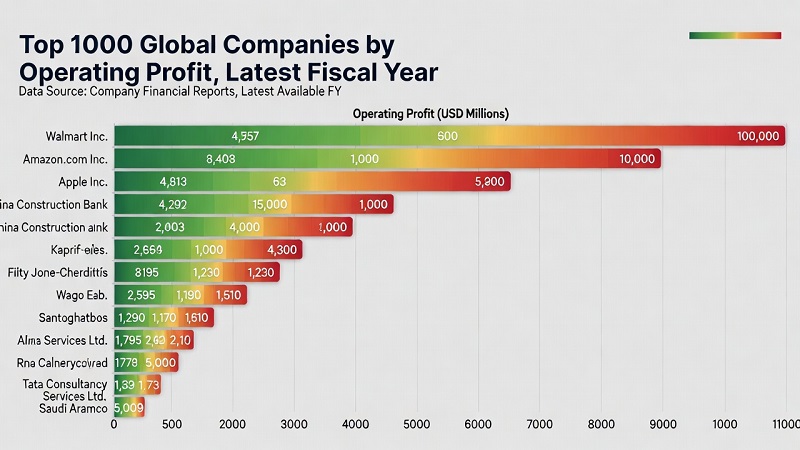
Most profitable companies • Operating profit (EBIT-style) • Latest FY in Scoreboard dataset • Updated: 2026-01-29 This ranking orders the
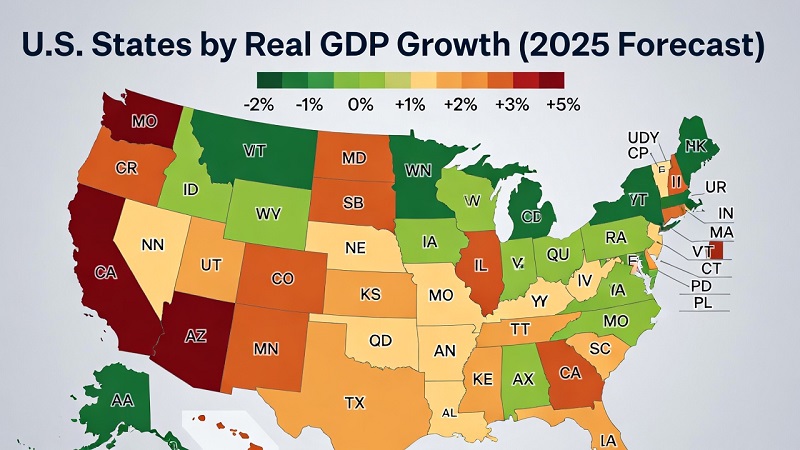
BEA • Real GDP (chained dollars) Quarterly Percent change at annual rate (SAAR) Revisions possible Last updated: January 28, 2026
Disclaimer. This page is for educational use only and is not investment, financial, legal, or tax advice. Markets are volatile,
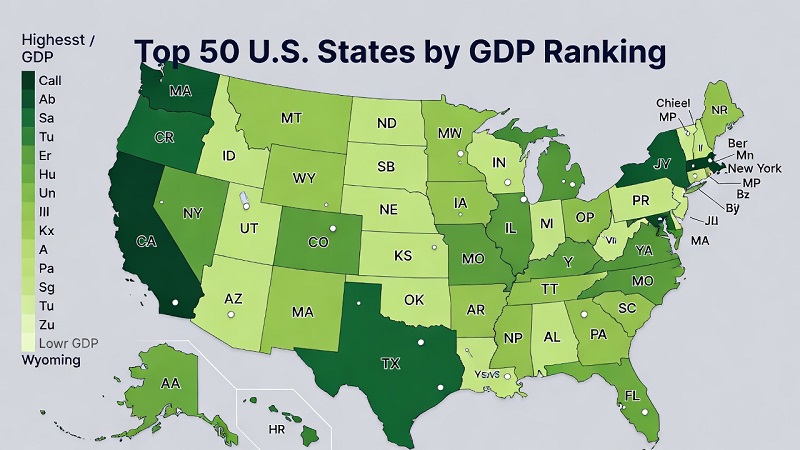
Economy · 2026 Update (2024 preliminary data) This ranking uses current-dollar (nominal) gross domestic product by state from the U.S.

Global auto market ranking • Country totals • Unit-based comparison New vehicle sales by market provide a consistent, unit-based view

Economy · Wages and incomes of the population Updated: January 18, 2026 Metric: median household income Scope: 50 states (excludes

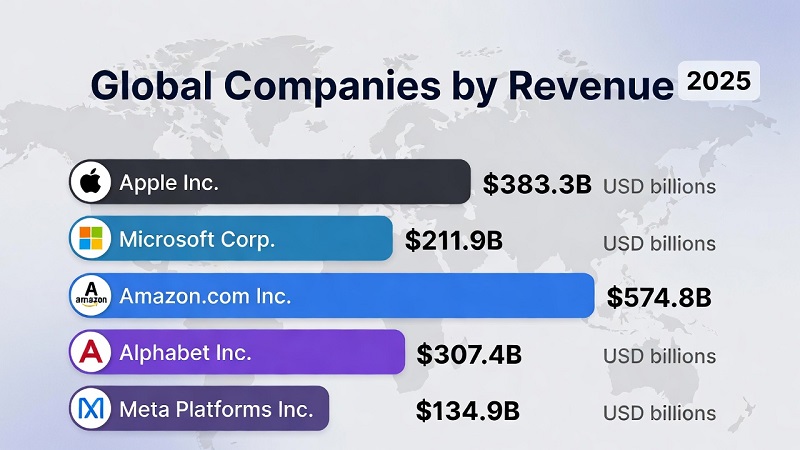
Macroeconomics • 2025 snapshot What this ranking measures (and why it matters) Nominal GDP is the market value of all

Environment & Resources · Energy & EV Analysis “Per capita” CO₂ is one of the fastest ways to understand how

Economy & Living Standards · Wages & incomes Data refresh: loading… People often google “median household income by country” expecting

Economy & Living Standards · Global ranking (Top 100) This ranking compares poverty headcount rates across countries using the World
Economy · Budget & Taxes · Country ranking The tax-to-GDP ratio (tax revenue as a share of GDP) is a

Macroeconomy • 2025 ranking This page ranks countries by general government gross debt as a share of GDP (Debt-to-GDP). It

Net salary rankings are popular because they feel “practical”: what lands in your account each month. But as a benchmark,

This page is an expanded framing of the existing “wages beat inflation” idea: same core question (did pay rises outpace

Minimum wages • Real PPP • 2025 Minimum wages are a “wage floor” policy: a statutory minimum, a collectively bargained

Wages • Purchasing Power • 2025 “Median wage (PPP)” is one of the most reader-friendly ways to compare pay across

2025 snapshot “Food inflation” is the year-over-year change in the CPI food index (typically “Food & Non-Alcoholic Beverages”). Because food

Residential energy bills What households paid for natural gas in 2025 — and why the “same fuel” costs so differently

Household electricity cost benchmark This ranking compares residential electricity prices in USD per kWh. It reflects retail tariffs — not

Economy · Macroeconomics · Growth Real GDP growth (annual %) measures how fast an economy expands in inflation-adjusted terms. This

StatRanker Labour Markets Ages 15–24 Youth unemployment is one of the fastest-moving stress indicators in any economy. When companies slow

StatRanker • Country rankings This page ranks countries by unemployment rate (share of the labour force without work, available for

2025 snapshot • inflation-adjusted rates Real interest rates by country: what this ranking is (and what it is not) “Real

Dec 2025 snapshot A central bank policy rate (also called a benchmark, key, or monetary policy rate) is the interest

StatRanker • Automotive imports • Value This ranking compares countries by the value of automotive imports. A high import level

What this metric captures New passenger car registrations per 1,000 people approximates how quickly a country’s passenger-car market is being
