
Top 100 Countries by Urbanization Rate (% Urban
Urbanization is one of the fastest ways to understand how a country is physically organized. A high urban share usually

Urbanization is one of the fastest ways to understand how a country is physically organized. A high urban share usually

Population · Demographics · Median age Median age by country in 2025: the full ranking behind the world’s oldest and

Top 100 Countries by Population Growth Rate, 2025 Demographics · Population · Annual change Top 100 Countries by Population Growth
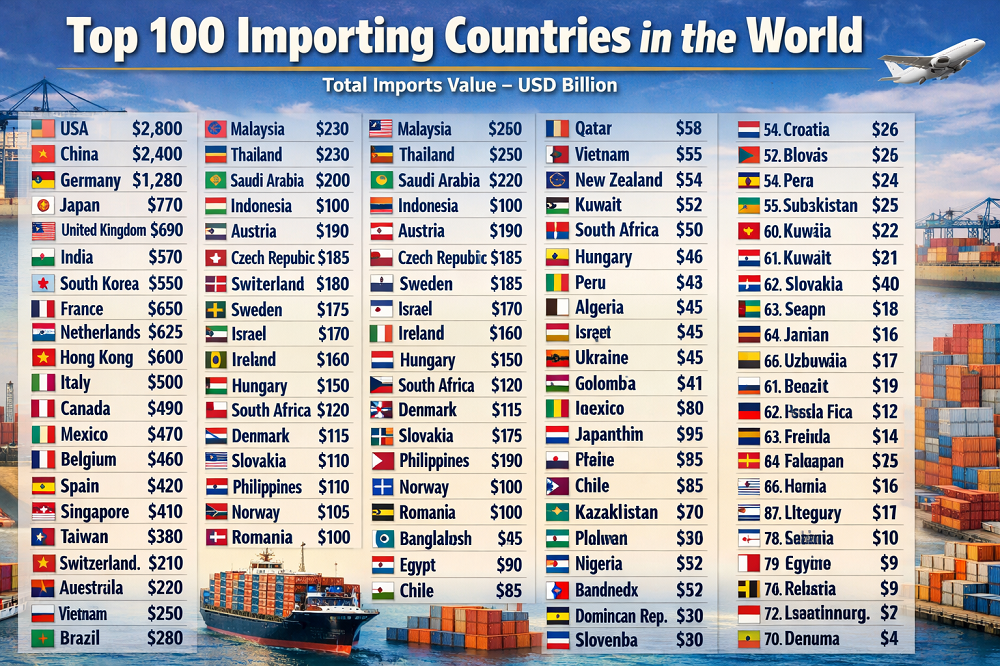
Where global import demand is concentrated in 2025 This ranking uses the latest full-year 2024 imports of goods and services
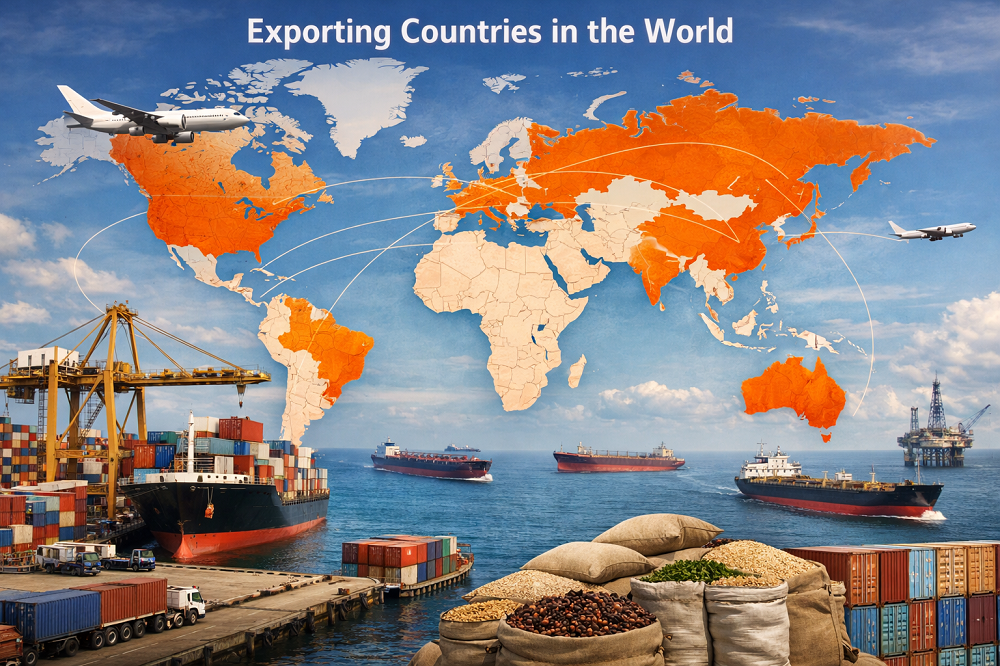
Economy · Trade · Exports How to read the world export ranking in 2025 This ranking tracks exports of goods
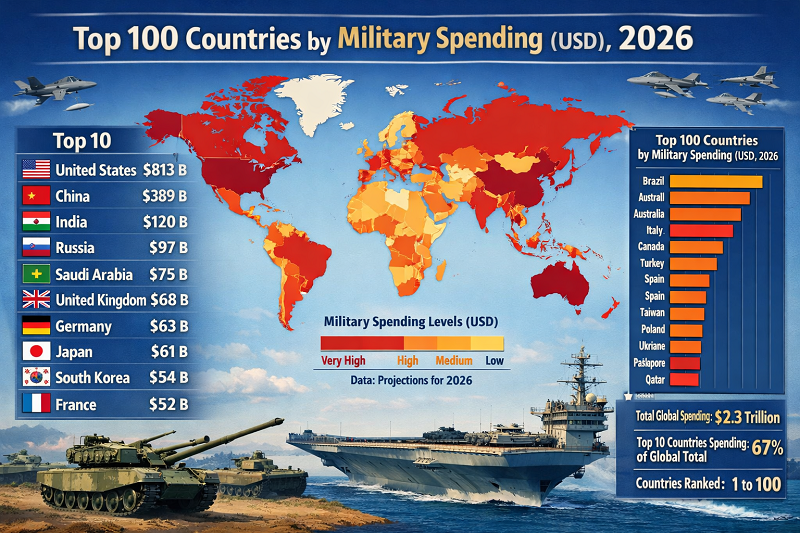
Military spending in 2026 is best read as a budget hierarchy, not a finished outturn table A clean 2026 ranking
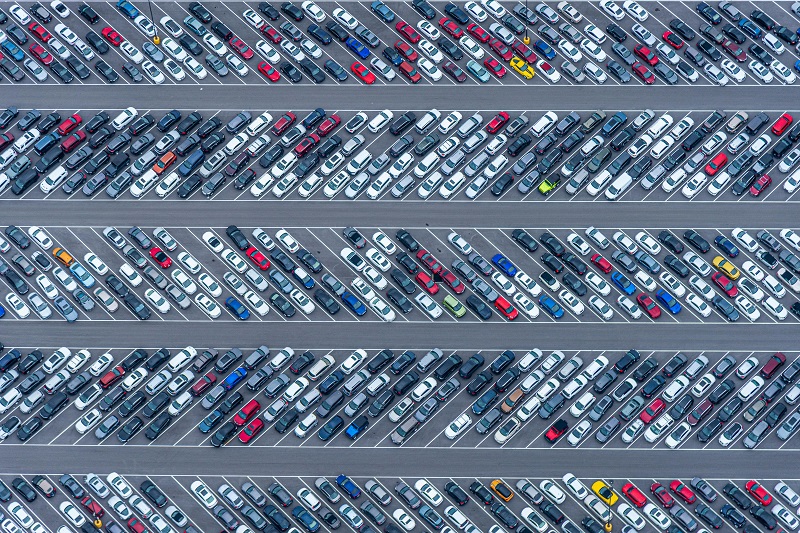
Mobility · Manufacturing · Passenger cars Passenger car production is not the same thing as total motor vehicle output. This
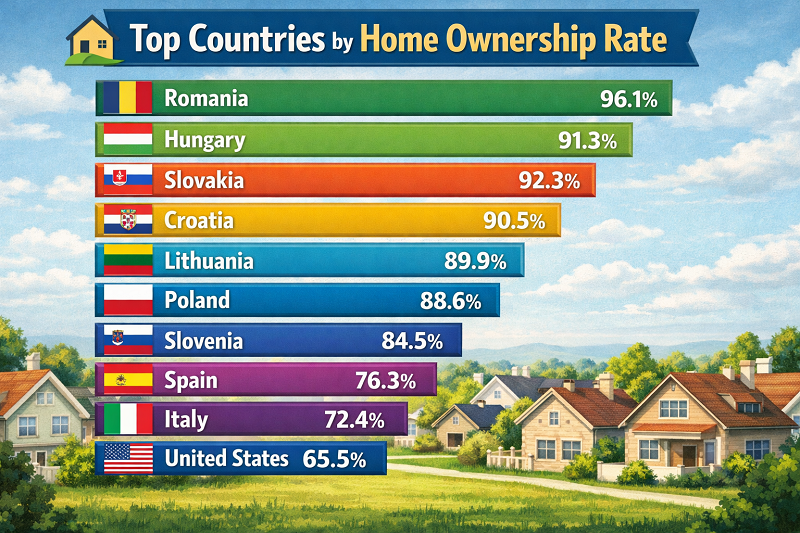
Housing · Tenure structure · Latest available data Home ownership rate is a tenure metric, not an affordability score Home
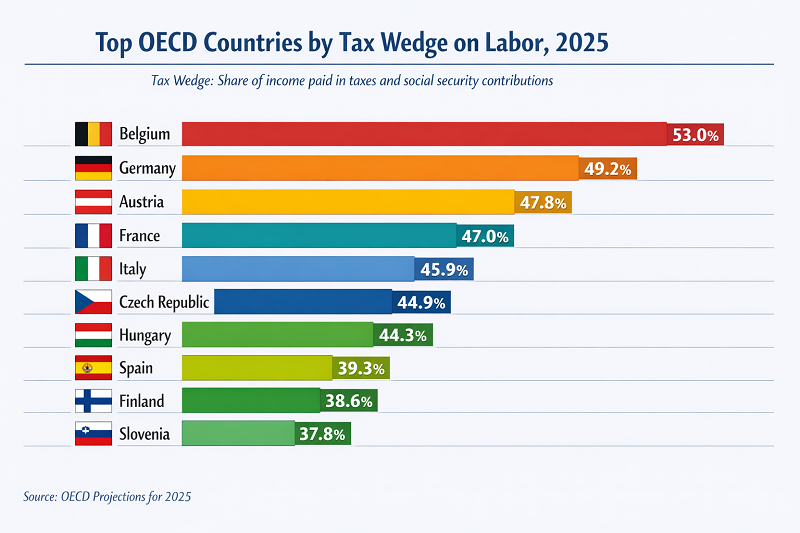
Economy · Budget and taxes · OECD labour taxation The tax wedge is the gap between what an employer pays

Economy · reserve assets · central banks · monetary gold Official gold reserves are the monetary gold holdings reported by

Knowledge economy · Innovation · SDG 9.5.2 Where researcher density is deepest in the latest global data Researchers per million

Foreign trade · Logistics · Maritime infrastructure How to read the latest World Bank container port traffic ranking Container port
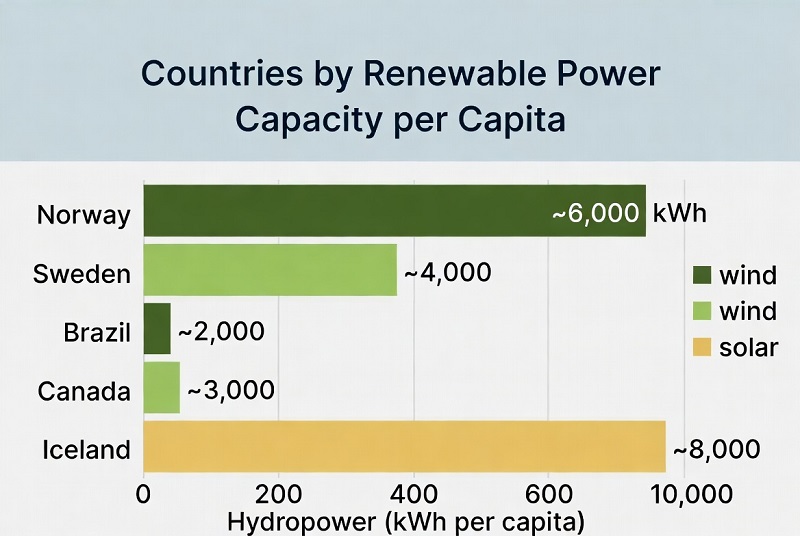
Renewable power capacity per person changes the ranking lens Installed renewable power per person highlights a different side of the
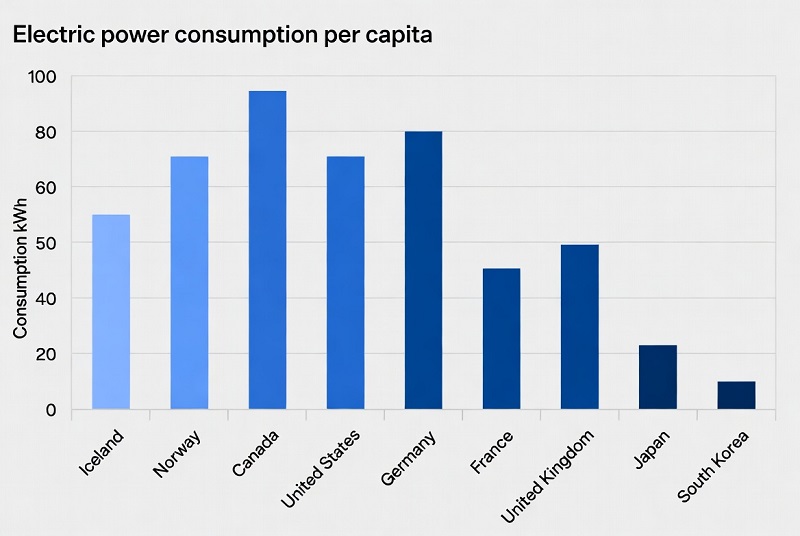
Energy · Utilities · Infrastructure What electric power consumption per capita shows in the latest World Bank / IEA comparison
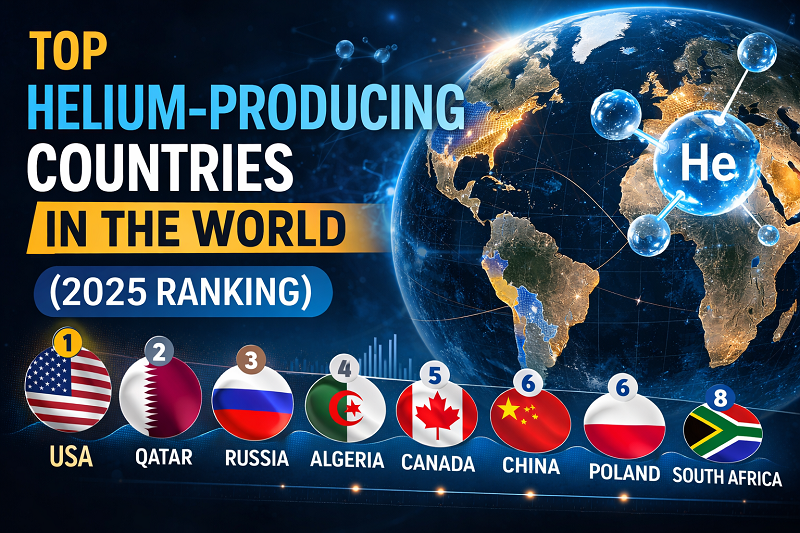
Table Methodology FAQ Sources Helium is one of the smallest commodity markets in volume terms, but it sits inside a
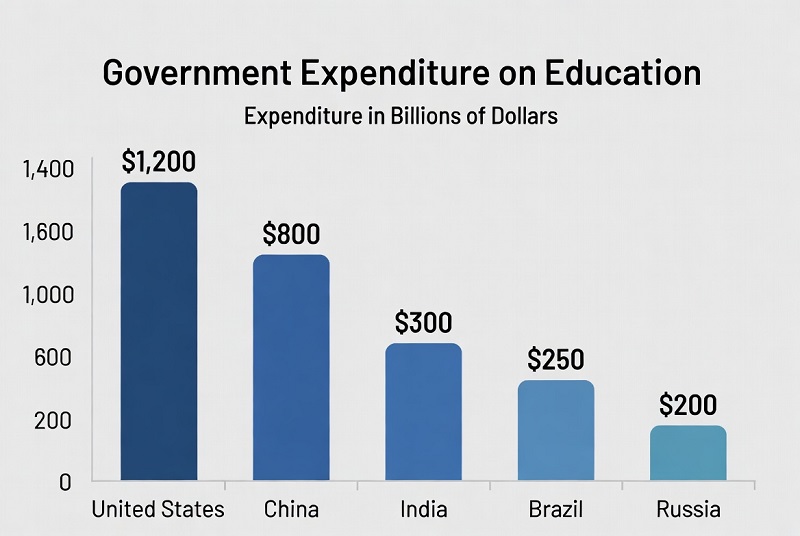
Overview of the latest comparable global ranking Indicator: Government expenditure on education, total (% of GDP) · Reference ranking year:

Innovation · Economy · Country ranking Resident patent applications are one of the clearest country-level signals of domestic inventive activity
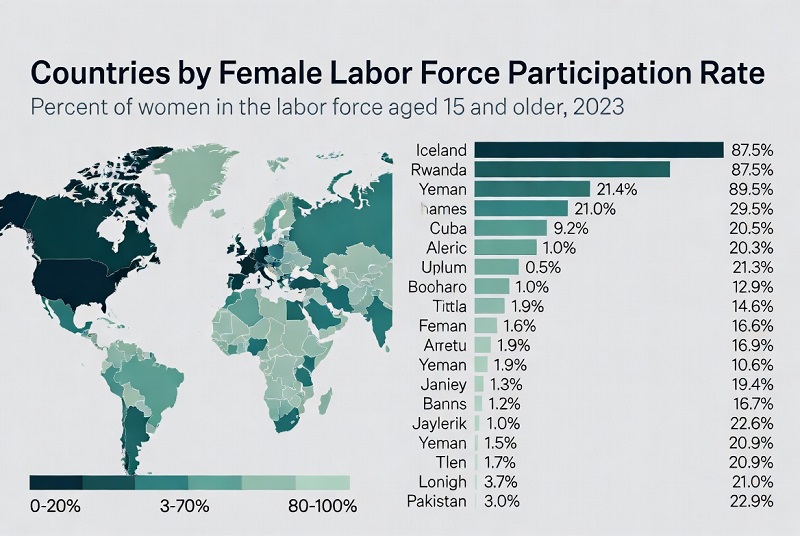
Economy · Demography · Gender statistics Why female labor force participation is one of the clearest cross-country signals in the
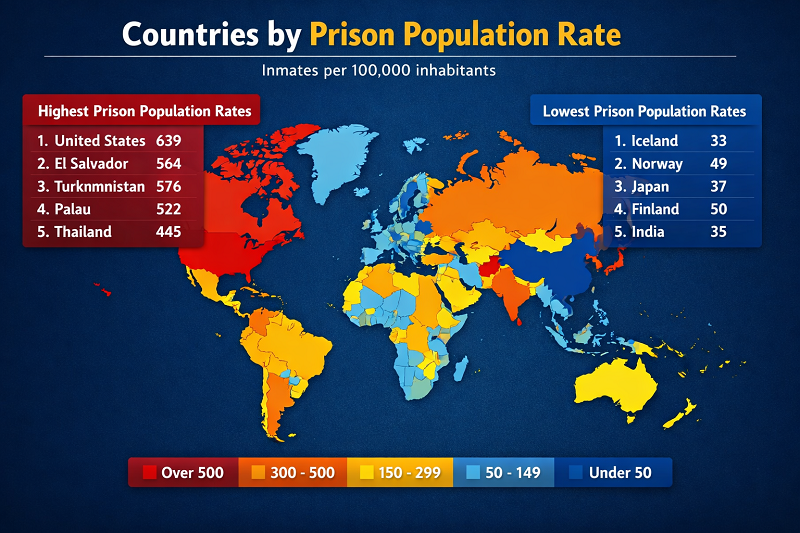
How prison population rate should be read in a 2025 snapshot Indicator: prisoners per 100,000 population · Scope here: sovereign
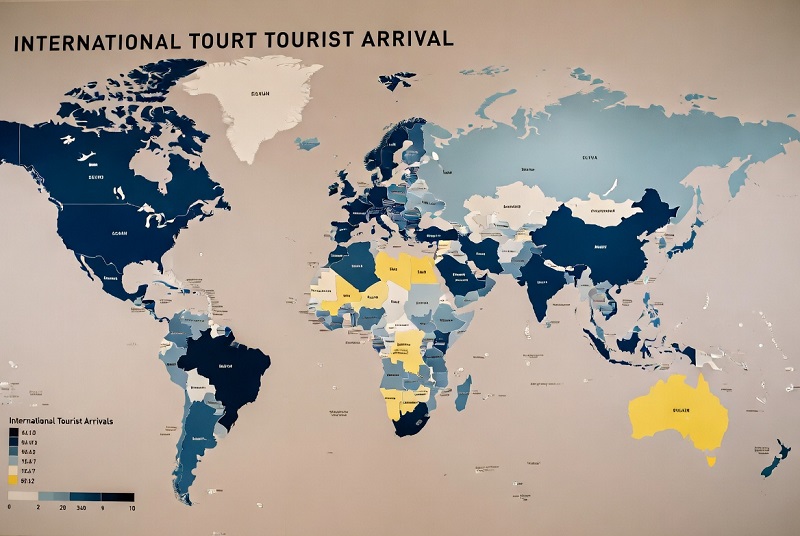
Travel data · inbound tourism · 2025 edition Why international tourist arrivals still matter International tourist arrivals are one of

Geopolitics · Defense budgets · SIPRI How military expenditure as a share of GDP shows defense burden in 2025 Military
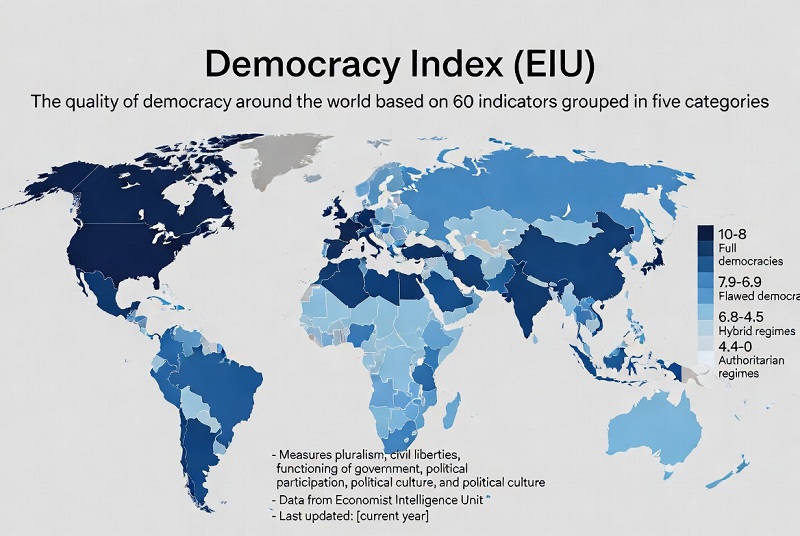
The latest available global ranking comes from EIU’s Democracy Index 2024, published in 2025 and used here as the current
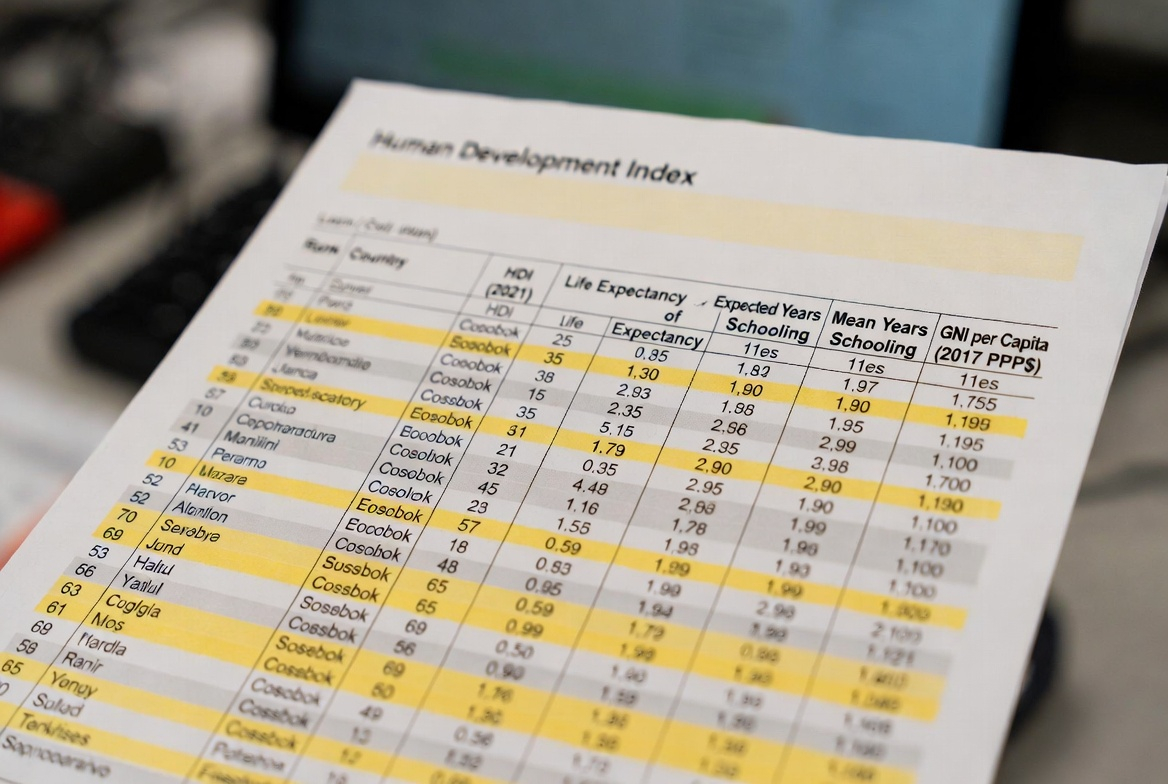
Society · Development · Composite index Human Development Index (HDI): a composite ranking of health, education, and living standards The
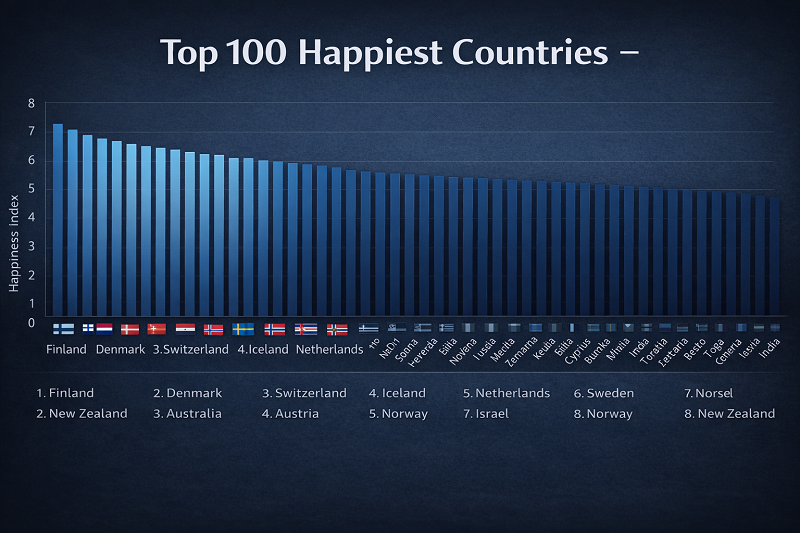
Society · Wellbeing · World Happiness Report How the World Happiness Report measures national wellbeing The World Happiness Report ranks
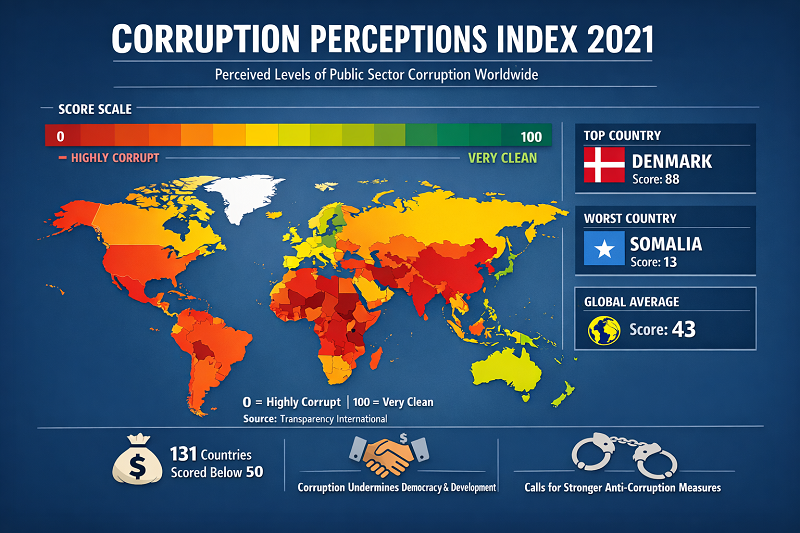
Governance · Transparency International · CPI 2025 The Corruption Perceptions Index (CPI) scores 182 countries and territories on perceived public-sector

The Greatest Films of All Time — Sight & Sound 2022 Critics’ Poll Culture · Film Canon · Critics’ Poll
Cities, Urban Life & Quality of Living Updated: February 26, 2026 Reference year: 2024 (official series) Apartment size: ≈60 m²
