

Cereal Production per Capita by Country: 2025 Snapshot Based on 2023 Data
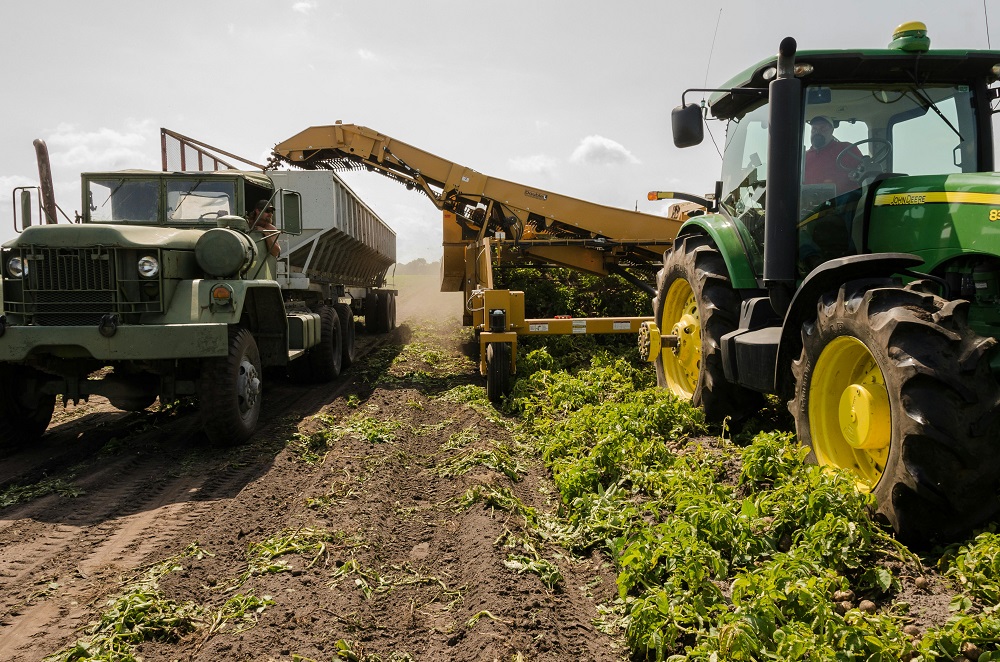
Which Countries Produce the Most Cereal per Person?
Lithuania ranks first at 1,972.5 kilograms of cereal production per person, followed by Australia at 1,630.2 kilograms and Serbia at 1,599.5 kilograms. The ranking compares each country's 2023 cereal production with its 2023 population.
Production comes from FAOSTAT and population from the United Nations World Population Prospects 2024 revision. The metric follows the same production-per-capita concept used by FAO for cereal statistics and is expressed in kilograms per person.
The table is a compiled research dataset based on three references: FAOSTAT for production, UN World Population Prospects for population and the FAO Statistical Yearbook for the cereal-production-per-capita indicator definition. All 30 ranked entries are historical values. There are no official forecasts or modeled projections.
Continue exploring
More StatRanker pages connected by topic, category or ranking theme.
The 2025 label identifies the snapshot. The underlying statistical year is 2023, so production and population are compared on the same annual basis.
Lithuania records the highest value in the Top 30.
Thailand ranks 30th in the published table; this is not the global minimum.
The ranking contains 30 confirmed country-level entries.
Production and population use the same statistical year.
No forecast or modeled projection is included.
Why Production per Person Changes the Ranking
Total cereal production favors countries with very large agricultural sectors. Dividing production by population answers a different question: how much cereal does a country produce relative to the number of people living there?
This comparison brings several smaller European producers toward the top. Lithuania leads the ranking, while Serbia, Hungary, Bulgaria and Latvia also appear in the Top 10. Australia, Canada, Argentina and the United States remain near the top because their cereal harvests are large even after population is taken into account.
The numerator uses FAOSTAT's primary-cereal category. It covers cereals harvested for dry grain, including major crops such as wheat, maize, rice, barley, sorghum, millet, oats and rye.
Potatoes, cassava, yams, plantains and other non-cereal staples are not included. Combining fresh roots and tubers with dry grain on a simple weight basis would make differences in water content and crop composition a major part of the ranking.
Production per capita is also different from consumption. Grain can be exported, fed to livestock, retained as seed, processed or used for other purposes. Countries may also consume imported cereals that do not appear in domestic production.
Top 10 Countries by Cereal Production per Capita
Seven countries in the Top 10 exceed 1,500 kilograms of cereal production per person. Lithuania stands above the rest, while Australia, Serbia, Ukraine, Canada, Hungary and Bulgaria form a much tighter group.
Top 10 countries by cereal production per person
| Rank | Entity | Value | Source / method note |
|---|---|---|---|
| 1 | Lithuania | 1,972.5 kg/person | Europe & Central Asia · official value · FAOSTAT + UN WPP · 2023 data · 2025 snapshot. |
| 2 | Australia | 1,630.2 kg/person | East Asia & Pacific · official value · FAOSTAT + UN WPP · 2023 data · 2025 snapshot. |
| 3 | Serbia | 1,599.5 kg/person | Europe & Central Asia · official value · FAOSTAT + UN WPP · 2023 data · 2025 snapshot. |
| 4 | Ukraine | 1,572.1 kg/person | Europe & Central Asia · official value · FAOSTAT + UN WPP · 2023 data · 2025 snapshot. |
| 5 | Canada | 1,553.8 kg/person | North America · official value · FAOSTAT + UN WPP · 2023 data · 2025 snapshot. |
| 6 | Hungary | 1,552.7 kg/person | Europe & Central Asia · official value · FAOSTAT + UN WPP · 2023 data · 2025 snapshot. |
| 7 | Bulgaria | 1,522.4 kg/person | Europe & Central Asia · official value · FAOSTAT + UN WPP · 2023 data · 2025 snapshot. |
| 8 | Latvia | 1,442.7 kg/person | Europe & Central Asia · official value · FAOSTAT + UN WPP · 2023 data · 2025 snapshot. |
| 9 | Argentina | 1,436.2 kg/person | Latin America & Caribbean · official value · FAOSTAT + UN WPP · 2023 data · 2025 snapshot. |
| 10 | United States | 1,346.9 kg/person | North America · official value · FAOSTAT + UN WPP · 2023 data · 2025 snapshot. |
Formula: cereal production in tonnes × 1,000 ÷ population. Rank is calculated from the unrounded value; displayed values are rounded to one decimal.
Top 20 Countries by Cereal Production per Person
Lithuania leads by a clear margin. Australia through Bulgaria form a comparatively tight group above 1,500 kilograms per person before the distribution gradually widens.
Methodology
The ranking measures cereal production per capita using production and population observations for the same year. FAO has used “cereals production per capita” as a FAOSTAT-sourced statistical indicator; this page applies that established relationship to the selected 2023 source series.
Metric
Cereal production per capita measures annual cereal production relative to population. FAOSTAT cereal production covers crops harvested for dry grain.
Unit and direction
Results are expressed in kilograms per person. Higher values rank higher.
Formula
Cereal production per capita = cereal production in tonnes × 1,000 ÷ population.
Data year
Production and population both use 2023 observations. No later-year denominator or numerator is mixed into the ranking.
Indicator precedent
FAO Statistical Yearbook tables and charts use “Cereals production per capita” as a FAOSTAT-sourced indicator. The ranking reproduces that production-to-population relationship for the 2023 source year.
Value status
Rows use official_value status because they represent a historical FAO-defined indicator calculated directly from official production and population observations. No forecast rate, trend assumption or modeled projection is applied.
Source hierarchy
FAOSTAT controls the cereal-production numerator. UN World Population Prospects 2024 controls the population denominator. The FAO Statistical Yearbook is used to document the per-capita cereal indicator concept, not to replace the 2023 row values.
Coverage
The published ranking contains the 30 highest confirmed country-level values in the matched 2023 dataset.
Inclusion
A country requires both a 2023 cereal-production observation and a positive 2023 population value.
Missing values
Countries without both required 2023 inputs are excluded. Missing production or population observations are not filled by this analysis.
Crop coverage
The numerator includes cereals only. Roots and tubers, pulses, oil crops, sugar crops, plantains and other crop groups are excluded.
Why crop groups are not combined
Fresh roots and tubers contain much more water than dry cereal grain. Adding their raw weights would make crop mix and moisture content major influences on the result.
Conflicts
Conflicting values are not averaged. Production follows the selected FAOSTAT series and population follows UN World Population Prospects.
Assumptions
No growth rate, price weighting, calorie conversion or forecast is applied. The numerical transformation is limited to converting tonnes to kilograms and dividing by population.
Rounding
Rank is calculated from the unrounded ratio. Displayed values are rounded to one decimal place.
Limits
The metric does not measure consumption, food security, cereal trade, crop yield, agricultural productivity, dietary energy supply or the share of production eaten by residents.
Full Ranking: Top 30 Countries
The ranking compares 2023 cereal production with 2023 population. Countries are ordered by the unrounded kilograms-per-person value.
Cereal production per capita, kilograms per person
| Rank | Entity | Value | Source / method note |
|---|---|---|---|
| 1 | Lithuania | 1,972.5 kg/person | Europe & Central Asia · official value · FAOSTAT + UN WPP · 2023 data · 2025 snapshot. |
| 2 | Australia | 1,630.2 kg/person | East Asia & Pacific · official value · FAOSTAT + UN WPP · 2023 data · 2025 snapshot. |
| 3 | Serbia | 1,599.5 kg/person | Europe & Central Asia · official value · FAOSTAT + UN WPP · 2023 data · 2025 snapshot. |
| 4 | Ukraine | 1,572.1 kg/person | Europe & Central Asia · official value · FAOSTAT + UN WPP · 2023 data · 2025 snapshot. |
| 5 | Canada | 1,553.8 kg/person | North America · official value · FAOSTAT + UN WPP · 2023 data · 2025 snapshot. |
| 6 | Hungary | 1,552.7 kg/person | Europe & Central Asia · official value · FAOSTAT + UN WPP · 2023 data · 2025 snapshot. |
| 7 | Bulgaria | 1,522.4 kg/person | Europe & Central Asia · official value · FAOSTAT + UN WPP · 2023 data · 2025 snapshot. |
| 8 | Latvia | 1,442.7 kg/person | Europe & Central Asia · official value · FAOSTAT + UN WPP · 2023 data · 2025 snapshot. |
| 9 | Argentina | 1,436.2 kg/person | Latin America & Caribbean · official value · FAOSTAT + UN WPP · 2023 data · 2025 snapshot. |
| 10 | United States | 1,346.9 kg/person | North America · official value · FAOSTAT + UN WPP · 2023 data · 2025 snapshot. |
| 11 | Guyana | 1,221.9 kg/person | Latin America & Caribbean · official value · FAOSTAT + UN WPP · 2023 data · 2025 snapshot. |
| 12 | Denmark | 1,177.2 kg/person | Europe & Central Asia · official value · FAOSTAT + UN WPP · 2023 data · 2025 snapshot. |
| 13 | Uruguay | 1,162.1 kg/person | Latin America & Caribbean · official value · FAOSTAT + UN WPP · 2023 data · 2025 snapshot. |
| 14 | Romania | 1,087.1 kg/person | Europe & Central Asia · official value · FAOSTAT + UN WPP · 2023 data · 2025 snapshot. |
| 15 | Moldova | 1,035.9 kg/person | Europe & Central Asia · official value · FAOSTAT + UN WPP · 2023 data · 2025 snapshot. |
| 16 | France | 966.9 kg/person | Europe & Central Asia · official value · FAOSTAT + UN WPP · 2023 data · 2025 snapshot. |
| 17 | Paraguay | 946.1 kg/person | Latin America & Caribbean · official value · FAOSTAT + UN WPP · 2023 data · 2025 snapshot. |
| 18 | Russia | 937.4 kg/person | Europe & Central Asia · official value · FAOSTAT + UN WPP · 2023 data · 2025 snapshot. |
| 19 | Poland | 907.7 kg/person | Europe & Central Asia · official value · FAOSTAT + UN WPP · 2023 data · 2025 snapshot. |
| 20 | Estonia | 878.2 kg/person | Europe & Central Asia · official value · FAOSTAT + UN WPP · 2023 data · 2025 snapshot. |
| 21 | Cambodia | 843.6 kg/person | East Asia & Pacific · official value · FAOSTAT + UN WPP · 2023 data · 2025 snapshot. |
| 22 | Kazakhstan | 823.4 kg/person | Europe & Central Asia · official value · FAOSTAT + UN WPP · 2023 data · 2025 snapshot. |
| 23 | Croatia | 819.0 kg/person | Europe & Central Asia · official value · FAOSTAT + UN WPP · 2023 data · 2025 snapshot. |
| 24 | Slovakia | 780.1 kg/person | Europe & Central Asia · official value · FAOSTAT + UN WPP · 2023 data · 2025 snapshot. |
| 25 | Czechia | 739.7 kg/person | Europe & Central Asia · official value · FAOSTAT + UN WPP · 2023 data · 2025 snapshot. |
| 26 | Belarus | 739.0 kg/person | Europe & Central Asia · official value · FAOSTAT + UN WPP · 2023 data · 2025 snapshot. |
| 27 | Brazil | 738.3 kg/person | Latin America & Caribbean · official value · FAOSTAT + UN WPP · 2023 data · 2025 snapshot. |
| 28 | Austria | 573.4 kg/person | Europe & Central Asia · official value · FAOSTAT + UN WPP · 2023 data · 2025 snapshot. |
| 29 | Laos | 568.6 kg/person | East Asia & Pacific · official value · FAOSTAT + UN WPP · 2023 data · 2025 snapshot. |
| 30 | Thailand | 543.7 kg/person | East Asia & Pacific · official value · FAOSTAT + UN WPP · 2023 data · 2025 snapshot. |
All 30 values use the same formula and the same 2023 reference year. The 2025 label identifies the publication snapshot rather than a projected harvest year.
What Stands Out in the Ranking
Key Insight
Lithuania leads Australia by 342.3 kilograms per person, a gap of about 21%.
Notable Pattern
Australia, Serbia, Ukraine, Canada, Hungary and Bulgaria are separated by only 107.9 kilograms per person across ranks two through seven.
Regional Concentration
Europe & Central Asia accounts for 19 of the 30 ranked countries and six of the first eight positions.
Close Cluster
Czechia, Belarus and Brazil are separated by only about 1.4 kilograms per person across ranks 25 to 27.
What the Ranking Means
A high rank means that cereal production is large relative to population. It does not necessarily indicate higher farm productivity, stronger food security or greater cereal consumption.
The measure is useful for separating agricultural scale from population scale. Countries with smaller populations can rank highly when cereal harvests are substantial, while populous countries need much larger output to reach the same per-capita level.
The ranking also does not identify how the harvest is used. Cereals may be consumed domestically, exported, fed to livestock, used as seed or processed. Imports are outside the production numerator.
Cereal production per capita is therefore best read as a measure of production relative to population rather than a direct measure of diets, food availability or agricultural efficiency.
FAQ
Which country has the highest cereal production per capita?
Lithuania ranks first at 1,972.5 kilograms per person, followed by Australia and Serbia.
Are these 2025 production figures?
No. This is a 2025 snapshot based on matched 2023 production and population data. No 2025 harvest is estimated.
What crops are included?
FAOSTAT's cereal category covers crops harvested for dry grain, including wheat, maize, rice, barley, sorghum, millet, oats and rye.
Are potatoes and cassava included?
No. The ranking uses cereal production only and does not combine cereals with roots, tubers or other staple crops.
How is cereal production per capita calculated?
Cereal production in tonnes is multiplied by 1,000 to convert it to kilograms and then divided by the country's population for the same year.
Does a high value mean people consume more cereal?
No. Production can be exported or used for feed, seed and processing, while domestic consumption can also include imported grain.
Does this ranking measure crop productivity?
No. Productivity measures such as yield per hectare use agricultural inputs or land as the denominator. This ranking uses population.
Are any values forecasts or modeled projections?
No. All 30 entries use historical 2023 production and population observations. No trend or growth assumption is applied.
Sources
FAOSTAT — Crop Production, Yield and Harvested Area
Primary source for cereal-production observations and the definition of cereals used in the ranking.
https://data.fao.org/catalog/dataset/d24a448b-3b62-4c09-8c1d-4a39bb599876
United Nations — World Population Prospects 2024
Primary source for the 2023 population denominator used in the per-capita calculation.
FAO Statistical Yearbook — Cereal Production per Capita
Methodology reference documenting FAO's use of “Cereals production per capita” as a FAOSTAT-sourced indicator. It supports the indicator definition; the 2023 country values on this page use the current production and population source series listed above.
Related rankings
More StatRanker pages connected by topic, category or ranking theme.
Apple Production by Country 2026: Official FAOSTAT 2024 Ranking
Open rankingSugarcane Production by Country 2026: Official FAOSTAT 2024 Ranking
Open rankingPotato Production by Country 2026: FAOSTAT 2024 Ranking
Open rankingBanana Production by Country 2026: Official FAOSTAT 2024 Ranking
Open ranking
StatRanker (Website)
administrator
