

Alcohol Consumption by Country 2024: Top 100 WHO Ranking
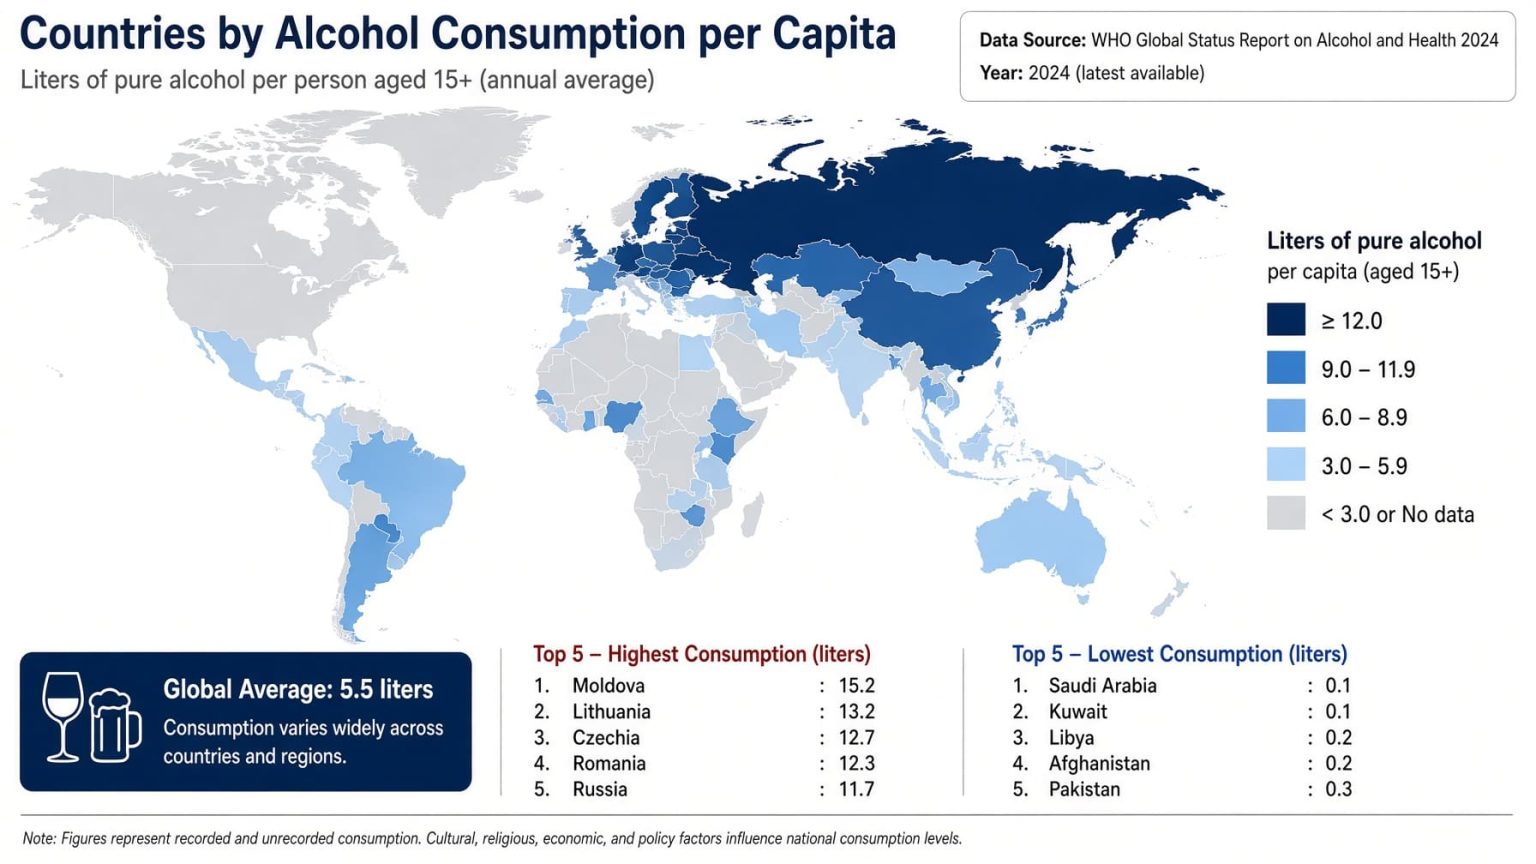
Where Alcohol Consumption per Capita Is Highest in the 2024 WHO Data
Romania ranks first at 17.07 litres of pure alcohol per person aged 15 or older, followed by Georgia at 14.40 litres and Latvia at 14.18 litres. The metric is WHO SDG indicator 3.5.2: total alcohol per capita consumption, measured in litres of pure alcohol per person aged 15+ per year.
The ranking uses 2024 WHO official estimates from the current WHO alcohol-consumption dataset. Higher values rank higher. It is not a 2026 forecast: 2026 is only the publication snapshot for this StatRanker page.
Numeric source: World Health Organization. Ranking universe: the 188 countries, areas and territories listed in WHO indicator metadata, with only entities that have a 2024 estimate eligible for ranking. The table contains 100 confirmed rows: 100 official_value, 0 calculated_value, 0 official_forecast and 0 modeled_projection.
Romania ranks first in the 2024 WHO-based country ranking.
Cabo Verde is rank 100 after applying the WHO metadata-universe rule.
Selected from WHO's published 188-entity indicator universe using 2024 estimates where available.
Litres of pure alcohol per resident aged 15+ per year.
What the WHO Alcohol Consumption Measure Includes
Total alcohol per capita consumption is a population-level estimate of pure alcohol consumed per resident aged 15 or older. WHO defines it as recorded consumption plus estimated unrecorded consumption, adjusted for tourist consumption. Recorded consumption can use production, import, export, sales and taxation statistics.
Beer, wine, spirits and other alcoholic beverages are converted to their pure-alcohol equivalent so countries with different beverage mixes can be compared using one unit. The denominator includes the full resident population aged 15+, including people who abstain from alcohol.
The ranking therefore measures population alcohol exposure. It does not measure binge drinking, alcohol use disorder, alcohol-related deaths, disease incidence, drinking frequency or consumption among drinkers only.
Top 10 Countries and WHO-Listed Entities by Alcohol Consumption
The first seven positions are in the WHO European Region. Cameroon is eighth and is the highest-ranked African country, while Saint Lucia is tenth and is the highest-ranked country from the Americas.
Top 10 by total alcohol per capita consumption, WHO official estimates for 2024
| Rank | Entity | Value | Region / note |
|---|---|---|---|
| 1 | Romania | 17.07 L | Europe (WHO); 2024 official estimate. |
| 2 | Georgia | 14.40 L | Europe (WHO); 2024 official estimate. |
| 3 | Latvia | 14.18 L | Europe (WHO); 2024 official estimate. |
| 4 | Portugal | 13.75 L | Europe (WHO); 2024 official estimate. |
| 5 | Czechia | 13.52 L | Europe (WHO); 2024 official estimate. |
| 6 | Bulgaria | 13.25 L | Europe (WHO); 2024 official estimate. |
| 7 | Republic of Moldova | 12.99 L | Europe (WHO); 2024 official estimate. |
| 8 | Cameroon | 12.94 L | Africa (WHO); 2024 official estimate. |
| 9 | Spain | 12.07 L | Europe (WHO); 2024 official estimate. |
| 10 | Saint Lucia | 11.83 L | Americas (WHO); 2024 official estimate. |
Ranks are based on the underlying 2024 point estimates before display rounding.
Top 20 Alcohol Consumption Estimates in the 2024 WHO Ranking
Romania is the reference bar at 100%. The chart uses the same values and ranking universe as the main table.
Methodology
The numeric metric is WHO indicator EE6F72A / GHO code SA_0000001688, total alcohol per capita consumption among people aged 15+, expressed in litres of pure alcohol. The target year is 2024 and ranking direction is descending.
Single numeric source
All ranking values come from the World Health Organization. WHO Data is the numeric authority; secondary sites are not used as ranking inputs.
Entity universe
Eligibility follows the 188 countries, areas and territories named in WHO indicator metadata. An entity must also have a 2024 estimate to enter this ranking.
Why Cook Islands is included
WHO's metadata explicitly includes Cook Islands. Its 2024 estimate is 10.22 L, placing it at rank 30 after the eligible entities are sorted.
Why some territories are excluded
Current GHO-derived feeds can expose additional locations. They are excluded when they are not part of the WHO 188-entity metadata universe used for this country-style ranking.
Rank and rounding
Rank is based on raw point estimates. Display values are rounded to two decimals, so two displayed values can look equal even when underlying values differ.
Missing values and years
No older year is substituted for 2024. A WHO-listed entity without a 2024 estimate is not given a synthetic value and does not enter the Top 100.
WHO defines total APC as recorded alcohol consumption plus estimated unrecorded alcohol consumption, adjusted for tourist consumption. The components use three-year averages. The denominator is the midyear resident population aged 15+.
All 100 rows have status official_value: the point estimates are directly published by WHO. They are not StatRanker calculations and are not the separate WHO forecast series.
WHO reports uncertainty around this indicator. This ranking uses the published point estimate for ordering; it does not rank countries by the upper or lower confidence bound.
The indicator does not measure alcohol-related disease incidence, mortality, heavy episodic drinking, dependence, beverage preference or consumption among drinkers only.
Main Ranking: Top 100 by Alcohol Consumption per Capita
Use the controls to search the ranking, filter by WHO region or status, change sort order, or show only the Top 10 or Top 20.
WHO total alcohol per capita consumption, 2024 official estimates
| Rank | Entity | Value | Region / note |
|---|---|---|---|
| 1 | Romania | 17.07 L | Europe; WHO 2024 official estimate. |
| 2 | Georgia | 14.40 L | Europe; WHO 2024 official estimate. |
| 3 | Latvia | 14.18 L | Europe; WHO 2024 official estimate. |
| 4 | Portugal | 13.75 L | Europe; WHO 2024 official estimate. |
| 5 | Czechia | 13.52 L | Europe; WHO 2024 official estimate. |
| 6 | Bulgaria | 13.25 L | Europe; WHO 2024 official estimate. |
| 7 | Republic of Moldova | 12.99 L | Europe; WHO 2024 official estimate. |
| 8 | Cameroon | 12.94 L | Africa; WHO 2024 official estimate. |
| 9 | Spain | 12.07 L | Europe; WHO 2024 official estimate. |
| 10 | Saint Lucia | 11.83 L | Americas; WHO 2024 official estimate. |
| 11 | Austria | 11.60 L | Europe; WHO 2024 official estimate. |
| 12 | Andorra | 11.59 L | Europe; WHO 2024 official estimate. |
| 13 | Poland | 11.51 L | Europe; WHO 2024 official estimate. |
| 14 | Luxembourg | 11.42 L | Europe; WHO 2024 official estimate. |
| 15 | Hungary | 11.36 L | Europe; WHO 2024 official estimate. |
| 16 | Belarus | 11.29 L | Europe; WHO 2024 official estimate. |
| 17 | Lithuania | 11.23 L | Europe; WHO 2024 official estimate. |
| 18 | Serbia | 11.21 L | Europe; WHO 2024 official estimate. |
| 19 | France | 11.19 L | Europe; WHO 2024 official estimate. |
| 20 | Croatia | 10.94 L | Europe; WHO 2024 official estimate. |
| 21 | Germany | 10.93 L | Europe; WHO 2024 official estimate. |
| 22 | Slovenia | 10.74 L | Europe; WHO 2024 official estimate. |
| 23 | Viet Nam | 10.71 L | Western Pacific; WHO 2024 official estimate. |
| 24 | Australia | 10.51 L | Western Pacific; WHO 2024 official estimate. |
| 25 | United Kingdom | 10.44 L | Europe; WHO 2024 official estimate. |
| 26 | Russian Federation | 10.41 L | Europe; WHO 2024 official estimate. |
| 27 | Estonia | 10.38 L | Europe; WHO 2024 official estimate. |
| 28 | Brazil | 10.37 L | Americas; WHO 2024 official estimate. |
| 29 | Ireland | 10.27 L | Europe; WHO 2024 official estimate. |
| 30 | Cook Islands | 10.22 L | Western Pacific; WHO metadata entity; 2024 official estimate. |
| 31 | Montenegro | 10.17 L | Europe; WHO 2024 official estimate. |
| 32 | Barbados | 10.07 L | Americas; WHO 2024 official estimate. |
| 33 | United States | 9.56 L | Americas; WHO 2024 official estimate. |
| 34 | Belgium | 9.54 L | Europe; WHO 2024 official estimate. |
| 35 | Denmark | 9.53 L | Europe; WHO 2024 official estimate. |
| 36 | Finland | 9.39 L | Europe; WHO 2024 official estimate. |
| 37 | Canada | 9.24 L | Americas; WHO 2024 official estimate. |
| 38 | Slovakia | 9.07 L | Europe; WHO 2024 official estimate. |
| 39 | Seychelles | 9.00 L | Africa; WHO 2024 official estimate. |
| 40 | New Zealand | 8.85 L | Western Pacific; WHO 2024 official estimate. |
| 41 | Switzerland | 8.76 L | Europe; WHO 2024 official estimate. |
| 42 | Sweden | 8.68 L | Europe; WHO 2024 official estimate. |
| 43 | South Africa | 8.63 L | Africa; WHO 2024 official estimate. |
| 44 | Grenada | 8.58 L | Americas; WHO 2024 official estimate. |
| 45 | Greece | 8.58 L | Europe; WHO 2024 official estimate. |
| 46 | Netherlands | 8.56 L | Europe; WHO 2024 official estimate. |
| 47 | Namibia | 8.49 L | Africa; WHO 2024 official estimate. |
| 48 | Mauritius | 8.46 L | Africa; WHO 2024 official estimate. |
| 49 | Saint Vincent and the Grenadines | 8.44 L | Americas; WHO 2024 official estimate. |
| 50 | Italy | 8.44 L | Europe; WHO 2024 official estimate. |
| 51 | Saint Kitts and Nevis | 8.28 L | Americas; WHO 2024 official estimate. |
| 52 | Republic of Korea | 8.26 L | Western Pacific; WHO 2024 official estimate. |
| 53 | Antigua and Barbuda | 8.22 L | Americas; WHO 2024 official estimate. |
| 54 | Bahamas | 8.09 L | Americas; WHO 2024 official estimate. |
| 55 | Gabon | 8.00 L | Africa; WHO 2024 official estimate. |
| 56 | Thailand | 7.90 L | South-East Asia; WHO 2024 official estimate. |
| 57 | Iceland | 7.71 L | Europe; WHO 2024 official estimate. |
| 58 | Malta | 7.65 L | Europe; WHO 2024 official estimate. |
| 59 | Dominica | 7.34 L | Americas; WHO 2024 official estimate. |
| 60 | Panama | 7.20 L | Americas; WHO 2024 official estimate. |
| 61 | Mongolia | 7.14 L | Western Pacific; WHO 2024 official estimate. |
| 62 | Argentina | 7.10 L | Americas; WHO 2024 official estimate. |
| 63 | Norway | 6.95 L | Europe; WHO 2024 official estimate. |
| 64 | Paraguay | 6.90 L | Americas; WHO 2024 official estimate. |
| 65 | Mexico | 6.69 L | Americas; WHO 2024 official estimate. |
| 66 | Armenia | 6.60 L | Europe; WHO 2024 official estimate. |
| 67 | Chile | 6.58 L | Americas; WHO 2024 official estimate. |
| 68 | Bosnia and Herzegovina | 6.57 L | Europe; WHO 2024 official estimate. |
| 69 | Guyana | 6.50 L | Americas; WHO 2024 official estimate. |
| 70 | Japan | 6.26 L | Western Pacific; WHO 2024 official estimate. |
| 71 | North Macedonia | 6.23 L | Europe; WHO 2024 official estimate. |
| 72 | Philippines | 6.10 L | Western Pacific; WHO 2024 official estimate. |
| 73 | Eswatini | 6.09 L | Africa; WHO 2024 official estimate. |
| 74 | Suriname | 6.03 L | Americas; WHO 2024 official estimate. |
| 75 | Kazakhstan | 5.96 L | Europe; WHO 2024 official estimate. |
| 76 | Lao PDR | 5.92 L | Western Pacific; WHO 2024 official estimate. |
| 77 | Uruguay | 5.84 L | Americas; WHO 2024 official estimate. |
| 78 | Cuba | 5.53 L | Americas; WHO 2024 official estimate. |
| 79 | Zimbabwe | 5.42 L | Africa; WHO 2024 official estimate. |
| 80 | Equatorial Guinea | 5.28 L | Africa; WHO 2024 official estimate. |
| 81 | India | 5.24 L | South-East Asia; WHO 2024 official estimate. |
| 82 | Dominican Republic | 5.18 L | Americas; WHO 2024 official estimate. |
| 83 | Belize | 4.99 L | Americas; WHO 2024 official estimate. |
| 84 | Trinidad and Tobago | 4.98 L | Americas; WHO 2024 official estimate. |
| 85 | Burkina Faso | 4.94 L | Africa; WHO 2024 official estimate. |
| 86 | Colombia | 4.87 L | Americas; WHO 2024 official estimate. |
| 87 | Botswana | 4.87 L | Africa; WHO 2024 official estimate. |
| 88 | Cyprus | 4.86 L | Europe; WHO 2024 official estimate. |
| 89 | Peru | 4.78 L | Americas; WHO 2024 official estimate. |
| 90 | Jamaica | 4.36 L | Americas; WHO 2024 official estimate. |
| 91 | Sao Tome and Principe | 4.34 L | Africa; WHO 2024 official estimate. |
| 92 | Albania | 4.27 L | Europe; WHO 2024 official estimate. |
| 93 | Nicaragua | 4.26 L | Americas; WHO 2024 official estimate. |
| 94 | Lesotho | 4.24 L | Africa; WHO 2024 official estimate. |
| 95 | Israel | 4.19 L | Europe; WHO 2024 official estimate. |
| 96 | Côte d’Ivoire | 4.18 L | Africa; WHO 2024 official estimate. |
| 97 | Cambodia | 4.16 L | Western Pacific; WHO 2024 official estimate. |
| 98 | Rwanda | 4.14 L | Africa; WHO 2024 official estimate. |
| 99 | Benin | 4.09 L | Africa; WHO 2024 official estimate. |
| 100 | Cabo Verde | 4.07 L | Africa; WHO 2024 official estimate. |
All 100 rows use target year 2024 and the same WHO indicator. No older observations, forecasts or synthetic values are mixed into the table.
What Stands Out in the Top 100
Leader gap
Romania's 17.07 L estimate is 2.67 L above Georgia and 2.89 L above Latvia on the displayed values.
Top-end pattern
Seven of the first seven entries are in WHO Europe before Cameroon appears at rank 8. Saint Lucia is the first Americas entry at rank 10.
Regional concentration
The Top 100 contains 44 EURO entries, 27 AMRO, 17 AFRO, 10 WPRO and 2 SEARO entries.
Coverage detail
Cook Islands materially affects the ranking: its 10.22 L estimate places it at rank 30. Niue is also in WHO's metadata universe but its 2024 value is below the Top 100 cutoff.
How to Read the Ranking
A high rank means a higher estimated quantity of pure alcohol consumed per resident aged 15+, not that every resident drinks that amount. Abstainers are included in the denominator.
The results should not be interpreted as a direct ranking of alcohol-related harm. Countries with similar total APC can differ in drinking patterns, abstention, beverage mix and the distribution of consumption across the population.
The geographic rule is also important. This page follows the WHO indicator metadata universe rather than every territory that can appear in broader data feeds. That keeps inclusion reproducible and prevents additional territories from silently changing a country-focused Top 100.
These are 2024 official estimates. WHO also publishes a separate projection series for future years; those forecasts are not mixed into this ranking.
FAQ
Which country ranks first for alcohol consumption per capita?
Romania ranks first in this WHO 2024 ranking at 17.07 litres of pure alcohol per person aged 15+.
Are these 2026 alcohol consumption figures?
No. The target year is 2024. This page is published as a 2026 snapshot of the latest current dataset used for the ranking.
Are the values forecasts?
No. They are WHO official estimates for 2024. The separate WHO future projection series is not used.
Why is Cook Islands included?
Cook Islands is explicitly included in the 188 countries, areas and territories listed in WHO indicator metadata. Its 2024 estimate is 10.22 L, which places it at rank 30.
Why are some territories not included?
The ranking follows the entity list published in WHO indicator metadata rather than every additional location that can appear in broader GHO-derived feeds.
What does “litres of pure alcohol” mean?
Alcoholic beverages are converted to the amount of ethanol they contain, allowing beer, wine, spirits and other beverages to be compared using one common unit.
Does WHO include unrecorded alcohol?
Yes. Total APC combines recorded consumption with estimated unrecorded consumption and adjusts for tourist consumption.
Does 10 litres mean every adult drinks 10 litres?
No. It is a population average across all residents aged 15+, including abstainers.
What is the cutoff for the Top 100?
Cabo Verde is rank 100 at 4.07 L. Values below that point do not enter this Top 100.
Sources
WHO Data — Alcohol Consumption Indicator
Primary authority for the indicator definition, official-estimate status, methodology, entity metadata and dataset access.
WHO Machine-Readable Dataset
Current downloadable dataset linked by WHO for indicator EE6F72A; used as the reproducible numeric source for the 2024 ranking.
https://srhdpeuwpubsa.blob.core.windows.net/whdh/DATADOT/INDICATOR/EE6F72A_ALL_LATEST.csv
WHO Global Health Observatory — SDG Target 3.5
Official GHO context for alcohol consumption and confirmation that the global series includes 2024 estimates.
https://www.who.int/data/gho/data/themes/topics/sdg-target-3_5-substance-abuse
Related StatRanker Page — WHO Europe 2026 Forecast
Related internal analysis using a separate WHO projection series. It is not a numeric source for the 2024 ranking above.
https://statranker.org/disease/who-europe-alcohol-consumption-forecast-2026/
Related rankings
More StatRanker rankings on health systems, outcomes and medical capacity.
