

Tomato Production by Country 2026: Official FAOSTAT 2024 Ranking
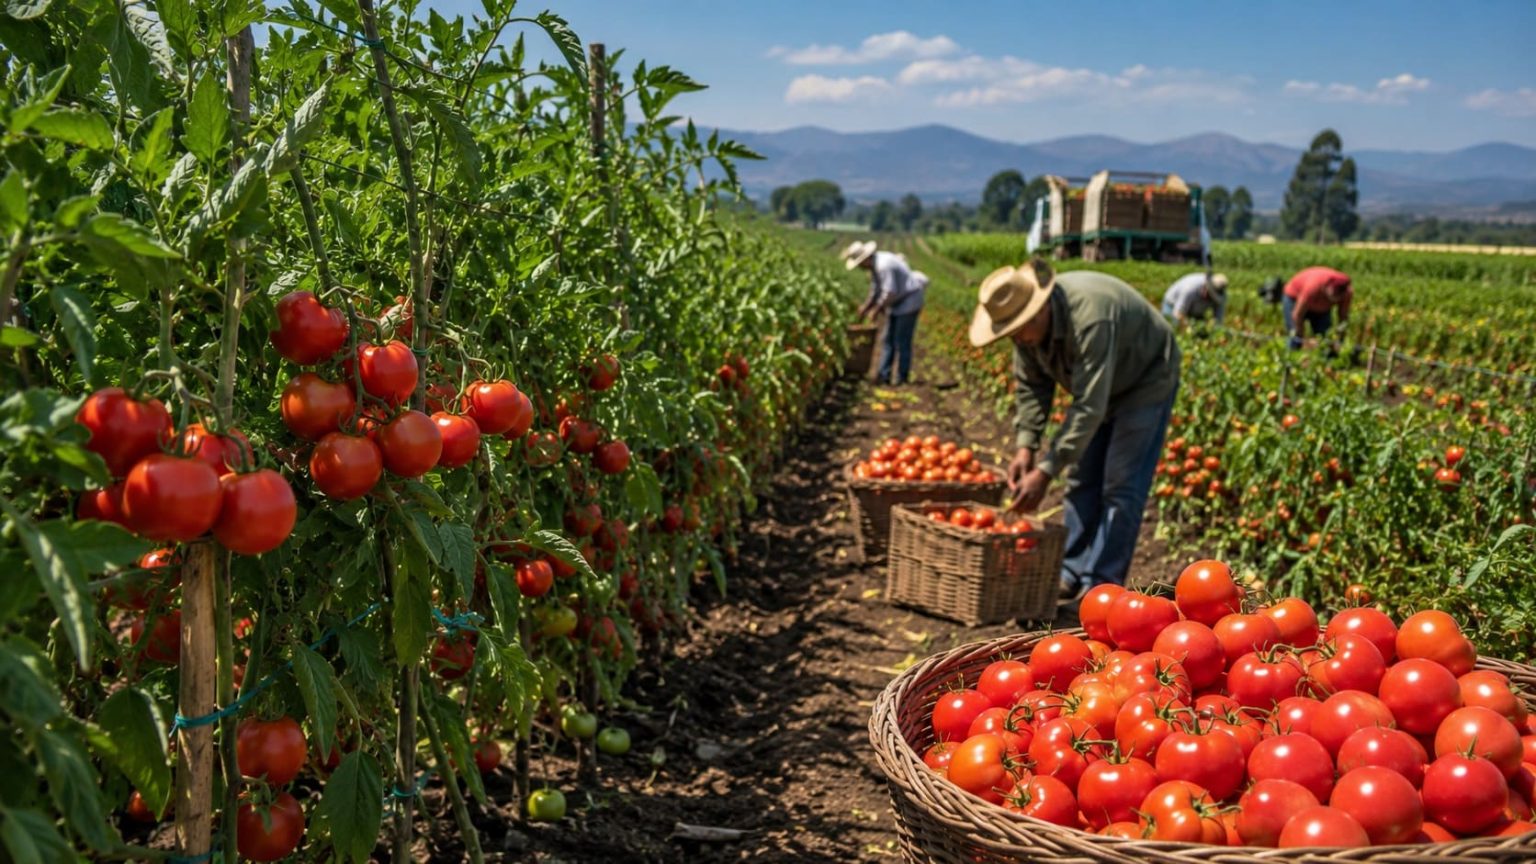
Global Tomato Production Ranking: FAOSTAT 2024 Snapshot
China produced more tomatoes than any other country in 2024, harvesting 61,614,748 tonnes. India followed with 21,323,224 tonnes, while Türkiye ranked third with 14,617,000 tonnes and the United States fourth with 10,683,555 tonnes.
The 2026 edition uses the latest globally comparable FAOSTAT crop-production data, which currently cover 2024. Production is measured in tonnes of harvested tomatoes, and the 50 countries shown here are ordered from largest to smallest producer.
Every country figure refers to 2024. The page does not estimate tomato production for 2026.
China produced 61,614,748 tonnes of tomatoes in 2024.
Zimbabwe is 50th among the countries included in the ranking.
The ten largest producers account for nearly three quarters of world output.
All 50 country figures refer to the same production year.
Where Global Tomato Production Is Concentrated
China stands well apart from the rest of the world. Its 2024 crop was almost three times India's and more than four times Türkiye's. Only four countries exceeded 10 million tonnes: China, India, Türkiye and the United States.
The leading group is geographically diverse. China, India and Türkiye occupy the first three positions in Asia. The United States, Mexico and Brazil place the Americas strongly in the Top 10. Italy and Spain are the largest European producers in the ranking, while Egypt and Nigeria represent Africa.
FAO measures production as the harvested quantity of the crop in basic product weight. That makes this a ranking of physical agricultural output. It is not a ranking of tomato exports, farm income, harvested area or yield per hectare.
World tomato production reached about 188.5 million tonnes in 2024. The ten largest producers supplied approximately 138.9 million tonnes, or 73.7% of the global total.
Top 10 Tomato Producing Countries in 2024
China leads by a margin of more than 40 million tonnes over India. Türkiye and the United States form the next tier, followed by Egypt and Italy. Spain, Mexico, Brazil and Nigeria complete the ten largest producers.
Top 10 countries by tomato production, FAOSTAT 2024
| Rank | Entity | Value | Region / Note |
|---|---|---|---|
| 1 | China | 61,614,748 t | Asia · FAOSTAT 2024 · published data |
| 2 | India | 21,323,224 t | Asia · FAOSTAT 2024 · published data |
| 3 | Türkiye | 14,617,000 t | Asia · FAOSTAT 2024 · published data |
| 4 | United States | 10,683,555 t | Americas · FAOSTAT 2024 · published data |
| 5 | Egypt | 7,521,072 t | Africa · FAOSTAT 2024 · published data |
| 6 | Italy | 6,022,790 t | Europe · FAOSTAT 2024 · published data |
| 7 | Spain | 4,574,280 t | Europe · FAOSTAT 2024 · published data |
| 8 | Mexico | 4,418,131 t | Americas · FAOSTAT 2024 · published data |
| 9 | Brazil | 4,407,502 t | Americas · FAOSTAT 2024 · published data |
| 10 | Nigeria | 3,726,167 t | Africa · FAOSTAT 2024 · published data |
FAOSTAT reports tomato production in tonnes.
Top 20 Tomato Producers in 2024
China's lead is immediately visible. Production falls sharply after the first four countries, then becomes much more tightly grouped from Egypt downward.
Methodology
Figures come from FAOSTAT's Crops and livestock products database for the item Tomatoes and the production year 2024. Countries are ordered by total production in tonnes, from highest to lowest.
What is measured
FAO defines crop production as the quantity harvested in basic product weight. For tomatoes, the unit used here is tonnes.
Why the page says 2026
The page reflects the latest data available for comparison in 2026. The production figures themselves are for 2024.
Coverage
The table covers the 50 largest tomato-producing countries in the 2024 series. World and regional totals are not counted as countries.
Regional grouping
Broad geographic labels follow the M49 structure used in FAOSTAT metadata. Türkiye is grouped with Asia, Russia with Europe and Australia with Oceania.
Data source
All production figures come from FAOSTAT. No commercial database or separate forecast has been added to the country totals.
Reported and estimated data
FAO primarily relies on national statistics, but some observations can be estimated or imputed when reported data are unavailable. FAOSTAT identifies those cases with its own source flags.
FAO receives crop statistics through national surveys, administrative systems, official publications and government sources. This makes FAOSTAT one of the main international references for comparing agricultural production across countries.
Where the source includes a fraction of a tonne, the visible figure is rounded to the nearest tonne. This does not change the order of countries in the ranking.
Production volume should not be confused with productivity or trade. A country may harvest a large crop because it devotes more land to tomatoes, while another may achieve a higher yield from a much smaller area. Export rankings can also look very different because much of a country's crop may be consumed or processed domestically.
Tomato Production by Country: Top 50
The table lists the 50 largest tomato producers in the 2024 FAOSTAT series. Search for a country, narrow the list by region or compare the largest producers directly.
Top 50 countries by tomato production, FAOSTAT 2024
| Rank | Entity | Value | Region / Note |
|---|---|---|---|
| 1 | China | 61,614,748 t | Asia · FAOSTAT 2024 · published data |
| 2 | India | 21,323,224 t | Asia · FAOSTAT 2024 · published data |
| 3 | Türkiye | 14,617,000 t | Asia · FAOSTAT 2024 · published data |
| 4 | United States | 10,683,555 t | Americas · FAOSTAT 2024 · published data |
| 5 | Egypt | 7,521,072 t | Africa · FAOSTAT 2024 · published data |
| 6 | Italy | 6,022,790 t | Europe · FAOSTAT 2024 · published data |
| 7 | Spain | 4,574,280 t | Europe · FAOSTAT 2024 · published data |
| 8 | Mexico | 4,418,131 t | Americas · FAOSTAT 2024 · published data |
| 9 | Brazil | 4,407,502 t | Americas · FAOSTAT 2024 · published data |
| 10 | Nigeria | 3,726,167 t | Africa · FAOSTAT 2024 · published data |
| 11 | Iran | 3,230,946 t | Asia · FAOSTAT 2024 · published data |
| 12 | Russia | 2,949,455 t | Europe · FAOSTAT 2024 · published data |
| 13 | Uzbekistan | 2,303,966 t | Asia · FAOSTAT 2024 · published data |
| 14 | Algeria | 1,762,920 t | Africa · FAOSTAT 2024 · published data |
| 15 | Portugal | 1,762,480 t | Europe · FAOSTAT 2024 · published data |
| 16 | Morocco | 1,686,615 t | Africa · FAOSTAT 2024 · published data |
| 17 | Ukraine | 1,470,500 t | Europe · FAOSTAT 2024 · published data |
| 18 | Tunisia | 1,430,770 t | Africa · FAOSTAT 2024 · published data |
| 19 | Argentina | 1,391,496 t | Americas · FAOSTAT 2024 · published data |
| 20 | Cameroon | 1,279,204 t | Africa · FAOSTAT 2024 · published data |
| 21 | Indonesia | 1,152,791 t | Asia · FAOSTAT 2024 · published data |
| 22 | Poland | 1,018,700 t | Europe · FAOSTAT 2024 · published data |
| 23 | Mozambique | 1,012,428 t | Africa · FAOSTAT 2024 · published data |
| 24 | Guinea | 960,331 t | Africa · FAOSTAT 2024 · published data |
| 25 | Chile | 909,867 t | Americas · FAOSTAT 2024 · published data |
| 26 | Colombia | 909,575 t | Americas · FAOSTAT 2024 · published data |
| 27 | Azerbaijan | 870,986 t | Asia · FAOSTAT 2024 · published data |
| 28 | Angola | 845,387 t | Africa · FAOSTAT 2024 · published data |
| 29 | Netherlands | 828,480 t | Europe · FAOSTAT 2024 · published data |
| 30 | Greece | 807,360 t | Europe · FAOSTAT 2024 · published data |
| 31 | Pakistan | 797,335 t | Asia · FAOSTAT 2024 · published data |
| 32 | Syria | 781,518 t | Asia · FAOSTAT 2024 · published data |
| 33 | Niger | 721,342 t | Africa · FAOSTAT 2024 · published data |
| 34 | France | 692,430 t | Europe · FAOSTAT 2024 · published data |
| 35 | Saudi Arabia | 682,569 t | Asia · FAOSTAT 2024 · published data |
| 36 | Malawi | 680,946 t | Africa · FAOSTAT 2024 · published data |
| 37 | Japan | 662,600 t | Asia · FAOSTAT 2024 · published data |
| 38 | Sudan | 643,024 t | Africa · FAOSTAT 2024 · published data |
| 39 | Kazakhstan | 616,522 t | Asia · FAOSTAT 2024 · published data |
| 40 | Jordan | 563,548 t | Asia · FAOSTAT 2024 · published data |
| 41 | Tanzania | 561,093 t | Africa · FAOSTAT 2024 · published data |
| 42 | Canada | 548,107 t | Americas · FAOSTAT 2024 · published data |
| 43 | Kenya | 510,902 t | Africa · FAOSTAT 2024 · published data |
| 44 | South Africa | 509,625 t | Africa · FAOSTAT 2024 · published data |
| 45 | Bangladesh | 491,488 t | Asia · FAOSTAT 2024 · published data |
| 46 | Iraq | 463,214 t | Asia · FAOSTAT 2024 · published data |
| 47 | Tajikistan | 462,080 t | Asia · FAOSTAT 2024 · published data |
| 48 | Guatemala | 452,936 t | Americas · FAOSTAT 2024 · published data |
| 49 | Australia | 437,596 t | Oceania · FAOSTAT 2024 · published data |
| 50 | Zimbabwe | 395,653 t | Africa · FAOSTAT 2024 · published data |
50 of 50 countries shown.
Key Patterns in Global Tomato Production
Key Insight: China's Lead
China produced about 40.3 million tonnes more tomatoes than India. Its lead over second place is larger than the entire annual output of any other country.
Notable Pattern: Top-10 Concentration
The ten largest producers supplied about 138.9 million tonnes, equal to 73.7% of world tomato production in 2024.
Regional Concentration: Asia at the Top
Asia occupies the first three places through China, India and Türkiye. The remaining Top 10 positions are divided among the Americas, Europe and Africa.
Outlier: Algeria and Portugal
Algeria and Portugal are separated by only about 440 tonnes at ranks 14 and 15, despite each producing more than 1.76 million tonnes.
What the Numbers Mean
The figures show where most of the world's tomatoes are grown. They measure total harvested output, so larger agricultural systems tend to rank highly even when their yields per hectare are not the world's highest.
Production and exports are also different measures. A large producer may consume or process most of its tomatoes domestically, while a smaller producer may send a greater share of its crop abroad.
The ranking is therefore best used to compare the scale of national tomato industries. Yield, harvested area, exports and farm value should be examined separately when the question is productivity, trade or economic importance.
Because every country is compared using the same 2024 production year, differences in rank reflect production levels rather than a mixture of different reporting years.
Download the Tomato Production by Country 2026: Official FAOSTAT 2024 Ranking dataset
Tomato Production by Country 2026: Official FAOSTAT 2024 Ranking
50 ranked entries · Excel + CSV + methodology + sources + chart · Snapshot: August 16, 2026 · Version 1.0
No signup required. The archive includes machine-readable data, methodology and source documentation. Quick human verification is required before the ZIP is delivered.
Download Excel + CSV Data PackFAQ
Which country produces the most tomatoes?
China is the world's largest tomato producer in the 2024 FAOSTAT data, with 61,614,748 tonnes.
Which countries produce the most tomatoes after China?
India ranks second with 21.32 million tonnes, Türkiye third with 14.62 million tonnes and the United States fourth with 10.68 million tonnes.
Why does the page say 2026 if the figures are from 2024?
The page is the 2026 edition of the ranking. FAOSTAT's latest globally comparable crop-production series currently ends in 2024, so the country figures use that year rather than estimating 2026 output.
How many tomatoes were produced worldwide in 2024?
World tomato production was approximately 188.5 million tonnes in the 2024 FAOSTAT series.
What does tomato production mean in FAOSTAT?
It refers to the harvested quantity of tomatoes expressed in basic product weight and reported in tonnes.
Does the largest producer also have the highest tomato yield?
Not necessarily. Yield measures output per unit of harvested area. A country can produce more tomatoes overall simply because it grows them across a much larger area.
Is tomato production the same as tomato exports?
No. Production measures the crop harvested inside a country, while exports measure tomatoes sold abroad. The two rankings can differ substantially.
Where does FAOSTAT get crop-production figures?
FAO primarily uses statistics supplied by national authorities through surveys, administrative records and official publications. Where reported information is incomplete, FAOSTAT may also use estimated or imputed observations and identifies them with source flags.
Sources
FAOSTAT — Crops and Livestock Products
Country-level tomato production figures for 2024.
FAO Data Catalog — Crop Production, Yield and Harvested Area
Definitions of production, units, geographic coverage and the way the crop-production dataset is compiled.
https://data.fao.org/catalog/dataset/d24a448b-3b62-4c09-8c1d-4a39bb599876
FAOSTAT QCL Metadata
Details on country reporting, estimates, observation flags, revisions and classifications used in FAOSTAT production statistics.
FAOSTAT
FAO's international database for food and agriculture statistics.
Download data archive
ZIP archive with CSV and HTML copies of the tables published on this page, plus external source links, a manifest and README. The archive does not add new estimates or recalculate ranking values.
Related rankings
More StatRanker pages connected by topic, category or ranking theme.
