

Apple Production by Country 2026: Official FAOSTAT 2024 Ranking
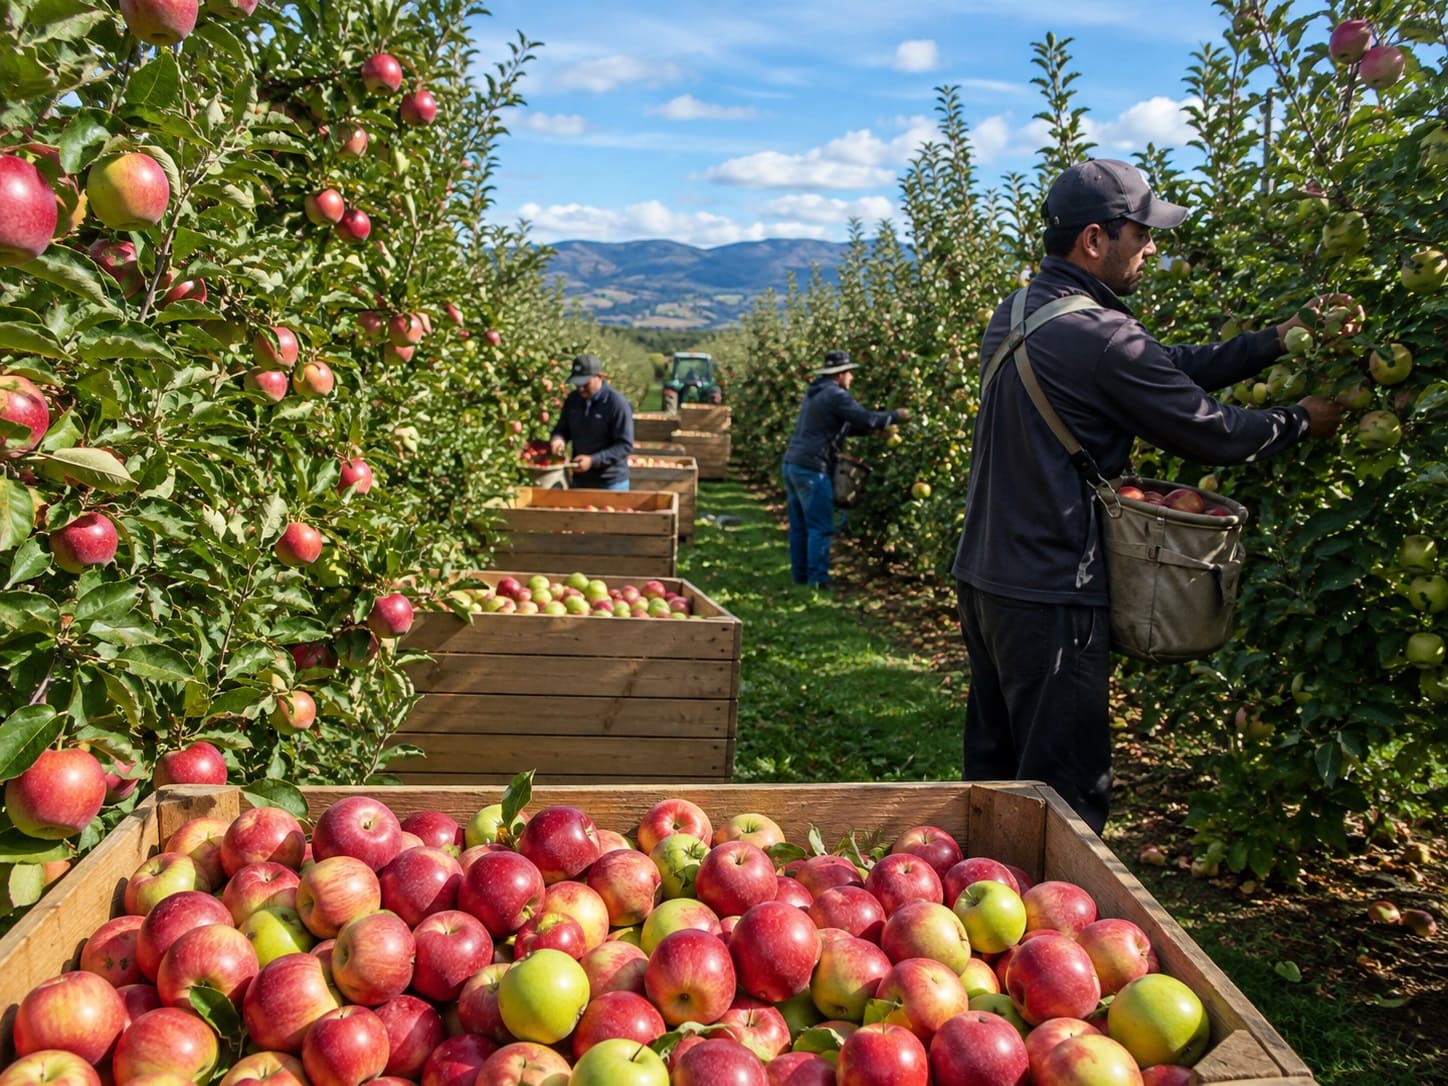
Apple production ranking based on FAOSTAT 2024 data
China produced 51.29 million tonnes of apples in 2024, more than ten times the output of the United States, which ranked second with 4.92 million tonnes. Türkiye ranked third with 4.42 million tonnes, followed by Poland and India.
This 2026 snapshot uses the latest globally comparable FAOSTAT apple-production year, 2024. Production is measured in tonnes and countries are ranked from highest to lowest output. The ranking contains historical values published in FAOSTAT and does not include 2026 forecasts or modeled production estimates.
FAOSTAT is the primary numeric source. The Top 50 accounts for approximately 98.67% of the 97.88 million tonnes recorded in the 2024 world aggregate.
China ranked first with 51,285,100 tonnes in 2024.
The United States ranked second and Türkiye ranked third.
The ranked countries account for approximately 98.67% of the 2024 world total.
50 historical values; 0 official forecasts; 0 modeled projections.
Overview: what apple production measures
FAOSTAT defines production as the amount produced during the year. For crop statistics, production refers to harvested output in basic product weight and can include quantities marketed, consumed directly on the farm and on-holding losses or wastage.
The ranking therefore measures physical apple output rather than crop value. It does not rank countries by harvested area, yield per hectare, exports, domestic consumption, orchard profitability or the value of processed apple products.
Production is highly concentrated at the top. China accounted for about 52.4% of the 2024 world total, while the five largest producers together accounted for about 68.1%. China, the United States, Türkiye and Poland were the only countries above three million tonnes.
Top 10 apple-producing countries in 2024
China leads by a wide margin. The United States and Türkiye form the next tier, while Poland is the only other country above three million tonnes. India, Italy and Iran each produced more than two million tonnes.
Top 10 countries by apple production, FAOSTAT 2024
| Rank | Country | Production | Region / source note |
|---|---|---|---|
| 1 | China | 51,285,100 t | East Asia & Pacific; historical value; FAOSTAT; 2024. |
| 2 | United States | 4,922,840 t | North America; historical value; FAOSTAT; 2024. |
| 3 | Türkiye | 4,420,185 t | Europe & Central Asia; historical value; FAOSTAT; 2024. |
| 4 | Poland | 3,384,500 t | Europe & Central Asia; historical value; FAOSTAT; 2024. |
| 5 | India | 2,625,899 t | South Asia; historical value; FAOSTAT; 2024. |
| 6 | Italy | 2,398,540 t | Europe & Central Asia; historical value; FAOSTAT; 2024. |
| 7 | Iran | 2,346,929 t | Middle East & North Africa; historical value; FAOSTAT; 2024. |
| 8 | Russian Federation | 2,014,406 t | Europe & Central Asia; historical value; FAOSTAT; 2024. |
| 9 | France | 1,964,030 t | Europe & Central Asia; historical value; FAOSTAT; 2024. |
| 10 | Uzbekistan | 1,482,332 t | Europe & Central Asia; historical value; FAOSTAT; 2024. |
Values are rounded to the nearest tonne for display. Countries are ranked from highest to lowest using the underlying FAOSTAT production value.
Chart: Top 20 apple producers in 2024
The scale of China’s harvest creates a steep distribution. Even the United States, the second-largest producer, recorded less than one-tenth of China’s output.
Methodology
The ranking uses FAOSTAT Production: Crops and livestock products, item Apples, element Production and reference year 2024. Values are measured in tonnes and ranked from highest to lowest.
Metric and unit
The metric is annual apple production. The source unit is tonnes, and no currency, per-capita or yield conversion is applied.
Production definition
FAO describes crop production as harvested production in basic product weight, including marketed quantities, direct farm consumption and on-holding losses or wastage.
2026 snapshot
The page is a 2026 snapshot based on 2024 production data. No synthetic 2026 country production figures are calculated.
Coverage
The ranking contains the 50 largest country-level observations. World totals, regional aggregates and other non-country entities are excluded.
Historical-value status
official_value identifies a historical value published by an official statistical source. It distinguishes historical observations from forecasts and modeled projections.
FAOSTAT observation flags
FAOSTAT separately identifies whether observations are reported, estimated, imputed, calculated or otherwise qualified. Those flags are distinct from the historical-value status used here.
Ranking and rounding
Ranks are calculated from the underlying numeric production values. Visible table values are rounded to the nearest tonne.
What the metric does not measure
The ranking does not measure yield, orchard area, exports, domestic consumption, crop value, farm profitability or processed-product output.
Main ranking: Top 50 countries by apple production
Use the controls to search by country, filter by region or status, change the sort order, or switch between the Top 10, Top 20 and all 50 entries.
Top 50 countries by apple production, FAOSTAT 2024
| Rank | Country | Production | Region / source note |
|---|---|---|---|
| 1 | China | 51,285,100 t | East Asia & Pacific; historical value; FAOSTAT; 2024. |
| 2 | United States | 4,922,840 t | North America; historical value; FAOSTAT; 2024. |
| 3 | Türkiye | 4,420,185 t | Europe & Central Asia; historical value; FAOSTAT; 2024. |
| 4 | Poland | 3,384,500 t | Europe & Central Asia; historical value; FAOSTAT; 2024. |
| 5 | India | 2,625,899 t | South Asia; historical value; FAOSTAT; 2024. |
| 6 | Italy | 2,398,540 t | Europe & Central Asia; historical value; FAOSTAT; 2024. |
| 7 | Iran | 2,346,929 t | Middle East & North Africa; historical value; FAOSTAT; 2024. |
| 8 | Russian Federation | 2,014,406 t | Europe & Central Asia; historical value; FAOSTAT; 2024. |
| 9 | France | 1,964,030 t | Europe & Central Asia; historical value; FAOSTAT; 2024. |
| 10 | Uzbekistan | 1,482,332 t | Europe & Central Asia; historical value; FAOSTAT; 2024. |
| 11 | South Africa | 1,327,545 t | Sub-Saharan Africa; historical value; FAOSTAT; 2024. |
| 12 | Chile | 1,299,064 t | Latin America & Caribbean; historical value; FAOSTAT; 2024. |
| 13 | Ukraine | 1,150,900 t | Europe & Central Asia; historical value; FAOSTAT; 2024. |
| 14 | Brazil | 997,470 t | Latin America & Caribbean; historical value; FAOSTAT; 2024. |
| 15 | Egypt | 959,101 t | Middle East & North Africa; historical value; FAOSTAT; 2024. |
| 16 | Germany | 871,990 t | Europe & Central Asia; historical value; FAOSTAT; 2024. |
| 17 | Pakistan | 854,372 t | South Asia; historical value; FAOSTAT; 2024. |
| 18 | Morocco | 852,161 t | Middle East & North Africa; historical value; FAOSTAT; 2024. |
| 19 | North Korea | 801,602 t | East Asia & Pacific; historical value; FAOSTAT; 2024. |
| 20 | Mexico | 779,724 t | Latin America & Caribbean; historical value; FAOSTAT; 2024. |
| 21 | Japan | 658,377 t | East Asia & Pacific; historical value; FAOSTAT; 2024. |
| 22 | Algeria | 591,698 t | Middle East & North Africa; historical value; FAOSTAT; 2024. |
| 23 | New Zealand | 575,214 t | East Asia & Pacific; historical value; FAOSTAT; 2024. |
| 24 | Spain | 545,080 t | Europe & Central Asia; historical value; FAOSTAT; 2024. |
| 25 | Argentina | 494,063 t | Latin America & Caribbean; historical value; FAOSTAT; 2024. |
| 26 | Romania | 487,140 t | Europe & Central Asia; historical value; FAOSTAT; 2024. |
| 27 | South Korea | 460,088 t | East Asia & Pacific; historical value; FAOSTAT; 2024. |
| 28 | United Kingdom | 408,047 t | Europe & Central Asia; historical value; FAOSTAT; 2024. |
| 29 | Moldova | 404,595 t | Europe & Central Asia; historical value; FAOSTAT; 2024. |
| 30 | Serbia | 389,196 t | Europe & Central Asia; historical value; FAOSTAT; 2024. |
| 31 | Canada | 386,368 t | North America; historical value; FAOSTAT; 2024. |
| 32 | Hungary | 376,680 t | Europe & Central Asia; historical value; FAOSTAT; 2024. |
| 33 | Belarus | 336,700 t | Europe & Central Asia; historical value; FAOSTAT; 2024. |
| 34 | Afghanistan | 333,838 t | South Asia; historical value; FAOSTAT; 2024. |
| 35 | Portugal | 313,210 t | Europe & Central Asia; historical value; FAOSTAT; 2024. |
| 36 | Azerbaijan | 300,023 t | Europe & Central Asia; historical value; FAOSTAT; 2024. |
| 37 | Australia | 293,731 t | East Asia & Pacific; historical value; FAOSTAT; 2024. |
| 38 | Tajikistan | 277,717 t | Europe & Central Asia; historical value; FAOSTAT; 2024. |
| 39 | Greece | 263,210 t | Europe & Central Asia; historical value; FAOSTAT; 2024. |
| 40 | Kazakhstan | 225,684 t | Europe & Central Asia; historical value; FAOSTAT; 2024. |
| 41 | Switzerland | 213,926 t | Europe & Central Asia; historical value; FAOSTAT; 2024. |
| 42 | Lebanon | 194,000 t | Middle East & North Africa; historical value; FAOSTAT; 2024. |
| 43 | Netherlands | 194,000 t | Europe & Central Asia; historical value; FAOSTAT; 2024. |
| 44 | Bosnia and Herzegovina | 191,900 t | Europe & Central Asia; historical value; FAOSTAT; 2024. |
| 45 | Syria | 184,814 t | Middle East & North Africa; historical value; FAOSTAT; 2024. |
| 46 | Austria | 175,560 t | Europe & Central Asia; historical value; FAOSTAT; 2024. |
| 47 | Belgium | 160,380 t | Europe & Central Asia; historical value; FAOSTAT; 2024. |
| 48 | Tunisia | 140,388 t | Middle East & North Africa; historical value; FAOSTAT; 2024. |
| 49 | Kyrgyzstan | 139,656 t | Europe & Central Asia; historical value; FAOSTAT; 2024. |
| 50 | North Macedonia | 127,696 t | Europe & Central Asia; historical value; FAOSTAT; 2024. |
The 50 ranked countries produced approximately 96.58 million tonnes combined, compared with a 2024 world aggregate of approximately 97.88 million tonnes.
Insights from the 2024 ranking
Key Insight
China accounted for about 52.4% of the 2024 world total and produced roughly 10.4 times as many apples as the United States.
Notable Pattern
The five largest producers—China, the United States, Türkiye, Poland and India—accounted for about 68.1% of global apple production.
Regional Concentration
Europe & Central Asia contributes a large number of countries to the Top 50, while China’s output gives East Asia exceptional weight by production volume.
Outlier
The production gap between China and the United States was approximately 46.36 million tonnes, larger than the annual output of any other country in the ranking.
What this ranking means
The table compares the physical scale of national apple harvests in a single reference year. It is useful for identifying the largest apple producers and understanding how concentrated global production is.
A high rank does not necessarily mean high orchard productivity. Total production depends on both harvested area and yield, so a country with extensive orchards can rank above a smaller producer with higher yields per hectare.
Production should also be distinguished from exports. Large producers may consume or process much of their harvest domestically, while smaller producers can export a larger share of output.
The values describe 2024 production. The 2026 label identifies the statistical snapshot and should not be interpreted as a forecast for the 2026 harvest.
Download the Apple Production by Country 2026: Official FAOSTAT 2024 Ranking dataset
Apple Production by Country 2026: Official FAOSTAT 2024 Ranking
50 ranked entries · Excel + CSV + methodology + sources + chart · Snapshot: August 16, 2026 · Version 1.0
No signup required. The archive includes machine-readable data, methodology and source documentation. Quick human verification is required before the ZIP is delivered.
Download Excel + CSV Data PackFAQ
Which country produces the most apples?
China ranked first in 2024 with 51,285,100 tonnes, equivalent to about 52.4% of the FAOSTAT world total.
Which countries rank after China?
The United States ranked second with 4,922,840 tonnes, followed by Türkiye with 4,420,185 tonnes and Poland with 3,384,500 tonnes.
Are these 2026 apple-production figures?
No. This is a 2026 snapshot based on FAOSTAT 2024 production data. No national 2026 production estimates are used.
What does FAOSTAT apple production measure?
It measures the quantity of apples produced during the year in tonnes.
How much of global apple production is covered by the Top 50?
The 50 ranked countries account for approximately 98.67% of the 2024 world aggregate.
What does historical value mean?
It means a past-year value published by an official statistical source rather than a forecast or modeled projection. FAOSTAT observation flags are treated separately.
Is production the same as yield?
No. Production measures total output in tonnes, while yield measures output relative to harvested area.
Is this an apple export ranking?
No. Production measures the domestic harvest, while exports measure cross-border shipments.
Sources
FAOSTAT — Production: Crops and livestock products
Primary source for country production values, the 2024 reference year, tonnes as the unit and the Apples commodity series.
FAO Data Catalog — Crop production, yield and harvested area
Methodological source for production definitions, dataset coverage, data lineage and FAOSTAT observation flags.
https://data.fao.org/catalog/iso/d24a448b-3b62-4c09-8c1d-4a39bb599876
Download data archive
ZIP archive with CSV and HTML copies of the tables published on this page, plus external source links, a manifest and README. The archive does not add new estimates or recalculate ranking values.
Related rankings
More StatRanker pages connected by topic, category or ranking theme.
