

Largest Cities in the World by Population: 2026 Snapshot Based on UN 2025 Estimates
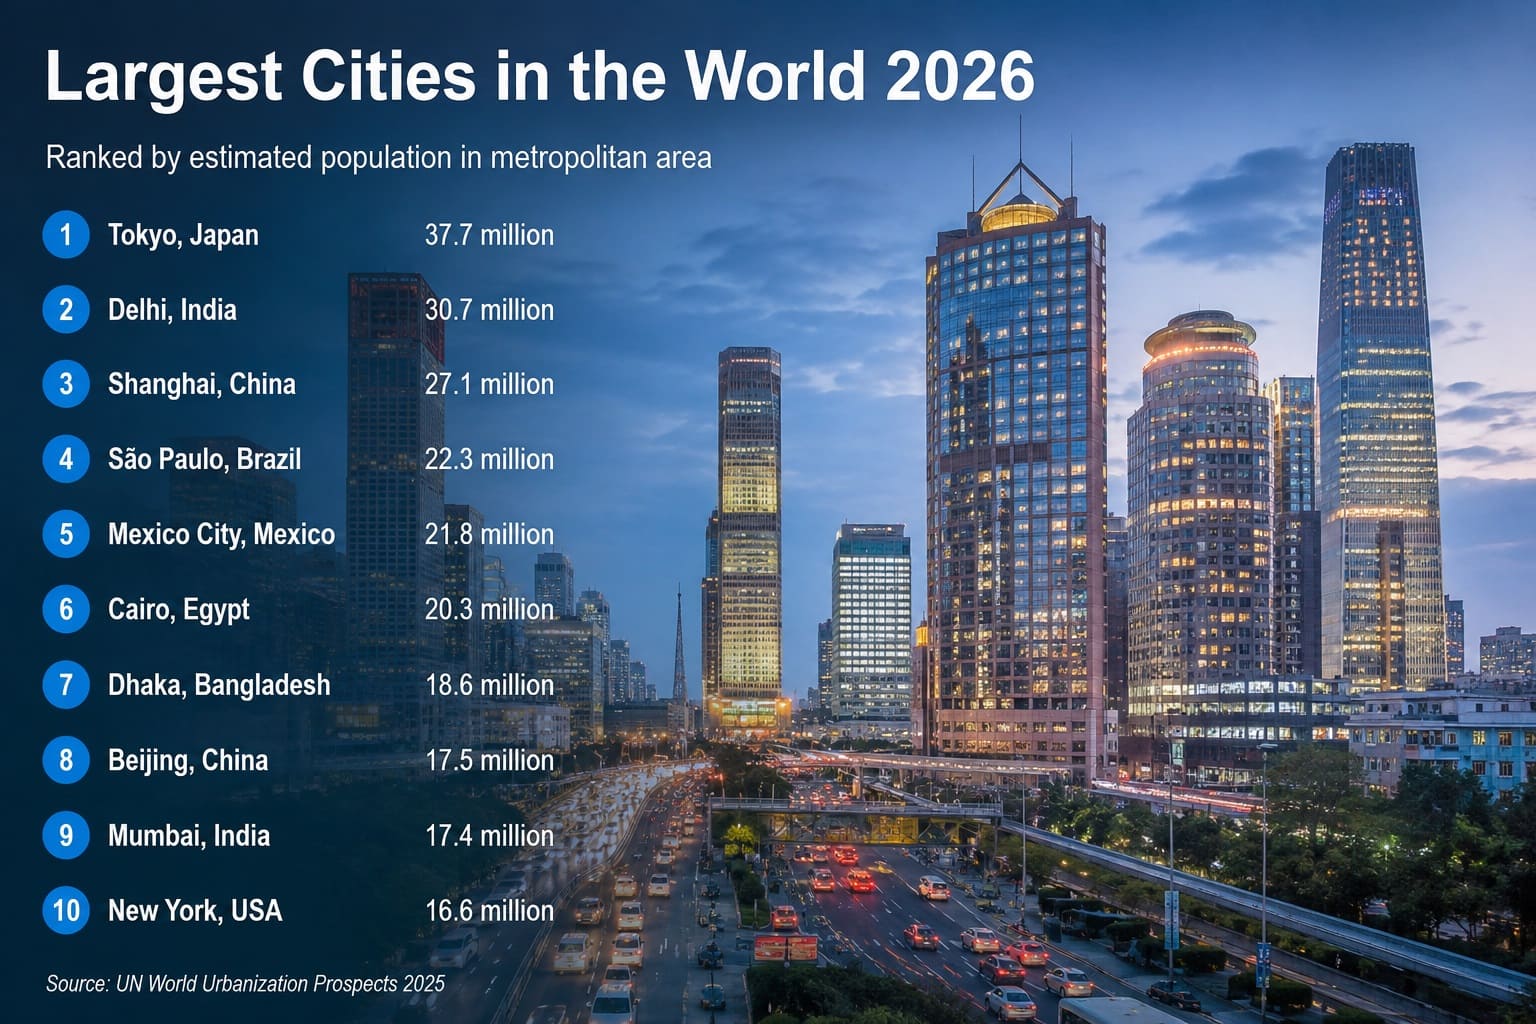
Largest Cities in the World 2026: Top 50 by Population
Jakarta is the largest city in the world in the latest official United Nations comparison, with an estimated 41.914 million residents. Dhaka ranks second at 36.585 million and Tokyo third at 33.413 million. This world city population ranking compares harmonized city footprints rather than municipal boundaries.
This is a 2026 snapshot based on the latest available official 2025 data. Every value is a UN World Urbanization Prospects 2025 estimate for 1 July 2025. The table does not contain a 2026 forecast, a modeled projection or a mixture of different reference years.
WUP 2025 covers more than 12,000 urban settlements with at least 50,000 residents, compared with a 300,000-person reporting threshold in the previous revision. It provides estimates through 2025 and projections to 2050. This page presents the Top 50 from that broader dataset and ranks total population only; it does not duplicate a Top 10 megacity or population-density ranking.
Continue exploring
More StatRanker rankings on health systems, outcomes and medical capacity.
Largest U.S. Cities by Population: 2026 Snapshot Based on 2025 Census Estimates
Open rankingMost Expensive U.S. Counties 2026: Top 100 by Median Home Value
Open rankingUS Cities by Job Growth, 2026
Open rankingCoverage: 50 cities. Unit: residents. Reference date: 1 July 2025. Direction: higher population ranks higher. All rows use one official UN source and one harmonized geographic method.
Jakarta ranks first under the UN’s harmonized 2025 city definition.
Johannesburg is the final entry in this Top 50, not the smallest settlement in WUP 2025.
Thirty-three cities have at least 10 million residents in the 2025 estimates.
The wider UN dataset covers urban settlements with populations of 50,000 or more.
Overview: how the biggest cities by population are compared
Lists of the most populated cities often disagree because “city” can refer to a municipality, a built-up urban area, an urban agglomeration or a metropolitan labour market. WUP 2025 improves international comparability by applying the Degree of Urbanization framework to population grids instead of relying only on national administrative definitions.
City proper
Population inside an administrative municipality. Boundaries are set by national or local government and can be much narrower or wider than the continuously developed urban area.
UN DEGURBA city
A dense, spatially connected urban centre identified with a common geospatial method. This is the boundary concept used for the UN city population values in this ranking.
Urban agglomeration
A broader statistical concept commonly used for a central city and surrounding continuous urban development. Definitions can differ between datasets and should not be mixed with this table.
Metropolitan area
A functional region that can include commuting zones and less-dense suburbs. It is generally wider than the dense city footprint used here.
What changed in UN WUP 2025
The 2025 revision expands city-level coverage to more than 12,000 settlements with at least 50,000 residents and applies a harmonized Degree of Urbanization method. This makes the dataset substantially broader than earlier UN tables that concentrated on settlements above 300,000 residents.
The ranking measures population size only. It does not rank population density, land area, metropolitan GDP, infrastructure quality, liveability, administrative importance or future growth. A city’s position can also change between revisions when the boundary method changes, even without a sudden demographic jump.
Top 10 largest cities in the world
Nine of the ten largest cities are in Asia. Cairo is the only African city in the Top 10, while no European or American city reaches the first ten positions under the UN’s harmonized 2025 definition.
Top 10 cities by official UN population estimate for 1 July 2025
| Rank | City | Population | Country / note |
|---|---|---|---|
| 1 | Jakarta | 41.914 million | Indonesia · Asia · Official UN estimate, 2025 · UN WUP 2025 |
| 2 | Dhaka | 36.585 million | Bangladesh · Asia · Official UN estimate, 2025 · UN WUP 2025 |
| 3 | Tōkyō (Tokyo) | 33.413 million | Japan · Asia · Official UN estimate, 2025 · UN WUP 2025 |
| 4 | New Delhi | 30.222 million | India · Asia · Official UN estimate, 2025 · UN WUP 2025 |
| 5 | Shanghai | 29.559 million | China · Asia · Official UN estimate, 2025 · UN WUP 2025 |
| 6 | Guangzhou | 27.563 million | China · Asia · Official UN estimate, 2025 · UN WUP 2025 |
| 7 | Al-Qahirah (Cairo) | 25.566 million | Egypt · Africa · Official UN estimate, 2025 · UN WUP 2025 |
| 8 | Manila | 24.735 million | Philippines · Asia · Official UN estimate, 2025 · UN WUP 2025 |
| 9 | Kolkata | 22.550 million | India · Asia · Official UN estimate, 2025 · UN WUP 2025 |
| 10 | Seoul | 22.490 million | Republic of Korea · Asia · Official UN estimate, 2025 · UN WUP 2025 |
All values are official UN estimates for 1 July 2025. Ranks use the underlying population values before display formatting.
Chart: Top 20 most populated cities
The chart uses the same UN city population values as the main table. It shows the steep gap at the top of the ranking and the continued concentration of the largest urban centres in Asia.
Methodology
The numeric source is the United Nations Department of Economic and Social Affairs, Population Division, World Urbanization Prospects 2025. The ranking uses the 2025 column of the official table WUP2025-F18-DEGURBA-100_Largest_Cities and publishes its first 50 entries in descending population order.
Metric, unit and direction
Metric: resident population within the UN’s harmonized city footprint. Unit: people. Direction: descending, so the largest population receives rank 1.
Reference date and status
Every row is an official UN estimate for 1 July 2025. WUP values after 2025 are projections and are not used in this 2026 snapshot.
DEGURBA thresholds
The city core is identified from connected 1 km² population-grid cells. An urban centre generally requires density of at least 1,500 residents per km² and a connected population of at least 50,000, with continuity and gap-filling rules applied by the method.
Coverage
The wider WUP 2025 city dataset includes more than 12,000 urban settlements with at least 50,000 residents. This page publishes the first 50 entries only, so “Top 50” matches the number of rows shown.
Inclusion and conflicts
Only the official UN values are used. Municipal counts, media rankings, commercial databases and metropolitan estimates are not substituted or averaged with the WUP figures.
Rounding and display
Population is displayed in millions to three decimal places. Formula: official population divided by 1,000,000. Ranking is based on the full underlying value, not the rounded label.
Names follow the UN table. A label such as Hajipur refers to the name assigned to a harmonized urban centre; the value should not be interpreted as the population inside the municipality of the same name. The same caution applies whenever an administrative place name is used for a larger connected urban footprint.
Limitations: these are internationally harmonized estimates, not simultaneous censuses or real-time headcounts. Results depend on population-grid quality, spatial resolution and boundary rules. The metric does not measure density, land area, economic output, quality of life, infrastructure capacity or future population change.
World city population table: Top 50
Search by city or country, filter by region, or change the display order to compare the published UN population estimates.
50 cities shown.
Largest cities in the world by official UN 2025 population estimate
| Rank | City | Population | Country / note |
|---|---|---|---|
| 1 | Jakarta | 41.914 million | Indonesia · Asia · Official UN estimate, 2025 · UN WUP 2025 |
| 2 | Dhaka | 36.585 million | Bangladesh · Asia · Official UN estimate, 2025 · UN WUP 2025 |
| 3 | Tōkyō (Tokyo) | 33.413 million | Japan · Asia · Official UN estimate, 2025 · UN WUP 2025 |
| 4 | New Delhi | 30.222 million | India · Asia · Official UN estimate, 2025 · UN WUP 2025 |
| 5 | Shanghai | 29.559 million | China · Asia · Official UN estimate, 2025 · UN WUP 2025 |
| 6 | Guangzhou | 27.563 million | China · Asia · Official UN estimate, 2025 · UN WUP 2025 |
| 7 | Al-Qahirah (Cairo) | 25.566 million | Egypt · Africa · Official UN estimate, 2025 · UN WUP 2025 |
| 8 | Manila | 24.735 million | Philippines · Asia · Official UN estimate, 2025 · UN WUP 2025 |
| 9 | Kolkata | 22.550 million | India · Asia · Official UN estimate, 2025 · UN WUP 2025 |
| 10 | Seoul | 22.490 million | Republic of Korea · Asia · Official UN estimate, 2025 · UN WUP 2025 |
| 11 | Karachi | 21.423 million | Pakistan · Asia · Official UN estimate, 2025 · UN WUP 2025 |
| 12 | Mumbai | 20.203 million | India · Asia · Official UN estimate, 2025 · UN WUP 2025 |
| 13 | São Paulo | 18.950 million | Brazil · Americas · Official UN estimate, 2025 · UN WUP 2025 |
| 14 | Krung Thep Maha Nakhon (Bangkok) | 18.180 million | Thailand · Asia · Official UN estimate, 2025 · UN WUP 2025 |
| 15 | Ciudad de México (Mexico City) | 17.734 million | Mexico · Americas · Official UN estimate, 2025 · UN WUP 2025 |
| 16 | Beijing | 17.013 million | China · Asia · Official UN estimate, 2025 · UN WUP 2025 |
| 17 | Lahore | 15.156 million | Pakistan · Asia · Official UN estimate, 2025 · UN WUP 2025 |
| 18 | Istanbul | 15.015 million | Türkiye · Asia · Official UN estimate, 2025 · UN WUP 2025 |
| 19 | Moskva (Moscow) | 14.525 million | Russian Federation · Europe · Official UN estimate, 2025 · UN WUP 2025 |
| 20 | Ho Chi Minh City | 14.053 million | Viet Nam · Asia · Official UN estimate, 2025 · UN WUP 2025 |
| 21 | Buenos Aires | 14.018 million | Argentina · Americas · Official UN estimate, 2025 · UN WUP 2025 |
| 22 | New York City | 13.920 million | United States of America · Americas · Official UN estimate, 2025 · UN WUP 2025 |
| 23 | Shenzhen | 13.878 million | China · Asia · Official UN estimate, 2025 · UN WUP 2025 |
| 24 | Bengaluru | 13.187 million | India · Asia · Official UN estimate, 2025 · UN WUP 2025 |
| 25 | Osaka | 12.964 million | Japan · Asia · Official UN estimate, 2025 · UN WUP 2025 |
| 26 | Lagos | 12.792 million | Nigeria · Africa · Official UN estimate, 2025 · UN WUP 2025 |
| 27 | Los Angeles | 12.740 million | United States of America · Americas · Official UN estimate, 2025 · UN WUP 2025 |
| 28 | Luanda | 11.370 million | Angola · Africa · Official UN estimate, 2025 · UN WUP 2025 |
| 29 | Chennai | 11.153 million | India · Asia · Official UN estimate, 2025 · UN WUP 2025 |
| 30 | Kinshasa | 10.944 million | Democratic Republic of the Congo · Africa · Official UN estimate, 2025 · UN WUP 2025 |
| 31 | Bogotá | 10.624 million | Colombia · Americas · Official UN estimate, 2025 · UN WUP 2025 |
| 32 | Lima | 10.580 million | Peru · Americas · Official UN estimate, 2025 · UN WUP 2025 |
| 33 | London | 10.416 million | United Kingdom · Europe · Official UN estimate, 2025 · UN WUP 2025 |
| 34 | Hajipur | 9.942 million | India · Asia · Official UN estimate, 2025 · UN WUP 2025 |
| 35 | Rio de Janeiro | 9.500 million | Brazil · Americas · Official UN estimate, 2025 · UN WUP 2025 |
| 36 | Paris | 9.382 million | France · Europe · Official UN estimate, 2025 · UN WUP 2025 |
| 37 | Hyderabad | 9.191 million | India · Asia · Official UN estimate, 2025 · UN WUP 2025 |
| 38 | Tehrān (Tehran) | 9.175 million | Iran (Islamic Republic of) · Asia · Official UN estimate, 2025 · UN WUP 2025 |
| 39 | Taipei | 9.137 million | China, Taiwan Province of China · Asia · Official UN estimate, 2025 · UN WUP 2025 |
| 40 | Bandung | 8.909 million | Indonesia · Asia · Official UN estimate, 2025 · UN WUP 2025 |
| 41 | Kuala Lumpur | 8.444 million | Malaysia · Asia · Official UN estimate, 2025 · UN WUP 2025 |
| 42 | Dar es Salaam | 7.795 million | United Republic of Tanzania · Africa · Official UN estimate, 2025 · UN WUP 2025 |
| 43 | Suzhou | 7.731 million | China · Asia · Official UN estimate, 2025 · UN WUP 2025 |
| 44 | Ahmedabad | 7.632 million | India · Asia · Official UN estimate, 2025 · UN WUP 2025 |
| 45 | Hangzhou | 7.500 million | China · Asia · Official UN estimate, 2025 · UN WUP 2025 |
| 46 | Wuhan | 7.364 million | China · Asia · Official UN estimate, 2025 · UN WUP 2025 |
| 47 | Tianjin | 7.285 million | China · Asia · Official UN estimate, 2025 · UN WUP 2025 |
| 48 | Alexandria | 7.267 million | Egypt · Africa · Official UN estimate, 2025 · UN WUP 2025 |
| 49 | Nagoya | 7.146 million | Japan · Asia · Official UN estimate, 2025 · UN WUP 2025 |
| 50 | Johannesburg | 7.077 million | South Africa · Africa · Official UN estimate, 2025 · UN WUP 2025 |
Source: UN World Urbanization Prospects 2025, city population estimates for 1 July 2025. Country and broad-region labels support navigation; the rank is determined only by population.
Insights from the Top 50 city population ranking
Key insight
Jakarta’s 41.914 million residents put it 5.329 million ahead of Dhaka. The gap between Jakarta and third-ranked Tokyo is 8.501 million.
Notable pattern
Thirty-three cities exceed 10 million residents. London, ranked 33rd at 10.416 million, is the final megacity before the table falls below that threshold.
Regional concentration
Asia accounts for 32 of the 50 entries, compared with eight in the Americas, seven in Africa and three in Europe. Nine of the Top 10 are Asian cities.
Outlier
Jakarta has about 5.9 times the population of Johannesburg, the fiftieth entry. Even the bottom of this ranking remains above seven million residents.
What this ranking means
This ranking is best read as a comparison of population inside consistently defined dense urban footprints. It is more suitable for global comparison than a list that mixes city-proper populations for some countries with metropolitan populations for others.
Jakarta’s position above Tokyo does not imply a sudden one-year population reversal. WUP 2025 applies a new harmonized geographic framework, so part of the difference from older rankings reflects how connected urban territory is identified and assigned to each city.
An official estimate is still an estimate. It combines national population statistics, gridded data and geospatial methods for a common date. The result is not a real-time headcount, the population governed by one municipality or a measure of how crowded the city feels.
For comparisons of urban agglomerations, metropolitan areas, city proper or population density, use a dataset built specifically for that boundary and metric. Those concepts should not be treated as interchangeable with this UN city population table.
FAQ
What is the largest city in the world in this 2026 snapshot?
Jakarta ranks first with an official UN estimate of 41.914 million residents for 1 July 2025 under the Degree of Urbanization city definition.
Are these actual 2026 population figures?
No. This is a 2026 snapshot based on the latest available official 2025 UN data. No 2026 population projection is inserted into the table.
How broad is the UN WUP 2025 city dataset?
WUP 2025 covers more than 12,000 urban settlements with populations of 50,000 or more. This article presents only the first 50 ranked cities.
Why does this ranking differ from older lists led by Tokyo?
WUP 2025 applies a harmonized geospatial definition based on dense, connected population-grid cells. The resulting city footprints can differ substantially from older national, administrative or urban-agglomeration boundaries.
Does “city” mean city proper?
No. Municipal boundaries are not the ranking boundary. The table uses a connected urban footprint defined through population density, total population and spatial continuity.
Is this an urban agglomeration or metropolitan-area ranking?
No. Those concepts can include different surrounding territory, especially commuting zones and lower-density suburbs. This page uses the UN Degree of Urbanization city series.
Why does Hajipur appear with almost 10 million residents?
Hajipur is the label used by the UN for a harmonized urban centre in the published table. The 9.942 million value describes that connected city footprint and should not be read as the population within Hajipur municipal limits.
How many megacities are included?
Thirty-three entries have at least 10 million residents. London is rank 33 at 10.416 million, while the next entry is below the megacity threshold.
What does the ranking not measure?
It does not measure density, urban land area, GDP, wealth, infrastructure, liveability, environmental impact, municipal service coverage or future growth.
Sources
UN World Urbanization Prospects 2025 data portal
Primary official environment for UN city estimates and projections.
WUP2025-F18-DEGURBA-100_Largest_Cities
Primary numeric table for this ranking. F18 lists the 100 largest cities by population at each mid-year point from 1975 to 2050; this page uses the 2025 column and publishes the first 50 entries.
World Urbanization Prospects 2025: Summary of Results
Context source for the main findings, urbanization patterns and interpretation of the 2025 Revision; it does not replace the F18 numeric table used for the ranking.
World Urbanization Prospects 2025: Methodology Report
Official explanation of the Degree of Urbanization framework, thresholds, data inputs, estimates, projections and limitations.
https://population.un.org/wup/assets/Publications/undesa_pd_2025_wup2025_methodological_report.pdf
UN DESA release page
Official release context for the 2025 Revision and its supporting publications.
https://www.un.org/development/desa/pd/world-urbanization-prospects-2025
Related rankings
More StatRanker rankings on health systems, outcomes and medical capacity.
Cities by Public Transport Monthly Pass Price, 2026
Open rankingU.S. Metro Areas by Monthly Rent, 2026
Open rankingUS Cities by Air Quality, 2026
Open rankingCalifornia Cities by Air Quality, 2026
Open ranking
StatRanker (Website)
administrator
