

Inflation Rate by Country: IMF 2025 Estimates and Latest WEO Observations
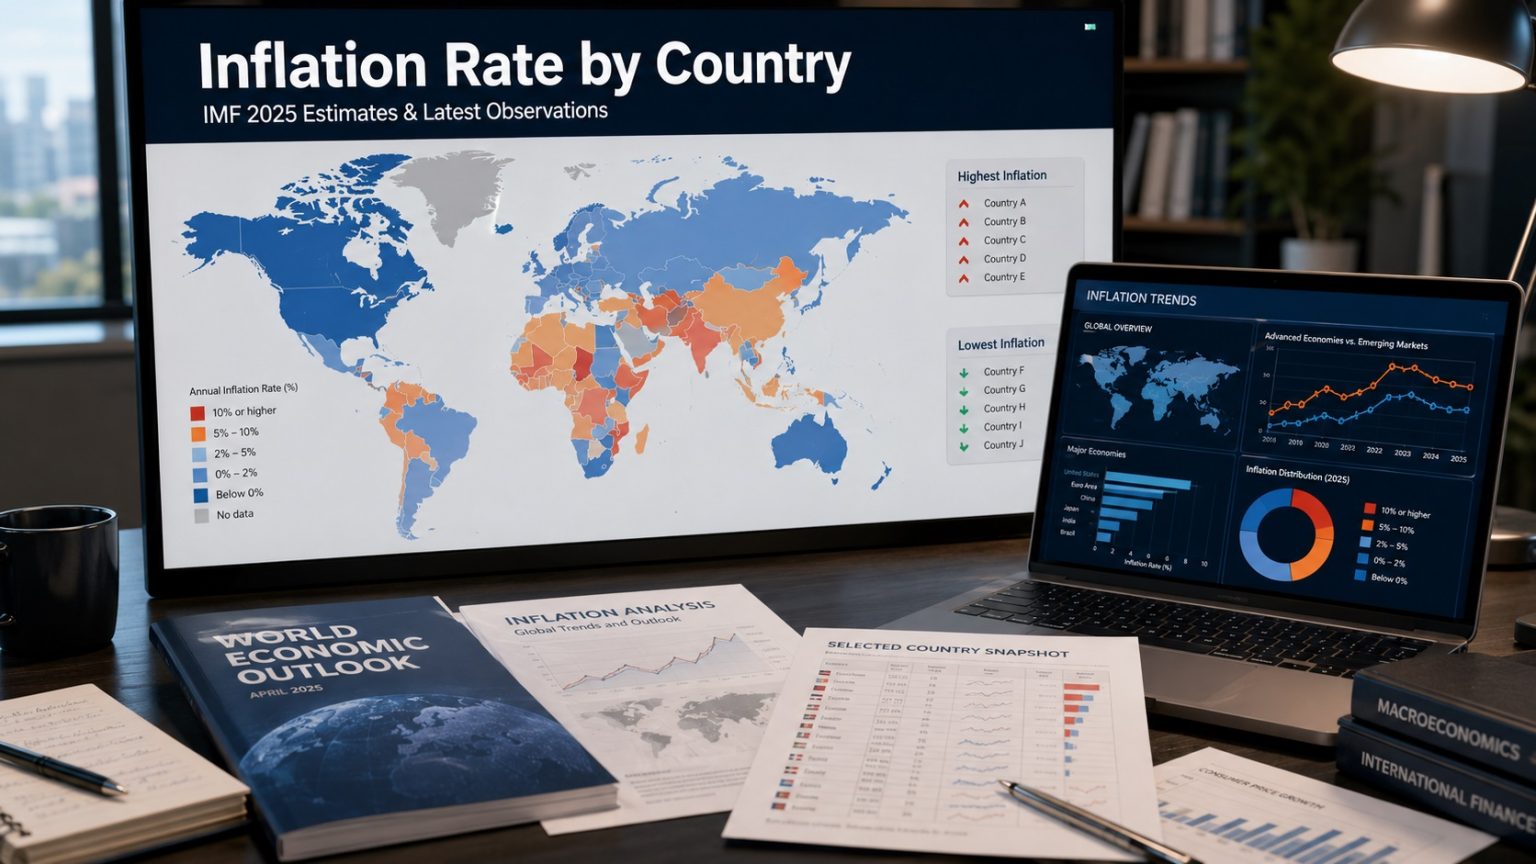
Top 10 Countries by IMF 2025 Average Inflation Estimate
This ranking compares countries by the IMF World Economic Outlook measure “inflation rate, average consumer prices.” The unit is annual percent change in the average consumer price index, and the ranking direction is descending because the table identifies the economies with the highest estimated average price increases in 2025.
The table is a compiled research dataset based on 3 sources, with row-level source and method notes shown in the ranking table. The primary source environment is the IMF World Economic Outlook database and IMF DataMapper metadata; a WEO-based public country table is used only as a display cross-check for the 10 country rows and one-decimal values.
Coverage is limited to 10 confirmed high-inflation country rows. All 10 rows are classified as official_forecast because they use IMF WEO estimate or forecast values for 2025. The page includes 0 official_value rows, 0 modeled_projection rows and no independent forecast calculations.
Continue exploring
More StatRanker pages connected by topic, category or ranking theme.
Top 50 Inflation Rate by Country 2026: IMF Annual-Average CPI Forecast
Open rankingTop 100 Countries by Inflation Rate (Consumer Prices), Latest Year
Open rankingTop 100 Countries by Food Inflation (%), 2025 — Full Ranking + Context
Open rankingKey inflation snapshot
Venezuela ranks first by IMF WEO annual-average consumer-price inflation estimate.
Malawi is the tenth entry in this verified snapshot; it is not the lowest-inflation country globally.
The page is labelled Top 10 because exactly 10 row-level country values are included.
Annual percent change in average consumer prices from an IMF WEO-based source trail.
0 official_value rows, 10 official_forecast rows, 0 modeled_projection rows.
Overview
Inflation rankings change depending on the CPI measure. This page uses annual-average consumer price inflation, not end-of-period inflation, monthly year-on-year inflation, food inflation, core inflation or a cost-of-living index. Annual-average inflation is useful for cross-country macro comparison because it summarizes the full year, but it can differ from the latest monthly reading when prices accelerate or slow sharply.
The upper end of the table is concentrated in economies exposed to currency stress, conflict, fiscal pressure, sanctions, supply disruption or fragile monetary conditions. Venezuela is the clear outlier, while South Sudan, Zimbabwe and Sudan form a second severe-inflation tier. Iran, Argentina, Burundi, Türkiye, Myanmar and Malawi remain far above normal inflation-targeting ranges even though their values are much lower than Venezuela’s.
Audit note: each row is included only when the source trail supports a country-level 2025 annual-average consumer-price inflation value tied to the IMF WEO PCPIPCH indicator. The ranking does not mix WEO estimates with national monthly CPI releases, end-of-period inflation, food inflation or 2026 projections.
Top 10 countries by IMF 2025 estimated average inflation
The table below shows the same verified entries as the main ranking. Values are annual percent changes in average consumer prices.
| Rank | Country | Inflation | Source / method note |
|---|---|---|---|
| 1 | Venezuela | 269.9% | Status: official_forecast; IMF WEO/DataMapper PCPIPCH indicator; target year 2025; annual-average CPI percent change; South America; no model. |
| 2 | South Sudan | 97.5% | Status: official_forecast; IMF WEO/DataMapper PCPIPCH indicator; target year 2025; annual-average CPI percent change; Africa; no model. |
| 3 | Zimbabwe | 89.0% | Status: official_forecast; IMF WEO/DataMapper PCPIPCH indicator; target year 2025; annual-average CPI percent change; Africa; no model. |
| 4 | Sudan | 87.2% | Status: official_forecast; IMF WEO/DataMapper PCPIPCH indicator; target year 2025; annual-average CPI percent change; Africa; no model. |
| 5 | Iran | 42.4% | Status: official_forecast; IMF WEO/DataMapper PCPIPCH indicator; target year 2025; annual-average CPI percent change; Asia; no model. |
| 6 | Argentina | 41.3% | Status: official_forecast; IMF WEO/DataMapper PCPIPCH indicator; target year 2025; annual-average CPI percent change; South America; no model. |
| 7 | Burundi | 37.3% | Status: official_forecast; IMF WEO/DataMapper PCPIPCH indicator; target year 2025; annual-average CPI percent change; Africa; no model. |
| 8 | Türkiye | 34.9% | Status: official_forecast; IMF WEO/DataMapper PCPIPCH indicator; target year 2025; annual-average CPI percent change; Asia; no model. |
| 9 | Myanmar | 31.0% | Status: official_forecast; IMF WEO/DataMapper PCPIPCH indicator; target year 2025; annual-average CPI percent change; Asia; no model. |
| 10 | Malawi | 28.2% | Status: official_forecast; IMF WEO/DataMapper PCPIPCH indicator; target year 2025; annual-average CPI percent change; Africa; no model. |
Rows are ranked from highest to lowest value. Equal-value tie handling is not needed in this verified Top 10.
Chart: Top 10 confirmed entries
Venezuela is scaled to the full bar width. The remaining bars show how steeply the ranking falls after the first entry.
Methodology
The ranked metric is inflation rate, average consumer prices. IMF defines the average consumer price index as a measure of a country’s average price level based on the cost of a typical basket of consumer goods and services, and the inflation rate as the percent change in the average CPI. The unit is annual percent change.
Metric and direction
Countries are sorted by 2025 average CPI inflation from highest to lowest. A higher value means faster average price growth across the year.
Source hierarchy
The source priority is IMF WEO and IMF DataMapper metadata. A WEO-based public table is treated only as a display cross-check for the row values.
Status labels
All included rows are official_forecast rows because the values are IMF WEO estimates or forecasts for 2025, not final annual national statistical-office CPI observations.
Rounding
Values are shown to one decimal place. No average, total, CAGR or trend parameter is calculated for this page.
Inclusion required a country name, numeric value, unit, target year, region, status, source name, source URL and method note. Country groups and regional aggregates are excluded. Monthly national CPI observations are excluded because monthly year-on-year inflation and annual-average WEO inflation are different statistical objects.
No modeled_projection rows are included. There is no base_year, base_value or projection formula because this page does not calculate country forecasts. Missing countries are not filled, interpolated or estimated. Conflicts are not averaged; if a row-level value cannot be tied to the source trail, the row is excluded.
The metric does not measure poverty, food inflation, rent inflation, median household cost pressure, monetary policy quality, purchasing-power loss since 2020 or the credibility of official CPI collection in each country. Fragile economies can have larger measurement uncertainty, and exchange-rate shocks can change monthly inflation conditions after the annual estimate.
Source audit path: IMF WEO/DataMapper defines the indicator and source environment; the WEO-based public country table is used as a row display check. The page is therefore a 2025 WEO-based estimate snapshot, not a live latest-observation monitor.
Country ranking
Use the controls to compare the 10 confirmed rows by region, IMF status and value. The fixed ranking is based on the 2025 IMF WEO annual-average consumer-price inflation estimate.
| Rank | Country | Inflation | Source / method note |
|---|---|---|---|
| 1 | Venezuela | 269.9% | Status: official_forecast; source: IMF WEO/DataMapper PCPIPCH; target year: 2025; region: South America; method: annual-average CPI percent change; no modeled projection. |
| 2 | South Sudan | 97.5% | Status: official_forecast; source: IMF WEO/DataMapper PCPIPCH; target year: 2025; region: Africa; method: annual-average CPI percent change; no modeled projection. |
| 3 | Zimbabwe | 89.0% | Status: official_forecast; source: IMF WEO/DataMapper PCPIPCH; target year: 2025; region: Africa; method: annual-average CPI percent change; no modeled projection. |
| 4 | Sudan | 87.2% | Status: official_forecast; source: IMF WEO/DataMapper PCPIPCH; target year: 2025; region: Africa; method: annual-average CPI percent change; no modeled projection. |
| 5 | Iran | 42.4% | Status: official_forecast; source: IMF WEO/DataMapper PCPIPCH; target year: 2025; region: Asia; method: annual-average CPI percent change; no modeled projection. |
| 6 | Argentina | 41.3% | Status: official_forecast; source: IMF WEO/DataMapper PCPIPCH; target year: 2025; region: South America; method: annual-average CPI percent change; no modeled projection. |
| 7 | Burundi | 37.3% | Status: official_forecast; source: IMF WEO/DataMapper PCPIPCH; target year: 2025; region: Africa; method: annual-average CPI percent change; no modeled projection. |
| 8 | Türkiye | 34.9% | Status: official_forecast; source: IMF WEO/DataMapper PCPIPCH; target year: 2025; region: Asia; method: annual-average CPI percent change; no modeled projection. |
| 9 | Myanmar | 31.0% | Status: official_forecast; source: IMF WEO/DataMapper PCPIPCH; target year: 2025; region: Asia; method: annual-average CPI percent change; no modeled projection. |
| 10 | Malawi | 28.2% | Status: official_forecast; source: IMF WEO/DataMapper PCPIPCH; target year: 2025; region: Africa; method: annual-average CPI percent change; no modeled projection. |
Source snapshot: IMF WEO average consumer price inflation indicator, IMF DataMapper PCPIPCH metadata and a WEO-based public country table used as a display cross-check. Values are annual percent change, target year 2025. No 2026 national monthly CPI releases are used for rank.
Insights
Venezuela is on a separate scale
At 269.9%, Venezuela is almost 2.8 times South Sudan’s 97.5% estimate and more than 9.5 times Malawi’s tenth-ranked value.
The second tier clusters near 90–100%
South Sudan, Zimbabwe and Sudan sit between 87.2% and 97.5%, indicating severe inflation without reaching Venezuela’s extreme level.
Africa accounts for half of the Top 10
Five of the ten rows are African economies: South Sudan, Zimbabwe, Sudan, Burundi and Malawi.
Türkiye stands out among larger middle-income economies
Türkiye’s 34.9% estimate places it in the Top 10 even though its inflation dynamics differ from the conflict and fragile-state cases around it.
What it means
High annual-average inflation means households face faster erosion of purchasing power, firms face less predictable input costs, and governments face harder choices around wages, transfers, exchange rates and interest rates. In the highest-ranked economies, inflation is often tied to currency pressure, fiscal stress, supply disruption, sanctions, conflict or weak monetary credibility rather than a normal business-cycle fluctuation.
For readers comparing countries, this ranking is best used as a macro risk signal. It does not say that every household in a high-inflation country faces the same price increase, because food, rent, transport and imported goods can move differently. It also does not identify the cheapest or most expensive countries; inflation measures the rate of change in prices, not the absolute price level.
The distinction between an IMF annual estimate and a monthly CPI observation matters. A country can rank high for 2025 because inflation was extreme earlier in the year, even if the latest monthly reading later slowed. The reverse can also happen when a late-year shock is not fully visible in the annual average.
FAQ
Which country has the highest IMF 2025 average inflation estimate in this table?
Venezuela ranks first, with a 2025 annual-average consumer price inflation estimate of 269.9% in this WEO-based snapshot.
Is this ranking based on monthly CPI data?
No. The ranked metric is annual-average consumer price inflation from the IMF World Economic Outlook framework. Monthly CPI releases are not mixed into the rank.
Why are all rows marked official_forecast?
The values are IMF WEO estimates or forecasts for 2025 rather than final annual national statistical-office CPI values independently collected for this page.
Does a high inflation rate mean the country is the most expensive?
No. Inflation measures how fast prices are rising. A country can have high inflation from a low price base, while another country can be expensive but have low annual inflation.
Why are there only 10 countries?
The page includes only 10 row-level values with country, value, unit, target year, status, source trail, region and method note. It is labelled as a Top 10 ranking, not a Top 100.
What is the difference between average and end-of-period inflation?
Average inflation compares the average CPI level across the year with the previous year’s average. End-of-period inflation compares the CPI at the end of the year with the end of the previous year. The two can differ sharply when prices accelerate or decelerate during the year.
Can the ranks change after a new IMF WEO release?
Yes. IMF WEO releases are updated as new data, country assumptions and forecasts change. A later WEO vintage can revise both values and country order.
Sources
International Monetary Fund — World Economic Outlook Database
Primary source environment for WEO macroeconomic indicators and forecast vintages. Used for database scope, forecast context and the source hierarchy behind the ranking.
IMF DataMapper — PCPIPCH indicator metadata
Used for the source-defined metric label, definition and unit: inflation rate, average consumer prices, annual percent change.
Visual Capitalist — WEO-based country display table
Used only as a public display cross-check for the country rows and one-decimal values shown in this Top 10. It is not treated as a separate official methodology.
Related rankings
More StatRanker pages connected by topic, category or ranking theme.
