

Top 100 Countries by Reptile Species Richness, 2026
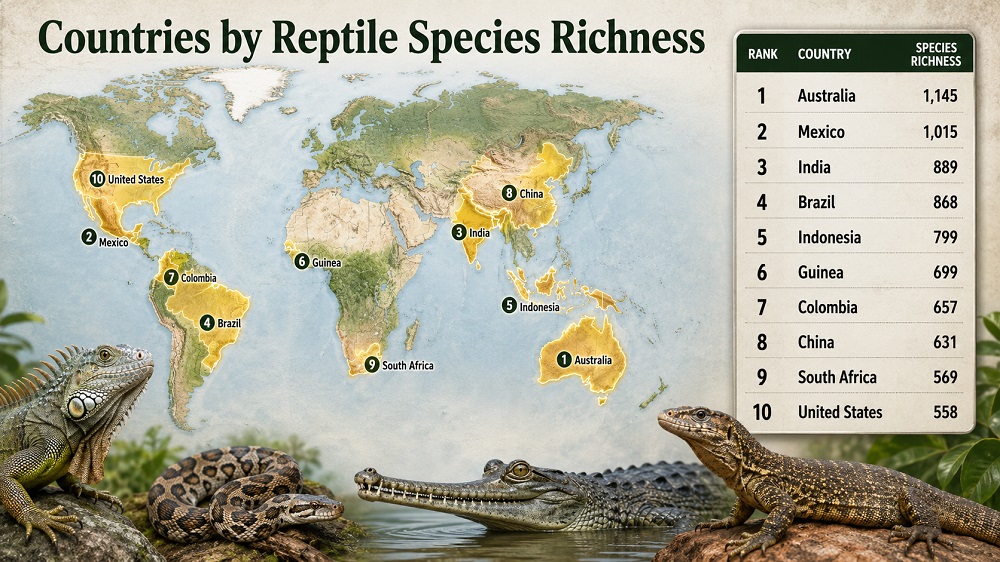
Countries and territories with the richest documented reptile faunas
Reptile species richness counts the number of recognized living reptile species reported for a country or territory. The metric covers lizards, snakes, turtles, tortoises, crocodilians, amphisbaenians and tuatara. It does not measure population size, habitat condition, extinction risk, protection quality or the number of individual animals.
The numeric ranking is reproduced from the BioDB “Reptiles Per Country” table. BioDB states that the country table was taken from The Reptile Database in April 2024. The 2026 label marks this page’s compilation and review snapshot, not a new 2026 taxonomic release and not a forecast.
The Reptile Database is treated here as the taxonomic reference named by BioDB. Catalogue of Life, GARD and GBIF are used only to clarify taxonomy, distribution-data context and comparability limits. They are not used to recalculate country totals. The source includes sovereign countries and selected territories, so the geography field is labelled “country / territory”. The cutoff keeps the full tie at rank 100, which leaves 101 visible rows.
Continue exploring
More StatRanker rankings on climate, environment, resources and sustainability.
Top 100 Countries by Bird Species Richness, 2026
Open rankingTop 100 Countries by Mammal Species Richness, 2026
Open rankingTop 100 Countries by Wild Mammal Species Richness, 2025
Open rankingAustralia ranks first in the BioDB country/territory table.
The full rank-100 tie is retained, giving 101 rows.
Reported count of recognized living reptile species.
Secondary compiled table; source note refers to The Reptile Database, April 2024.
What the ranking measures
Species richness is a biodiversity-count measure. A high total usually reflects some combination of land area, warm climate, habitat variety, island or continental isolation, evolutionary history and survey intensity. Tropical forests, savannas, deserts, mountain systems, coastal zones and island chains can all increase the number of reptile species recorded inside one jurisdiction.
The top of the table is not only a list of the largest countries. Australia leads because its long isolation, arid interior, tropical north and coastal forests support exceptional lizard and snake diversity. Mexico, India, Brazil and Indonesia rank high because each combines several climate zones and biogeographic regions. A smaller territory can still matter for conservation when many of its species are endemic, even if its total count is below the largest countries.
Top 10 countries and territories by reported reptile species richness
The top ten are led by warm, habitat-diverse countries with strong regional turnover. Australia and Mexico are the only entries above one thousand reported reptile species. India, Brazil and Indonesia form the next tier, while Colombia, China, South Africa and the United States show how mountains, deserts, forests, wetlands and latitude gradients can produce high reptile richness inside very different national settings.
| Rank | Country / territory | Reptile species | Interpretation note |
|---|---|---|---|
| 1 | Australia | 1,150 | Arid-zone lizard radiation, tropical northern habitats and long continental isolation |
| 2 | Mexico | 1,021 | Deserts, mountains, tropical forests and strong endemism |
| 3 | India | 900 | Himalayan margins, Western Ghats, dry zones, islands and coastal systems |
| 4 | Brazil | 878 | Amazon, Cerrado, Atlantic Forest and large tropical land area |
| 5 | Indonesia | 798 | Archipelago structure, rainforest systems and island endemism |
| 6 | Guinea | 704 | Source value retained; requires checklist-level verification before reuse |
| 7 | Colombia | 665 | Andes, Amazon, Caribbean lowlands and Chocó-related diversity |
| 8 | China | 644 | Large latitudinal range, mountains, subtropics and temperate zones |
| 9 | South Africa | 570 | Karoo, fynbos, savanna and subtropical coastal habitats |
| 10 | United States | 558 | Southwestern deserts, Southeast wetlands, coastlines and mountains |
Values are BioDB-reported species counts. They are not abundance estimates and should not be read as population totals.
Chart: leading reptile-rich countries and territories in the Top 20
Only five entries exceed 700 reported species, while the 20th entry is below 400. Australia’s source count is almost three times Iran’s Top 20 value, showing a steep drop after the leading biodiversity countries rather than an even distribution across the table.
Methodology
Reptile species richness is the count of unique recognized living reptile species reported as present within a country or territory. The numeric values in this ranking are reproduced from the BioDB “Reptiles Per Country” table, which identifies The Reptile Database, April 2024, as the source behind its country totals. The May 30, 2026 date reflects page compilation and review, not a new country-count release.
The Reptile Database is treated as the taxonomic reference named by BioDB. Catalogue of Life provides supporting context for taxonomic naming and synonym treatment. GARD and GBIF are cited for distribution and occurrence-data context. These sources help explain how reptile data are structured, but the country totals below are not independently recalculated from species-level ranges or occurrence records.
Counting logic
Species richness = count of unique living reptile species reported for the country or territory. The table uses species-level counts, not subspecies, specimens, observations or individual animals.
Data period
The numeric table is based on the BioDB country/territory table with an April 2024 source note. The 2026 label marks this page’s review snapshot.
Geographic coverage
The source includes sovereign countries and selected territories. Entries are kept as reported and grouped under the field “country / territory”.
Rounding and ties
Species counts are whole numbers. Equal values retain tied ranks where they occur. The rank-100 tie is kept, so the cutoff contains 101 rows.
Native status
The country-level source does not consistently separate native, introduced, vagrant, extinct-in-country or uncertain records. Native-only analysis requires species-by-species review.
Comparability limits
Counts can shift with taxonomic splitting, synonym treatment, boundary attribution, survey intensity, checklist completeness and data cleaning. Guinea’s value is the clearest entry requiring extra verification.
The table is useful as a screening layer for geographic comparison. Conservation decisions should add national checklists, species accounts, range maps, endemism, threat status, protected-area coverage and habitat-change data before drawing operational conclusions.
Top 100 cutoff by reported reptile species richness
The table lists every country or territory included at the Top 100 cutoff. Burkina Faso and Rwanda are tied at rank 100 with 83 reported species, so both are retained and the table contains 101 rows.
| Rank | Country / territory | Reptile species | Region |
|---|---|---|---|
| 1 | Australia | 1,150 | Oceania |
| 2 | Mexico | 1,021 | Americas |
| 3 | India | 900 | Asia |
| 4 | Brazil | 878 | Americas |
| 5 | Indonesia | 798 | Asia |
| 6 | Guinea | 704 | Africa |
| 7 | Colombia | 665 | Americas |
| 8 | China | 644 | Asia |
| 9 | South Africa | 570 | Africa |
| 10 | United States | 558 | Americas |
| 11 | Peru | 545 | Americas |
| 12 | Vietnam | 543 | Asia |
| 13 | Malaysia | 519 | Asia |
| 14 | Thailand | 501 | Asia |
| 15 | Ecuador | 498 | Americas |
| 16 | Argentina | 474 | Americas |
| 17 | Madagascar | 455 | Africa |
| 18 | Venezuela | 420 | Americas |
| 19 | Papua New Guinea | 415 | Oceania |
| 20 | Iran | 386 | Asia |
| 21 | Myanmar | 377 | Asia |
| 22 | Philippines | 373 | Asia |
| 23 | Mali | 369 | Africa |
| 24 | Republic of the Congo | 363 | Africa |
| 25 | Tanzania | 357 | Africa |
| 26 | Bolivia | 325 | Americas |
| 27 | Angola | 324 | Africa |
| 28 | Cameroon | 290 | Africa |
| 29 | Panama | 286 | Americas |
| 30 | Guatemala | 284 | Americas |
| 30 | Kenya | 284 | Africa |
| 32 | Honduras | 283 | Americas |
| 32 | Namibia | 283 | Africa |
| 34 | Sudan | 280 | Africa |
| 35 | Costa Rica | 269 | Americas |
| 36 | Oman | 253 | Asia |
| 37 | Sri Lanka | 252 | Asia |
| 38 | Niger | 251 | Africa |
| 39 | Ethiopia | 244 | Africa |
| 40 | Mozambique | 225 | Africa |
| 40 | South Sudan | 225 | Africa |
| 42 | Somalia | 224 | Africa |
| 43 | Laos | 220 | Asia |
| 44 | Pakistan | 214 | Asia |
| 45 | Nigeria | 207 | Africa |
| 46 | Central African Republic | 205 | Africa |
| 47 | Cambodia | 199 | Asia |
| 48 | Paraguay | 193 | Americas |
| 49 | Zambia | 192 | Africa |
| 50 | Nicaragua | 188 | Americas |
| 51 | Ghana | 187 | Africa |
| 51 | Zimbabwe | 187 | Africa |
| 53 | Uganda | 186 | Africa |
| 54 | Cuba | 181 | Americas |
| 55 | Guyana | 177 | Americas |
| 56 | Botswana | 161 | Africa |
| 56 | Côte d’Ivoire | 161 | Africa |
| 58 | New Caledonia | 159 | Oceania |
| 58 | Suriname | 159 | Americas |
| 58 | Togo | 159 | Africa |
| 61 | Georgia | 158 | Europe / Asia |
| 62 | Turkey | 154 | Europe / Asia |
| 63 | El Salvador | 153 | Americas |
| 64 | Dominica | 152 | Americas |
| 65 | Chile | 149 | Americas |
| 66 | Bangladesh | 148 | Asia |
| 67 | Nepal | 144 | Asia |
| 68 | Belize | 139 | Americas |
| 69 | Dominican Republic | 135 | Americas |
| 69 | Singapore | 135 | Asia |
| 71 | Benin | 134 | Africa |
| 72 | Gabon | 133 | Africa |
| 73 | Chad | 130 | Africa |
| 74 | Malawi | 127 | Africa |
| 74 | Senegal | 127 | Africa |
| 76 | Haiti | 126 | Americas |
| 77 | Saudi Arabia | 123 | Asia |
| 78 | Jordan | 120 | Asia |
| 79 | Egypt | 119 | Africa / Asia |
| 79 | Taiwan | 119 | Asia |
| 81 | Iraq | 118 | Asia |
| 82 | Afghanistan | 117 | Asia |
| 82 | Equatorial Guinea | 117 | Africa |
| 82 | Yemen | 117 | Asia |
| 85 | Algeria | 111 | Africa |
| 86 | Morocco | 109 | Africa |
| 87 | Liberia | 108 | Africa |
| 88 | Japan | 105 | Asia |
| 89 | Syria | 103 | Asia |
| 90 | Sierra Leone | 100 | Africa |
| 91 | Mauritania | 98 | Africa |
| 92 | Eritrea | 96 | Africa |
| 93 | Israel | 95 | Asia |
| 94 | Turkmenistan | 91 | Asia |
| 95 | Bhutan | 90 | Asia |
| 95 | Russia | 90 | Europe / Asia |
| 97 | Gambia | 89 | Africa |
| 98 | Solomon Islands | 87 | Oceania |
| 99 | New Zealand | 86 | Oceania |
| 100 | Burkina Faso | 83 | Africa |
| 100 | Rwanda | 83 | Africa |
Source: BioDB “Reptiles Per Country”, with table data taken from The Reptile Database in April 2024. Region labels are broad geographic groupings for filtering and do not change source values.
Insights from the reptile species richness ranking
The upper tier is driven by countries where warm climate and habitat variety intersect with either large land area or long biogeographic isolation. Australia is the clearest outlier because reptiles have diversified strongly across arid, tropical and coastal environments. Mexico, India, Brazil and Indonesia reach high totals through a different route: broad climate gradients, complex terrain and major habitat transitions.
The middle of the cutoff is heavily tropical and subtropical, with many African, Latin American and Asian entries. These countries often contain forest-savanna transitions, drylands, mountains, wetlands and coastlines, but their exact position can be affected by checklist quality and survey history. A country with stronger recent survey coverage may appear richer than a less-studied neighbour even when ecological conditions are similar.
The lower end of the cutoff still contains important reptile conservation geographies. Countries and territories near rank 100 may have fewer reported species overall, but island systems and isolated habitats can hold narrow-range endemics. New Caledonia, Madagascar, New Zealand and Caribbean entries show why total richness should be read together with endemism and threat status.
What this ranking means for readers
Reptile richness helps readers identify where documented reptile diversity is concentrated. It explains why countries such as Australia, Mexico, India, Brazil and Indonesia often appear in biodiversity discussions: they contain large numbers of recognized species and, in many cases, many species with restricted ranges.
For analysts, the table is best used as a starting filter. It can guide follow-up questions about survey gaps, protected-area coverage, national checklist quality, habitat diversity and climate gradients. It should not be used alone to rank conservation need, because a country with fewer species can still contain highly threatened or irreplaceable reptiles.
For conservation and policy work, the practical value comes from combining this table with endemism, IUCN threat categories, habitat-loss data, legal protection, species-level range maps and occurrence records. A high species count signals broad biodiversity responsibility; a high endemic share signals irreplaceability.
FAQ
Does a higher reptile species count mean a country protects reptiles better?
No. Species richness measures how many species are reported, not whether they are well protected. Conservation performance requires separate evidence such as protected-area coverage, enforcement, threat status, habitat trends and population monitoring.
Why can a smaller country or territory appear high in the ranking?
Small places can rank high when they sit in tropical zones, include islands, have complex terrain or contain many endemic species. In conservation terms, endemism can make a smaller territory highly important even when its total species count is below the largest countries.
Why is Guinea flagged in the article?
Guinea’s BioDB-reported value of 704 species is unusually high compared with many surrounding entries. It is kept because it appears in the source table, but it should be verified against national checklists and species-level distribution records before being reused in scientific or policy analysis.
Are introduced species included?
The BioDB country-level table does not consistently separate native, introduced, vagrant or uncertain records. A native-only ranking would require a taxon-by-taxon review of origin status, locality evidence and range history.
Why does the table have 101 rows if it uses a Top 100 cutoff?
The source ranking has a tie at rank 100: Burkina Faso and Rwanda both have 83 reported species. Keeping both tied entries avoids removing one country arbitrarily.
Can this ranking be compared with bird, mammal or amphibian richness rankings?
Broad comparisons are possible, but each taxonomic group has different survey histories, taxonomic revisions, habitat associations and data sources. Reptile richness is especially sensitive to revisions in lizards and snakes, so cross-group comparisons should be made carefully.
Sources
The numeric ranking uses one direct country/territory source table. Additional sources are included only for taxonomy, distribution context and interpretation limits.
- BioDB — Reptiles Per Country. Direct numeric source for the country and territory species counts, including the April 2024 source note referring to The Reptile Database.
- The Reptile Database. Taxonomic reference named by BioDB; covers living reptiles such as turtles, snakes, lizards, crocodiles, tuataras and amphisbaenians.
- Catalogue of Life — The Reptile Database dataset. Supporting taxonomic context for naming, synonymy and checklist interpretation.
- Global Assessment of Reptile Distributions (GARD). Distribution-data context for reptile range mapping and species-level geographic interpretation.
- GBIF. Occurrence-data context showing why point records, range maps and checklist totals are different data types and should not be mixed without review.
Related rankings
More StatRanker rankings on climate, environment, resources and sustainability.
Top 100 Countries by Threatened Mammal and Bird Species Count, 2026 Snapshot
Open rankingTop 100 Countries by Threatened Plant Species, 2025
Open rankingTop 100 Countries by Bird Species Diversity, 2025
Open rankingTop 100 Largest Countries by Land Area, 2026 Snapshot
Open ranking
StatRanker (Website)
administrator
