

Top 100 Countries by Mammal Species Richness, 2026
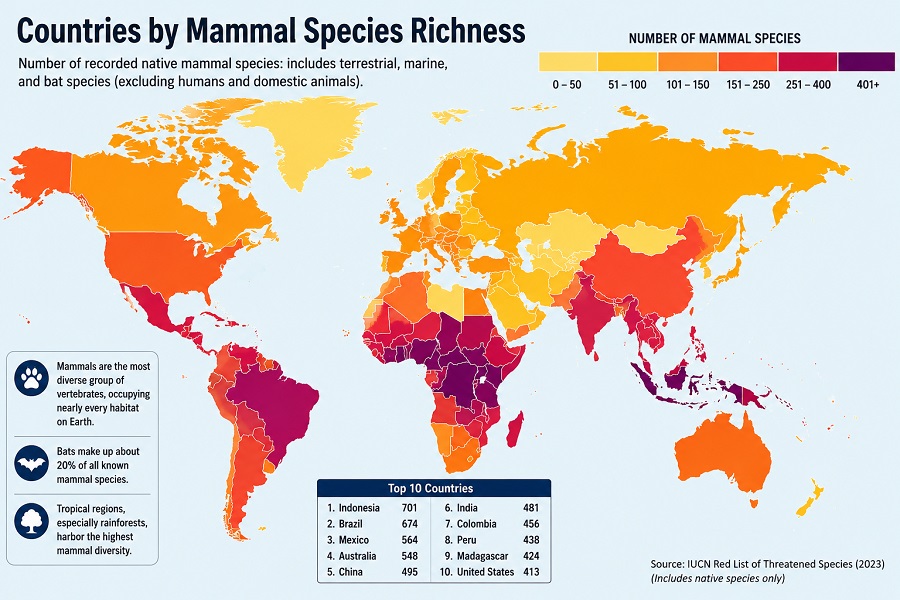
Countries with the highest recorded mammal species richness
Mammal species richness measures how many living wild mammal species are recorded for a country in a selected taxonomic and distribution release. It is a count of species, not a count of individual animals, population size, habitat quality or conservation success.
This 2026 ranking uses the country table from the American Society of Mammalogists Mammal Diversity Database, version 2.4, released on January 2, 2026. The unit is the number of living wild mammal species. Country totals can change when taxonomy is revised, when species are split or lumped, or when country-occurrence coding is corrected.
Indonesia ranks first with 793 living wild mammal species, followed by Brazil with 785 and China with 746. The strongest concentrations appear where tropical climate, large habitat gradients, mountains, rainforests, river basins and island turnover overlap.
Continue exploring
More StatRanker rankings on climate, environment, resources and sustainability.
Top 100 Countries by Wild Mammal Species Richness, 2025
Open rankingTop 100 Countries by Threatened Mammal and Bird Species Count, 2026 Snapshot
Open rankingTop 100 Countries by Reptile Species Richness, 2026
Open rankingIndonesia has the highest listed count of living wild mammal species in MDD v2.4.
The table contains 100 sovereign states ranked by species count.
The value is a count of living wild mammal species, not individuals or populations.
ASM Mammal Diversity Database v2.4, released January 2, 2026.
How to read mammal species richness
Species richness is a concentration measure. It shows where the number of recorded mammal species is especially high, but it does not say whether those species are common, rare, increasing, declining or adequately protected. A country can rank high because it hosts many species and still face severe habitat loss or hunting pressure.
The upper tier is not simply a list of the largest countries. Brazil, China and the United States benefit from vast territory, but Ecuador reaches the top ten despite its much smaller area because the Andes-to-Amazon gradient creates intense ecological turnover. Indonesia leads because island geography, tropical forests, mountain systems and high endemism combine inside a very large archipelago.
Top 10 countries by mammal species richness
The top ten are dominated by the tropics and by countries spanning more than one major ecological system. Southeast Asia, the Amazon-Andes corridor, Central America, the Congo Basin and large continental transition zones all appear near the top.
| Rank | Country | Mammal species | Region |
|---|---|---|---|
| 1 | Indonesia | 793 | Asia |
| 2 | Brazil | 785 | Americas |
| 3 | China | 746 | Asia |
| 4 | Mexico | 585 | Americas |
| 5 | Peru | 582 | Americas |
| 6 | Colombia | 532 | Americas |
| 7 | Democratic Republic of the Congo | 510 | Africa |
| 8 | United States | 488 | Americas |
| 9 | India | 472 | Asia |
| 10 | Ecuador | 467 | Americas |
Equal or near-equal totals should be interpreted within the limits of taxonomy and country-occurrence coding. The values are integer species counts from the selected MDD release.
Chart: Top 20 countries by living wild mammal species
The top twenty show a steep drop from the three largest totals to a broad second tier. Indonesia, Brazil and China sit above 700 species, while countries ranked fourth to tenth cluster between 467 and 585 species.
Methodology
Mammal species richness is calculated as the count of living wild mammal species recorded for a country in the selected Mammal Diversity Database release. The ranking is sorted from the highest to the lowest country total.
Formula
Mammal species richness = count of living wild mammal species recorded for the country.
Source release
The table uses ASM Mammal Diversity Database v2.4, released on January 2, 2026, as the 2026 taxonomic reference.
Included entities
The ranking keeps sovereign states only. Dependencies, territories and non-country units are excluded from the Top 100.
Rounding
Values are whole species counts, so no rounding is applied. Rankings use the integer value listed in the source country table.
The dataset is taxonomic rather than demographic. It does not estimate how many animals live in a country, how stable populations are, or whether habitats are protected. Domesticated species, widespread species treated outside the country-count table and recently extinct species are not counted as part of the living wild species total used for the ranking.
Comparability depends on accepted taxonomy, distribution coding and country boundaries. Species splits can raise totals, lumping can lower them, and range updates can move a species into or out of a country count. Marine mammals, bats and other wide-ranging species require particular care because their distributions often cross many borders and ecological zones.
Full ranking: 100 countries by mammal species richness
The table ranks 100 sovereign states by the number of living wild mammal species recorded in MDD v2.4. Use the search and filters to compare countries by region while keeping the original richness rank visible.
| Rank | Country | Mammal species | Region |
|---|---|---|---|
| 1 | Indonesia | 793 | Asia |
| 2 | Brazil | 785 | Americas |
| 3 | China | 746 | Asia |
| 4 | Mexico | 585 | Americas |
| 5 | Peru | 582 | Americas |
| 6 | Colombia | 532 | Americas |
| 7 | Democratic Republic of the Congo | 510 | Africa |
| 8 | United States | 488 | Americas |
| 9 | India | 472 | Asia |
| 10 | Ecuador | 467 | Americas |
| 11 | Bolivia | 419 | Americas |
| 12 | Venezuela | 415 | Americas |
| 13 | Argentina | 412 | Americas |
| 14 | Kenya | 410 | Africa |
| 15 | Tanzania | 407 | Africa |
| 16 | Cameroon | 370 | Africa |
| 17 | Uganda | 367 | Africa |
| 18 | Vietnam | 363 | Asia |
| 19 | Australia | 359 | Oceania |
| 20 | Myanmar | 359 | Asia |
| 21 | Malaysia | 358 | Asia |
| 22 | Thailand | 346 | Asia |
| 23 | Angola | 332 | Africa |
| 24 | Russia | 329 | Eurasia |
| 25 | South Africa | 322 | Africa |
| 26 | Ethiopia | 321 | Africa |
| 27 | Nigeria | 315 | Africa |
| 28 | Papua New Guinea | 292 | Oceania |
| 29 | Côte d’Ivoire | 278 | Africa |
| 30 | Ghana | 275 | Africa |
| 31 | Guinea | 266 | Africa |
| 32 | Mozambique | 264 | Africa |
| 33 | Central African Republic | 261 | Africa |
| 34 | Laos | 261 | Asia |
| 35 | Zambia | 261 | Africa |
| 36 | Costa Rica | 257 | Americas |
| 37 | Panama | 257 | Americas |
| 38 | Guyana | 255 | Americas |
| 39 | Guatemala | 250 | Americas |
| 40 | Madagascar | 246 | Africa |
| 41 | Philippines | 246 | Asia |
| 42 | South Sudan | 243 | Africa |
| 43 | Honduras | 236 | Americas |
| 44 | Republic of the Congo | 232 | Africa |
| 45 | Suriname | 230 | Americas |
| 46 | Canada | 224 | Americas |
| 47 | Iran | 218 | Asia |
| 48 | Nicaragua | 218 | Americas |
| 49 | Namibia | 215 | Africa |
| 50 | Rwanda | 211 | Africa |
| 51 | Zimbabwe | 211 | Africa |
| 52 | Liberia | 209 | Africa |
| 53 | Malawi | 208 | Africa |
| 54 | Equatorial Guinea | 205 | Africa |
| 55 | Cambodia | 204 | Asia |
| 56 | Pakistan | 204 | Asia |
| 57 | Benin | 203 | Africa |
| 58 | Gabon | 202 | Africa |
| 59 | Sierra Leone | 202 | Africa |
| 60 | Sudan | 201 | Africa |
| 61 | Togo | 201 | Africa |
| 62 | Nepal | 197 | Asia |
| 63 | Senegal | 194 | Africa |
| 64 | Somalia | 184 | Africa |
| 65 | Brunei | 183 | Asia |
| 66 | Paraguay | 181 | Americas |
| 67 | Turkey | 181 | Asia |
| 68 | Kazakhstan | 176 | Asia |
| 69 | Burundi | 175 | Africa |
| 70 | Botswana | 171 | Africa |
| 71 | El Salvador | 163 | Americas |
| 72 | Chile | 162 | Americas |
| 73 | Mali | 160 | Africa |
| 74 | Japan | 153 | Asia |
| 75 | Bangladesh | 152 | Asia |
| 76 | Chad | 151 | Africa |
| 77 | Mongolia | 148 | Asia |
| 78 | Guinea-Bissau | 143 | Africa |
| 79 | Bhutan | 142 | Asia |
| 80 | Burkina Faso | 140 | Africa |
| 81 | France | 139 | Europe |
| 82 | Eswatini | 138 | Africa |
| 83 | Afghanistan | 137 | Asia |
| 84 | Gambia | 136 | Africa |
| 85 | Niger | 136 | Africa |
| 86 | Morocco | 132 | Africa |
| 87 | Spain | 131 | Europe |
| 88 | Uruguay | 129 | Americas |
| 89 | Italy | 127 | Europe |
| 90 | Eritrea | 125 | Africa |
| 91 | Trinidad and Tobago | 125 | Americas |
| 92 | Sri Lanka | 121 | Asia |
| 93 | Mauritania | 118 | Africa |
| 94 | Greece | 116 | Europe |
| 95 | Israel | 116 | Asia |
| 96 | Egypt | 114 | Africa |
| 97 | Ukraine | 113 | Europe |
| 98 | Azerbaijan | 112 | Asia |
| 99 | Georgia | 112 | Asia |
| 100 | North Korea | 111 | Asia |
Source: ASM Mammal Diversity Database country table, version 2.4, released January 2, 2026. Regions are used only for navigation and do not affect the rank.
What the ranking shows
The upper tier is tropical and structurally complex
Indonesia, Brazil, China, Mexico, Peru and Colombia sit near the top because their territories include multiple habitat systems rather than one dominant landscape. Tropical forests, mountains, wetlands, islands and dry-to-wet transitions allow different mammal lineages to coexist within national borders.
Country size helps, but it does not explain everything
Russia and Canada are enormous, yet they rank below many tropical countries because cold and boreal systems support fewer mammal lineages. Ecuador, Costa Rica and Panama show the opposite pattern: smaller territories can rank high when ecological turnover is intense.
In the middle of the Top 100, African countries are especially visible. Kenya, Tanzania, Cameroon, Uganda, Angola, South Africa, Ethiopia and Nigeria combine savanna, forest, montane and dryland mammal assemblages. Their positions reflect both broad habitat variety and long-recognised faunal richness across sub-Saharan Africa.
The lower part of the Top 100 includes colder, drier or smaller countries where mammal diversity is still significant but less concentrated than in the tropical leaders. European countries enter the list mainly through broad continental faunas, Mediterranean diversity or overseas-influenced national boundaries, while many small island states fall outside the Top 100 because their native terrestrial mammal lists are narrower.
What mammal richness means for readers
For conservation policy, the ranking points to countries where land-use decisions can affect a large share of global mammal diversity. Forest conversion, road building, mining, hunting pressure and protected-area design matter everywhere, but the stakes are especially high where hundreds of species overlap.
For analysts and ESG teams, richness is a biodiversity exposure signal rather than a risk score. It should be compared with endemism, threatened-species counts, habitat loss, protected-area coverage and project-level ecological assessments before drawing conclusions about conservation urgency or business risk.
For students, educators and nature-focused travellers, the table helps explain why the Amazon, Andes, Congo Basin, Southeast Asian archipelagos and Mesoamerica are repeatedly described as global mammal-diversity centres. High richness does not guarantee easy wildlife observation, but it does identify places where mammal lineages are exceptionally concentrated.
FAQ
Which country has the highest mammal species richness in 2026?
Indonesia ranks first in the MDD v2.4 country table with 793 living wild mammal species. Its high total reflects a large tropical archipelago, island endemism, forest diversity and strong ecological turnover.
Does mammal species richness mean there are more individual animals?
No. Species richness counts how many species are recorded, not how many individual animals exist. A country can have many species but low or declining populations for some of them.
Is this the same as threatened mammal species?
No. Threatened mammal species are a conservation-status subset, usually based on IUCN Red List categories such as Vulnerable, Endangered and Critically Endangered. Mammal richness counts the total living wild mammal species recorded for a country in the selected MDD release.
Why do tropical countries rank so high?
Tropical regions usually combine long growing seasons, high habitat complexity, older stable ecosystems and strong vertical or geographic turnover. Mountains, rainforests, river basins and islands create many ecological niches, which supports higher species counts.
Why can taxonomy change the ranking?
Taxonomic revisions can split one species into several species or combine several formerly recognised species into one. Because the ranking counts accepted species, these changes can alter country totals even if no animals have physically moved.
Are marine mammals included?
Marine mammals can be included where the source assigns species to a country’s geographic coding. This is one reason country comparisons should be read as a database release rather than a simple count of land mammals inside political borders.
Are territories included?
The main ranking uses sovereign states only. Territories and dependencies can have their own biodiversity profiles, but mixing them with countries would make the table less comparable.
Does a high ranking mean better conservation?
No. A high ranking means high species richness. Conservation performance requires other evidence, including population trends, habitat protection, law enforcement, threatened-species status and the pace of land-use change.
Sources
-
American Society of Mammalogists — Mammal Diversity Database
Primary source for the mammal taxonomy reference and the v2.4 release information. -
Mammal Diversity Database — Country Mammal Diversity
Source table used for country-level counts of orders, families, genera, living species and extinct species. -
Mammal Diversity Database v2.4 — Zenodo dataset
Dataset citation for the January 2026 release used as the taxonomic reference. -
IUCN Red List of Threatened Species
Conservation-status context used to distinguish species richness from extinction-risk categories. -
IUCN Red List — Species richness and rarity-weighted richness resources
Methodological context for interpreting species-richness mapping and biodiversity concentration.
Related rankings
More StatRanker rankings on climate, environment, resources and sustainability.
Top 100 Countries by Bird Species Richness, 2026
Open rankingTop 100 Countries by Threatened Plant Species, 2025
Open rankingTop 100 Countries by Bird Species Diversity, 2025
Open rankingTop 100 Countries by Threatened Mammals and Birds
Open ranking
StatRanker (Website)
administrator
