

US States by Gasoline Prices, 2026 Snapshot
U.S. State Gasoline Prices in the AAA Daily Snapshot
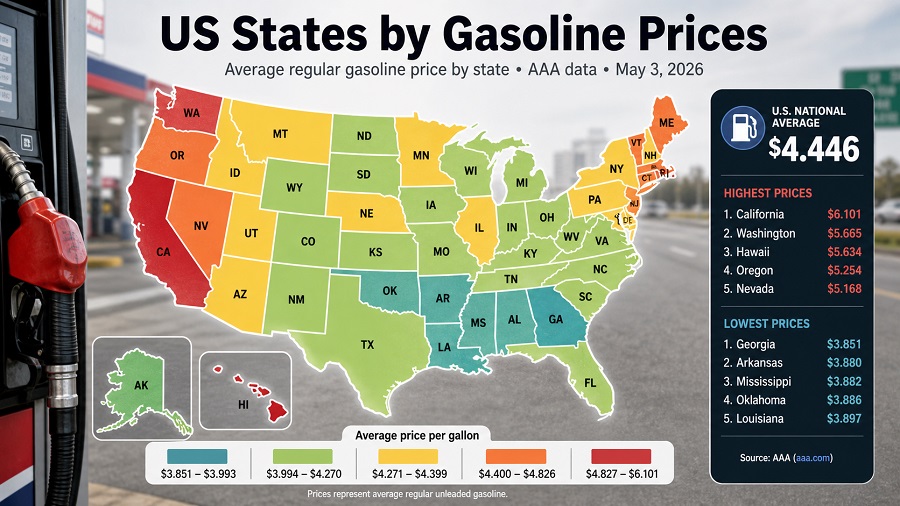
Information updated: May 3, 2026
This ranking compares the average retail price of regular gasoline across the 50 U.S. states, measured in U.S. dollars per gallon. The data are a daily price snapshot, not a calendar-year average: the figures below use AAA state averages for May 3, 2026, when the AAA national average for regular gasoline stood at $4.446 per gallon.
Gasoline prices move quickly because crude oil costs, refinery outages, fuel specifications, taxes, distribution distance and local retail competition all affect the final pump price. This page shows where drivers were paying the most and least at a specific point in time, rather than presenting a full-year average.
California had the highest regular gasoline average in the 50-state ranking.
Georgia had the lowest regular gasoline average among states in this snapshot.
The gap between the highest and lowest state was more than two dollars per gallon.
Unit: U.S. dollars per gallon. Data type: actual daily retail price snapshot.
Overview: where gasoline prices are highest and lowest
The expensive end is concentrated on the West Coast and in remote supply markets. California, Washington, Hawaii, Oregon, Nevada and Alaska all exceeded $5.00 per gallon. This pattern reflects a mix of taxes and fees, fuel specifications, refinery and pipeline geography, imported supply exposure and higher distribution costs.
The lower-price group is clustered in the South and parts of the central United States. Georgia, Arkansas, Mississippi, Oklahoma, Louisiana and Texas were all below $3.92 per gallon. Proximity to Gulf Coast refining capacity and different state tax structures help explain why many southern states sit near the bottom of the price table.
The most useful way to read the ranking is as a daily consumer-price benchmark. A high gasoline price can reflect state tax policy, cleaner-fuel requirements, supply constraints or distance from refineries. A lower price can reflect easier access to wholesale fuel, lower tax burdens or a more competitive local retail market. The ranking captures the pump price visible to consumers, while the causes sit deeper in each state’s fuel, tax and distribution system.
Top 20 states by regular gasoline price
| Rank | State | Regular gasoline | Reading |
|---|---|---|---|
| 1 | California | $6.101/gal | Very high |
| 2 | Washington | $5.665/gal | Very high |
| 3 | Hawaii | $5.634/gal | Very high |
| 4 | Oregon | $5.254/gal | Very high |
| 5 | Nevada | $5.168/gal | Very high |
| 6 | Alaska | $5.037/gal | Very high |
| 7 | Illinois | $4.933/gal | High |
| 8 | Ohio | $4.885/gal | High |
| 9 | Michigan | $4.868/gal | High |
| 10 | Indiana | $4.827/gal | High |
| 11 | Arizona | $4.740/gal | High |
| 12 | Pennsylvania | $4.520/gal | Above national average |
| 13 | Connecticut | $4.518/gal | High |
| 14 | Idaho | $4.455/gal | Above average |
| 15 | New York | $4.453/gal | Above average |
| 16 | Colorado | $4.438/gal | Above average |
| 17 | New Jersey | $4.417/gal | Above average |
| 18 | Vermont | $4.416/gal | Above average |
| 19 | Maine | $4.400/gal | Above average |
| 20 | Utah | $4.390/gal | Above average |
Table shows the 20 highest regular gasoline averages among U.S. states in the AAA daily snapshot for May 3, 2026. Values are actual retail price averages in U.S. dollars per gallon and are rounded to three decimals as published.
Highest regular gasoline prices by state
The chart shows the top 10 states. The gap between California and the rest of the table matters because every additional dollar per gallon quickly compounds for commuters, delivery operators, small contractors and households that cannot easily reduce driving.
Values shown: Top 10 states by regular gasoline price
The chart and value list use the same Top 10 gasoline prices from the AAA daily state averages.
Methodology
The indicator is the average retail price of regular gasoline, expressed in U.S. dollars per gallon. The ranking uses AAA state average prices for May 3, 2026. These are treated as an actual daily market snapshot because gasoline prices are volatile and can change materially within days.
The ranking includes the 50 U.S. states only. The District of Columbia appears in the AAA source but is excluded from the state ranking to keep the coverage consistent with the title. States are sorted from highest to lowest regular gasoline price. Values are kept to three decimals, matching the precision in the AAA table. Price tiers are descriptive labels for this page, not official AAA categories.
Interpretation uses EIA background on gasoline pricing. EIA identifies crude oil costs, refining costs and profits, distribution and marketing, and taxes as the main components of retail gasoline prices. EIA also notes that regional price differences can reflect taxes, distance from supply, supply disruptions, retail competition and operating costs.
Main limitation: a daily price snapshot is useful for current consumer context but should not be used as a substitute for annual averages, inflation-adjusted fuel affordability, fuel tax rankings or household transportation-cost analysis. A state can move several positions if crude prices, refinery conditions or regional supply constraints change.
Full 50-state ranking by regular gasoline price
| Rank | State | Regular gasoline | Price tier |
|---|---|---|---|
| 1 | California | $6.101/gal | Very high |
| 2 | Washington | $5.665/gal | Very high |
| 3 | Hawaii | $5.634/gal | Very high |
| 4 | Oregon | $5.254/gal | Very high |
| 5 | Nevada | $5.168/gal | Very high |
| 6 | Alaska | $5.037/gal | Very high |
| 7 | Illinois | $4.933/gal | High |
| 8 | Ohio | $4.885/gal | High |
| 9 | Michigan | $4.868/gal | High |
| 10 | Indiana | $4.827/gal | High |
| 11 | Arizona | $4.740/gal | High |
| 12 | Pennsylvania | $4.520/gal | High |
| 13 | Connecticut | $4.518/gal | High |
| 14 | Idaho | $4.455/gal | Above average |
| 15 | New York | $4.453/gal | Above average |
| 16 | Colorado | $4.438/gal | Above average |
| 17 | New Jersey | $4.417/gal | Above average |
| 18 | Vermont | $4.416/gal | Above average |
| 19 | Maine | $4.400/gal | Above average |
| 20 | Utah | $4.390/gal | Above average |
| 21 | Rhode Island | $4.378/gal | Above average |
| 22 | Wisconsin | $4.371/gal | Above average |
| 23 | New Hampshire | $4.343/gal | Mid-range |
| 24 | Florida | $4.342/gal | Mid-range |
| 25 | Massachusetts | $4.339/gal | Mid-range |
| 26 | Montana | $4.323/gal | Mid-range |
| 27 | West Virginia | $4.301/gal | Mid-range |
| 28 | Wyoming | $4.297/gal | Mid-range |
| 29 | Maryland | $4.271/gal | Mid-range |
| 30 | Kentucky | $4.218/gal | Mid-range |
| 31 | Delaware | $4.206/gal | Mid-range |
| 32 | Virginia | $4.173/gal | Mid-range |
| 33 | New Mexico | $4.162/gal | Mid-range |
| 34 | North Carolina | $4.078/gal | Lower-mid |
| 35 | South Dakota | $4.064/gal | Lower-mid |
| 36 | Minnesota | $4.051/gal | Lower-mid |
| 37 | South Carolina | $4.002/gal | Lower-mid |
| 38 | North Dakota | $3.994/gal | Lower-price group |
| 39 | Tennessee | $3.994/gal | Lower-price group |
| 40 | Missouri | $3.972/gal | Lower-price group |
| 41 | Nebraska | $3.962/gal | Lower-price group |
| 42 | Alabama | $3.960/gal | Lower-price group |
| 43 | Kansas | $3.957/gal | Lower-price group |
| 44 | Iowa | $3.950/gal | Lower-price group |
| 45 | Texas | $3.916/gal | Lower-price group |
| 46 | Louisiana | $3.897/gal | Lower-price group |
| 47 | Oklahoma | $3.886/gal | Lower-price group |
| 48 | Mississippi | $3.882/gal | Lower-price group |
| 49 | Arkansas | $3.880/gal | Lower-price group |
| 50 | Georgia | $3.851/gal | Lowest state |
Source: AAA State Gas Price Averages, regular gasoline, price as of May 3, 2026. Coverage: 50 U.S. states; District of Columbia excluded from the state ranking. Unit: U.S. dollars per gallon. Data type: actual daily retail price snapshot.
Insights from the gasoline price ranking
- West Coast pricing is structurally different. California, Washington and Oregon are all in the top four. Their prices are shaped by regional refining constraints, fuel standards, taxes and limited ability to draw low-cost supply from the Gulf Coast when markets tighten.
- Remote markets carry a logistics premium. Hawaii and Alaska are expensive for different reasons, but both show how distance, transportation and supply-chain complexity can push pump prices well above the continental average.
- Midwest prices can change quickly during supply stress. Ohio, Michigan and Indiana appear high in this snapshot. That does not mean they are always among the most expensive states; it shows how regional refinery or wholesale-market conditions can temporarily change the ranking.
- The South remains the lowest-price cluster. Georgia, Arkansas, Mississippi, Oklahoma, Louisiana and Texas sit at the bottom of the table. Gulf Coast refining capacity, pipeline access and lower tax structures help keep many southern states below the national average.
- The spread is economically meaningful. A $2.250 gap between California and Georgia means a 15-gallon fill-up would cost about $33.75 more in the highest-price state than in the lowest-price state at this snapshot’s prices.
What the ranking means for readers
For households, the ranking helps translate national fuel-price news into local reality. A national average can hide a very different experience for a commuter in California, a rural driver in Georgia or a small business operating vans across several states.
For travelers, the table is useful for route planning. Crossing from a high-price state into a lower-price neighbor can change trip costs, especially for RVs, trucks or long-distance family travel. For delivery firms and contractors, the ranking signals where fuel surcharges, route design and job pricing may need closer attention.
For policy readers, the ranking is a reminder that gasoline affordability is not only an oil-market issue. State tax design, environmental fuel requirements, refinery concentration, storage capacity and distribution infrastructure all influence what consumers pay.
FAQ
Is this a 2026 annual ranking of gasoline prices?
No. It is a 2026 daily snapshot using AAA state averages for May 3, 2026. Gasoline prices change quickly, so annual averages would require a separate dataset covering the full year.
Why is California so much higher than most states?
California’s pump prices are influenced by state taxes and fees, cleaner-fuel requirements, refinery market structure, supply constraints and West Coast logistics.
Why are many southern states cheaper?
Many southern states benefit from proximity to Gulf Coast refining and pipeline infrastructure, different tax structures and competitive retail markets.
Does a higher gasoline price mean a state has worse energy policy?
Not by itself. A high price can reflect taxes used for transportation funding, environmental fuel standards, limited supply routes, higher operating costs or temporary disruptions.
Why does this page use regular gasoline only?
Regular gasoline is the most widely used benchmark for consumer pump prices and is the standard headline measure in AAA and EIA gasoline reporting.
Why can my local station price differ from the state average?
A state average combines many stations and markets. A single station may be higher or lower because of brand, neighborhood competition, highway location, local taxes, wholesale contracts or timing.
Sources
- AAA Gas Prices — State Gas Price AveragesPrimary source for the state-level regular gasoline prices used in the ranking. Snapshot date: May 3, 2026.
https://gasprices.aaa.com/state-gas-price-averages/ - AAA Gas Prices — Today’s State AveragesDaily state price table and national regular gasoline average.
https://gasprices.aaa.com/todays-state-averages/ - U.S. Energy Information Administration — Factors affecting gasoline pricesExplains crude oil, refining, distribution, marketing and taxes as components of the pump price.
https://www.eia.gov/energyexplained/gasoline/factors-affecting-gasoline-prices.php - U.S. Energy Information Administration — Regional gasoline price differencesExplains regional price gaps, including taxes, distance from supply, disruptions, competition and operating costs.
https://www.eia.gov/energyexplained/gasoline/regional-price-differences.php - U.S. Energy Information Administration — Weekly Retail Gasoline Price Estimates methodologyBackground on how weekly retail gasoline price surveys define pump prices and gasoline grades.
https://www.eia.gov/petroleum/gasdiesel/gas_proc-methods.php
Information updated: May 3, 2026. The table is a daily market snapshot based on AAA state averages.
StatRanker (Website)
administrator
