


Top 100 Countries by Freshwater Resources per Capita, 2026 Edition
Freshwater Resources per Person in the Latest Global Country Ranking
The ranking compares countries by total renewable freshwater resources per person, measured in cubic metres per inhabitant per year. The indicator connects long-term river, lake, groundwater and cross-border inflow potential with population size.
Thank you for reading this post, don't forget to subscribe!The year in the title is an edition year, not a claim that national water flows were measured in 2026. FAO AQUASTAT renewable water-resource variables are long-term annual averages, so the ranking is best used for structural comparison rather than for current drought conditions, reservoir levels, rainfall anomalies, household tap-water access or drinking-water quality.
Data type: latest comparable snapshot / 2026 edition. Metric: total renewable freshwater resources per capita. Unit: m³/person/year. Coverage: 100 sovereign countries. Important limit: high renewable resources per person do not automatically mean reliable, affordable or safe water access.
Key facts about the freshwater resources ranking
What the freshwater resources per capita ranking shows
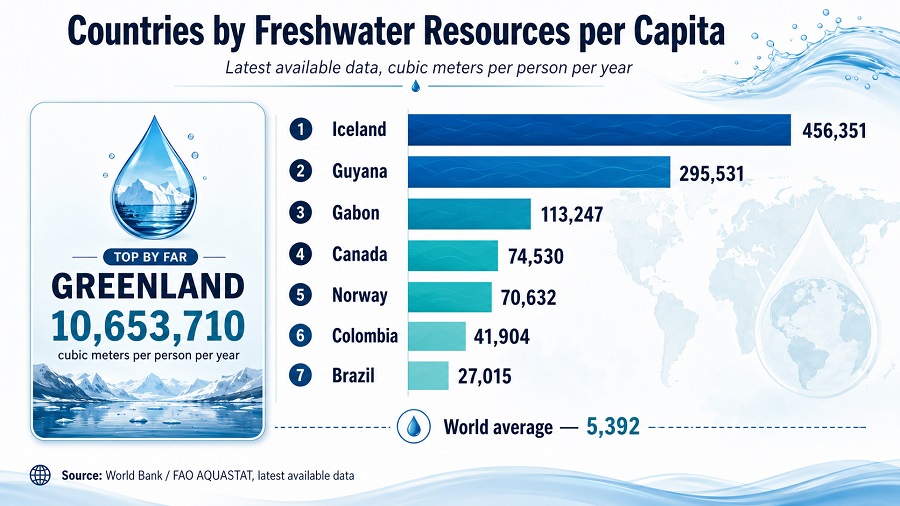
Freshwater resources per capita combines geography with demography. Countries with large river systems, high rainfall, major lakes, glaciers, groundwater recharge or important transboundary inflows can rank high when those resources are divided by a relatively small population. This explains the strong positions of Iceland, Guyana, Suriname and the Republic of the Congo.
The metric is not a direct measure of water security. It does not show whether water is close to farms and cities, whether it is clean, whether it can be stored, or whether utilities can deliver it reliably. A high-ranking country may still face floods, seasonal shortages, pollution, poor infrastructure or regional imbalance. A lower-ranking country may still provide strong water services through storage, reuse, leakage control, treatment and efficient allocation.
The most precise interpretation is country-level renewable freshwater endowment per person. It is useful for comparing long-term natural water-resource pressure, but it should not be used as a shortcut for judging drinking-water access or overall resilience.
Top 20 countries by freshwater resources per capita
The Top 20 is concentrated in the North Atlantic, northern South America, the Congo Basin, the Pacific and several low-density countries with large renewable flow systems. The gaps are wide: Iceland’s per-capita value is several times higher than most countries in the Top 20, while the lower end of the group remains far above many densely populated or arid economies.
| Rank | Country | m³/person/year | Region |
|---|---|---|---|
| 1 | Iceland | 498,179 | Europe |
| 2 | Guyana | 344,542 | South America |
| 3 | Suriname | 168,760 | South America |
| 4 | Republic of the Congo | 150,777 | Africa |
| 5 | Bhutan | 101,088 | Asia |
| 6 | Papua New Guinea | 89,527 | Oceania |
| 7 | Gabon | 74,582 | Africa |
| 8 | Canada | 73,469 | North America |
| 9 | Norway | 72,493 | Europe |
| 10 | New Zealand | 67,811 | Oceania |
| 11 | Solomon Islands | 65,076 | Oceania |
| 12 | Peru | 57,012 | South America |
| 13 | Belize | 54,659 | North America |
| 14 | Paraguay | 54,366 | South America |
| 15 | Uruguay | 49,572 | South America |
| 16 | Bolivia | 49,173 | South America |
| 17 | Chile | 48,287 | South America |
| 18 | Venezuela | 46,596 | South America |
| 19 | Colombia | 46,381 | South America |
| 20 | Liberia | 45,871 | Africa |
Top 20 values are rounded to the nearest cubic metre per person per year. The ranking uses total renewable freshwater resources, not drinking-water access, water quality or fully exploitable supply.
Chart: freshwater resources per person for the Top 20 countries
The chart highlights the steep drop from the top two countries to the rest of the leading group. Per-capita water-resource rankings are therefore best read as a distribution, not as a simple label of abundance or scarcity.
Highest-ranked countries in this edition: Iceland, Guyana, Suriname, the Republic of the Congo and Bhutan.
Methodology: how the freshwater resources per capita ranking was calculated
The ranking uses total renewable freshwater resources per capita, expressed in cubic metres per person per year. Total renewable freshwater resources include internally generated renewable flows and relevant external inflows where they are part of the country’s renewable water-resource balance.
The 2026 label is an edition year. FAO AQUASTAT treats renewable water-resource variables as long-term annual averages, typically based on historical hydrological reference periods. The indicator is therefore suitable for structural comparison between countries, but it does not measure current drought, reservoir levels, monthly rainfall or short-term climate anomalies.
Countries were sorted from highest to lowest m³/person/year. Aggregate regions, income groups and non-country groupings were excluded. Values were rounded to the nearest cubic metre per person per year for readability. Standard English country names are used where official dataset labels differ from common reader-facing names.
The main limitation is that renewable freshwater resources are not the same as fully exploitable water. Some flows are difficult to capture, environmentally reserved, seasonal, geographically distant from demand centres or exposed to flood and drought variability. The ranking should be read together with water withdrawals, water stress, infrastructure quality, water governance, access to safely managed drinking water and climate-risk indicators.
Full Top 100 countries by freshwater resources per capita
The table ranks countries by total renewable freshwater resources per person. The figures are long-term resource indicators, so they are most useful for comparing structural freshwater endowment rather than short-term water availability.
| Rank | Country | m³/person/year | Region |
|---|---|---|---|
| 1 | Iceland | 498,179 | Europe |
| 2 | Guyana | 344,542 | South America |
| 3 | Suriname | 168,760 | South America |
| 4 | Republic of the Congo | 150,777 | Africa |
| 5 | Bhutan | 101,088 | Asia |
| 6 | Papua New Guinea | 89,527 | Oceania |
| 7 | Gabon | 74,582 | Africa |
| 8 | Canada | 73,469 | North America |
| 9 | Norway | 72,493 | Europe |
| 10 | New Zealand | 67,811 | Oceania |
| 11 | Solomon Islands | 65,076 | Oceania |
| 12 | Peru | 57,012 | South America |
| 13 | Belize | 54,659 | North America |
| 14 | Paraguay | 54,366 | South America |
| 15 | Uruguay | 49,572 | South America |
| 16 | Bolivia | 49,173 | South America |
| 17 | Chile | 48,287 | South America |
| 18 | Venezuela | 46,596 | South America |
| 19 | Colombia | 46,381 | South America |
| 20 | Liberia | 45,871 | Africa |
| 21 | Laos | 45,838 | Asia |
| 22 | Brazil | 40,680 | South America |
| 23 | Vanuatu | 32,558 | Oceania |
| 24 | Panama | 32,285 | North America |
| 25 | Fiji | 31,848 | Oceania |
| 26 | Russia | 31,010 | Europe/Asia |
| 27 | Central African Republic | 29,194 | Africa |
| 28 | Cameroon | 28,477 | Africa |
| 29 | Croatia | 25,699 | Europe |
| 30 | Ecuador | 25,075 | South America |
| 31 | Nicaragua | 24,835 | North America |
| 32 | Costa Rica | 22,182 | North America |
| 33 | Myanmar | 21,463 | Asia |
| 34 | Sierra Leone | 20,058 | Africa |
| 35 | Finland | 19,853 | Europe |
| 36 | Brunei | 19,430 | Asia |
| 37 | Argentina | 19,388 | South America |
| 38 | Australia | 19,294 | Oceania |
| 39 | Serbia | 18,564 | Europe |
| 40 | Equatorial Guinea | 18,532 | Africa |
| 41 | Latvia | 18,524 | Europe |
| 42 | Malaysia | 17,920 | Asia |
| 43 | Sweden | 17,229 | Europe |
| 44 | Guinea | 17,209 | Africa |
| 45 | Guinea-Bissau | 15,955 | Africa |
| 46 | Georgia | 15,875 | Europe/Asia |
| 47 | Namibia | 15,707 | Africa |
| 48 | Slovenia | 15,330 | Europe |
| 49 | Democratic Republic of the Congo | 14,325 | Africa |
| 50 | Madagascar | 12,170 | Africa |
| 51 | Bosnia and Herzegovina | 11,430 | Europe |
| 52 | Romania | 11,021 | Europe |
| 53 | Hungary | 10,766 | Europe |
| 54 | Mongolia | 10,615 | Asia |
| 55 | Ireland | 10,531 | Europe |
| 56 | Albania | 10,494 | Europe |
| 57 | Sao Tome and Principe | 9,947 | Africa |
| 58 | Estonia | 9,654 | Europe |
| 59 | Honduras | 9,305 | North America |
| 60 | United States | 9,272 | North America |
| 61 | Slovakia | 9,176 | Europe |
| 62 | Vietnam | 9,083 | Asia |
| 63 | Lithuania | 9,000 | Europe |
| 64 | Austria | 8,627 | Europe |
| 65 | Portugal | 7,591 | Europe |
| 66 | Bangladesh | 7,451 | Asia |
| 67 | Indonesia | 7,380 | Asia |
| 68 | Nepal | 7,214 | Asia |
| 69 | Guatemala | 7,140 | North America |
| 70 | Mozambique | 6,946 | Africa |
| 71 | Greece | 6,562 | Europe |
| 72 | Thailand | 6,284 | Asia |
| 73 | Timor-Leste | 6,231 | Asia |
| 74 | Switzerland | 6,182 | Europe |
| 75 | Belarus | 6,127 | Europe |
| 76 | Mali | 5,926 | Africa |
| 77 | Kazakhstan | 5,774 | Asia |
| 78 | South Africa | 5,701 | Africa |
| 79 | Luxembourg | 5,591 | Europe |
| 80 | Netherlands | 5,311 | Europe |
| 81 | Botswana | 5,205 | Africa |
| 82 | Angola | 4,515 | Africa |
| 83 | South Sudan | 4,422 | Africa |
| 84 | Philippines | 4,371 | Asia |
| 85 | Turkey | 4,106 | Europe/Asia |
| 86 | Andorra | 4,085 | Europe |
| 87 | El Salvador | 4,050 | North America |
| 88 | Ukraine | 4,008 | Europe |
| 89 | Eswatini | 3,887 | Africa |
| 90 | Jamaica | 3,655 | North America |
| 91 | Kyrgyzstan | 3,620 | Asia |
| 92 | Mexico | 3,582 | North America |
| 93 | Azerbaijan | 3,420 | Asia |
| 94 | Japan | 3,400 | Asia |
| 95 | Cuba | 3,366 | North America |
| 96 | Gambia | 3,310 | Africa |
| 97 | France | 3,233 | Europe |
| 98 | Ivory Coast | 3,190 | Africa |
| 99 | Italy | 3,164 | Europe |
| 100 | North Macedonia | 3,072 | Europe |
Values show total renewable freshwater resources per person in m³/year. This is a 2026 edition based on the latest comparable international water-resource snapshot available for the indicator. Renewable water-resource statistics are long-term annual averages and should not be interpreted as actual 2026 flows, drinking-water access, water quality or fully exploitable supply.
Insights from the Top 100 freshwater resources ranking
- Population size strongly affects the result. Countries with moderate or large water systems can rank very high when their populations are small, while highly populated countries can rank lower even if their absolute freshwater volume is substantial.
- South America has a strong upper-tier presence. Guyana, Suriname, Peru, Paraguay, Uruguay, Bolivia, Chile, Venezuela, Colombia and Brazil all appear high because the continent combines major river basins with large renewable flows.
- Water-rich does not mean water-secure. Renewable freshwater may be seasonal, remote, polluted, hard to store, environmentally protected or unevenly distributed across a country.
- Transboundary water adds political and hydrological complexity. Countries can depend on rivers, lakes or groundwater systems shared with neighbours, so treaties, upstream withdrawals and climate variability can influence practical availability.
- The lower part of the Top 100 still includes countries with meaningful resources. A position near rank 100 does not necessarily indicate severe scarcity; it means the per-capita renewable resource value is lower than in the highest-ranked countries.
What this ranking means for readers, investors and policymakers
Freshwater resources per capita is a useful first signal of long-term water-resource pressure. For policymakers, a lower value can point to the need for stronger demand management, irrigation efficiency, water reuse, desalination, leakage reduction, drought planning and cross-border water diplomacy. For businesses, it helps frame exposure to agricultural, industrial and infrastructure risks.
For readers, the ranking helps separate natural endowment from service delivery. A country may have abundant renewable flows but still need major investment in pipes, treatment plants, storage, monitoring and watershed protection. Conversely, countries with limited natural freshwater can perform well if governance, infrastructure, pricing and technology are strong.
The indicator should be read alongside water stress, withdrawals by sector, access to safely managed drinking water, climate risk, reservoir storage and local water quality. Used this way, it becomes a practical tool for understanding resilience rather than a shortcut for judging overall water security.
FAQ: freshwater resources per capita
What does freshwater resources per capita mean?
It is the volume of total renewable freshwater resources divided by population. The result is shown in cubic metres per person per year and is useful for comparing long-term water-resource endowment across countries.
Is this the same as access to safe drinking water?
No. Drinking-water access depends on treatment, distribution networks, affordability, service reliability and water quality. A country can have high renewable resources and still have local communities without reliable safe water.
Why can a country with abundant freshwater still face shortages?
Shortages can occur when water is seasonal, far from demand centres, poorly stored, polluted, overused, affected by drought or difficult to manage across regions and borders.
Why is the ranking called a 2026 edition?
The year refers to the publication edition, not to measured 2026 water flows. Renewable water-resource data are long-term annual averages, so the ranking should be read as the latest comparable snapshot available for this edition.
What is the difference between total and internal renewable freshwater resources?
Internal renewable resources are generated within a country. Total renewable resources also include relevant external inflows, such as shared rivers or upstream flows, according to the water-resource balance used for the country.
Why do small countries often rank high?
The metric divides water resources by population. A country with large renewable flows and a small population can have an extremely high per-capita value even if its total water volume is not the largest in absolute terms.
Sources
- FAO AQUASTAT — Water resources methodology. Used for definitions, comparability rules, transboundary-flow treatment and the key limitation that renewable water-resource statistics are long-term annual averages. https://www.fao.org/aquastat/en/overview/methodology/water-resources/index.html
- FAO AQUASTAT Dissemination System. Used as the official FAO data environment for country water-resource variables and country water-resource profiles. https://data.apps.fao.org/aquastat/?lang=en
- World Bank Data — Renewable internal freshwater resources per capita. Used only as a terminology and cross-check source for internal freshwater-resource context, not as the primary source for total renewable freshwater resources per capita. https://data.worldbank.org/indicator/ER.H2O.INTR.PC
StatRanker (Website)
administrator
