

US States by Health Insurance Coverage, 2026
Health Insurance Coverage Rankings by State
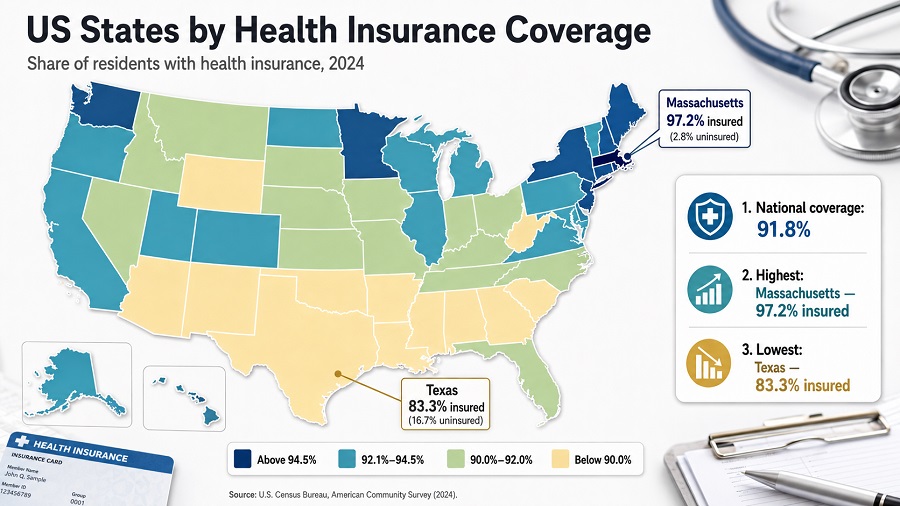
This comprehensive ranking compares health insurance coverage across all 50 states and DC using the latest 2024 Census Bureau data (American Community Survey). Massachusetts leads with 97.2% coverage, while Texas has the lowest rate at 80.8%—a significant 16.4 percentage point gap. States that expanded Medicaid show notably higher coverage rates (averaging 93.8%) compared to non-expansion states (averaging 85.8%). Use this data to understand state health insurance landscapes, policy impacts, and coverage disparities.
Coverage matters because it is closely tied to access to care, protection from unexpected medical costs, Medicaid and marketplace policy design, labor-market benefits, and household financial stability. The ranking is ordered from the highest coverage rate to the lowest coverage rate. District of Columbia is included, so the table contains 51 rows rather than only 50 states.
Summary cards
Overview of the upper part of the ranking
The top of the health insurance coverage ranking is dominated by Northeastern states and a few high-performing jurisdictions outside the region. Massachusetts leads the table, followed by Hawaii and Vermont. District of Columbia and New Hampshire form the next tier, both with uninsured rates of 4.5% and implied coverage rates of 95.5%.
The upper group is not simply a list of wealthy states. Policy architecture matters: states with long-standing Medicaid expansion, strong marketplace participation, employer coverage depth, or state-specific coverage rules tend to appear higher. The lower end of the ranking is concentrated in the South and parts of the West, with Texas, Georgia, Oklahoma, Nevada, Alaska and Florida showing the largest uninsured shares.
The central pattern is regional and policy-driven: all Northeastern states are below the national uninsured average, while many states above the national uninsured average are in the South or West.
Key Takeaways: Health Insurance Coverage by State
- Highest coverage: Massachusetts leads with 97.2% coverage (2.8% uninsured)
- Lowest coverage: Texas has the lowest rate at 80.8% coverage (19.2% uninsured)
- Medicaid expansion impact: States with Medicaid expansion average 93.8% coverage vs. non-expansion states at 85.8%—an 8.0 percentage point difference
- National average: 91.8% of Americans have health insurance (8.2% uninsured)
- Coverage gap: 16.4 percentage point difference between highest (Massachusetts) and lowest (Texas)
- Regional pattern: Northeast states lead (95%+ coverage), Southern states lag (88% average)
Top 10 states and jurisdictions by health insurance coverage
The Top 10 table ranks jurisdictions by the highest implied coverage rate. Coverage is calculated as 100 minus the 2024 uninsured rate.
| Rank | State or jurisdiction | Coverage rate | Uninsured rate |
|---|---|---|---|
| 1 | MassachusettsNortheast · Medicaid expanded | 97.2% | 2.8% |
| 2 | HawaiiWest · Medicaid expanded | 96.5% | 3.5% |
| 3 | VermontNortheast · Medicaid expanded | 95.8% | 4.2% |
| 4 | District of ColumbiaSouth · Medicaid expanded | 95.5% | 4.5% |
| 5 | New HampshireNortheast · Medicaid expanded | 95.5% | 4.5% |
| 6 | Rhode IslandNortheast · Medicaid expanded | 95.4% | 4.6% |
| 7 | New YorkNortheast · Medicaid expanded | 95.0% | 5.0% |
| 8 | MichiganMidwest · Medicaid expanded | 94.9% | 5.1% |
| 9 | MinnesotaMidwest · Medicaid expanded | 94.9% | 5.1% |
| 10 | OregonWest · Medicaid expanded | 94.8% | 5.2% |
Latest available data / snapshot: U.S. Census Bureau ACS 2024 1-year estimates. Values are percentages of the civilian noninstitutionalized population.
Chart: Top 20 coverage rates
The chart below shows the Top 20 jurisdictions by implied health insurance coverage rate. Because these are high-coverage states, the chart should be read as a comparison inside a narrow range rather than as a full 0–100 scale distribution.
Methodology
The ranking uses the U.S. Census Bureau's 2024 American Community Survey 1-year estimates. The Census table reports the percentage of people without health insurance coverage among the civilian noninstitutionalized population. To make the ranking intuitive for readers, the coverage rate is calculated as 100 minus the uninsured rate. A state with an uninsured rate of 2.8% therefore has an implied coverage rate of 97.2%.
The year shown in the title is 2026 because this is a 2026 editorial page. The data year is 2024 because, as of this snapshot, the 2024 ACS 1-year release is the latest comparable state-level Census source available. The values are survey estimates, not administrative enrollment counts and not a 2026 forecast. They reflect current comprehensive coverage reported at the time of interview across the ACS collection year.
Coverage includes comprehensive private plans, employer or union plans, direct-purchase plans, exchange coverage, TRICARE, Medicare, Medicaid, CHIP, state health plans, CHAMPVA and VA care. People are treated as uninsured if they had no comprehensive coverage or only Indian Health Service coverage. Changes from 2023 are shown as percentage-point changes in the uninsured rate; positive values mean the uninsured rate increased, while negative values mean it fell.
Rows are sorted by highest coverage rate. Ties are ordered alphabetically. Values are rounded to one decimal place, following the public table. Because ACS estimates are sample-based, small differences between states should be interpreted with caution. Margins of error and formal significance tests are important for research use, especially when differences are narrow.
Data limitations and sampling notes
Important: ACS data are based on probability sampling, not complete enumeration. Each state-level estimate has an associated margin of error (MOE), typically ±0.3 to ±1.5 percentage points for coverage rates depending on state population size.
Margin of error interpretation: A state showing 91.8% coverage with a ±0.8 percentage point MOE means the true coverage rate likely falls between 91.0% and 92.6% (95% confidence level). Two states with point estimates differing by 0.5 percentage points may not actually differ when accounting for sampling variability.
What this ranking does not capture:
- Undercount in ACS: The American Community Survey may undercount certain populations (e.g., recent immigrants, people with unstable housing), which could affect relative rankings.
- Timing of coverage: ACS captures coverage status at interview time. People may gain or lose coverage during the year, so annual point estimates don't reflect coverage stability over time.
- Quality or affordability: High coverage does not mean low out-of-pocket costs, low deductibles, or access to care. A state can have high coverage rates but high unmet need or high medical debt.
- Population subgroups: This ranking shows overall coverage for each state, not breakdowns by age, race, ethnicity, income, or citizenship status. These subgroups often have very different coverage rates.
- Medicaid continuous coverage policy effects: The 2024 ACS captures the period after the end of the pandemic-era continuous Medicaid enrollment freeze (March 2023). Some uninsured rate increases reflect Medicaid redeterminations, not purely voluntary drops in coverage.
For formal research: Consult the Census Bureau's "Accuracy of the Data" technical documentation for full margin of error tables and design effects.
Main HTML table: US states by health insurance coverage
All 51 rows are written directly in the HTML. The controls only search, filter, hide or sort existing rows; they do not generate rows and do not fetch data.
| Rank | State or jurisdiction | Coverage rate | Uninsured rate and change |
|---|---|---|---|
| 1 | MassachusettsNortheast · Medicaid expanded | 97.2% | 2.8%+0.2 pp |
| 2 | HawaiiWest · Medicaid expanded | 96.5% | 3.5%+0.2 pp |
| 3 | VermontNortheast · Medicaid expanded | 95.8% | 4.2%+0.8 pp |
| 4 | District of ColumbiaSouth · Medicaid expanded | 95.5% | 4.5%+1.8 pp |
| 5 | New HampshireNortheast · Medicaid expanded | 95.5% | 4.5%−0.3 pp |
| 6 | Rhode IslandNortheast · Medicaid expanded | 95.4% | 4.6%+0.1 pp |
| 7 | New YorkNortheast · Medicaid expanded | 95.0% | 5.0%+0.1 pp |
| 8 | MichiganMidwest · Medicaid expanded | 94.9% | 5.1%+0.5 pp |
| 9 | MinnesotaMidwest · Medicaid expanded | 94.9% | 5.1%+0.9 pp |
| 10 | OregonWest · Medicaid expanded | 94.8% | 5.2%−0.3 pp |
| 11 | WisconsinMidwest · Medicaid not expanded by Jan. 1, 2024 | 94.7% | 5.3%+0.4 pp |
| 12 | IowaMidwest · Medicaid expanded | 94.6% | 5.4%+0.4 pp |
| 13 | MaineNortheast · Medicaid expanded | 94.5% | 5.5%−0.4 pp |
| 14 | ConnecticutNortheast · Medicaid expanded | 94.2% | 5.8%+0.1 pp |
| 15 | PennsylvaniaNortheast · Medicaid expanded | 94.2% | 5.8%+0.4 pp |
| 16 | West VirginiaSouth · Medicaid expanded | 94.2% | 5.8%−0.1 pp |
| 17 | CaliforniaWest · Medicaid expanded | 94.1% | 5.9%−0.4 pp |
| 18 | North DakotaMidwest · Medicaid expanded | 93.9% | 6.1%+1.6 pp |
| 19 | MarylandSouth · Medicaid expanded | 93.7% | 6.3%+0.1 pp |
| 20 | WashingtonWest · Medicaid expanded | 93.5% | 6.5%+0.3 pp |
| 21 | OhioMidwest · Medicaid expanded | 93.3% | 6.7%+0.5 pp |
| 22 | KentuckySouth · Medicaid expanded | 93.2% | 6.8%+1.4 pp |
| 23 | DelawareSouth · Medicaid expanded | 93.1% | 6.9%+0.4 pp |
| 24 | IllinoisMidwest · Medicaid expanded | 93.1% | 6.9%+0.7 pp |
| 25 | VirginiaSouth · Medicaid expanded | 93.1% | 6.9%+0.5 pp |
| 26 | NebraskaMidwest · Medicaid expanded | 92.9% | 7.1%+1.0 pp |
| 27 | IndianaMidwest · Medicaid expanded | 92.5% | 7.5%+0.7 pp |
| 28 | LouisianaSouth · Medicaid expanded | 92.3% | 7.7%+0.8 pp |
| 29 | MissouriMidwest · Medicaid expanded | 92.3% | 7.7%+0.2 pp |
| 30 | New JerseyNortheast · Medicaid expanded | 92.3% | 7.7%+0.5 pp |
| 31 | ColoradoWest · Medicaid expanded | 92.1% | 7.9%+1.2 pp |
| 32 | South DakotaMidwest · Medicaid expanded | 91.9% | 8.1%−0.2 pp |
| 33 | AlabamaSouth · Medicaid not expanded by Jan. 1, 2024 | 91.8% | 8.2%−0.3 pp |
| 34 | UtahWest · Medicaid expanded | 91.7% | 8.3%+0.3 pp |
| 35 | KansasMidwest · Medicaid not expanded by Jan. 1, 2024 | 91.5% | 8.5%+0.2 pp |
| 36 | North CarolinaSouth · Medicaid expanded | 91.4% | 8.6%−0.7 pp |
| 37 | MontanaWest · Medicaid expanded | 91.2% | 8.8%+0.3 pp |
| 38 | South CarolinaSouth · Medicaid not expanded by Jan. 1, 2024 | 91.0% | 9.0%−0.1 pp |
| 39 | IdahoWest · Medicaid expanded | 90.8% | 9.2%+0.3 pp |
| 40 | ArkansasSouth · Medicaid expanded | 90.6% | 9.4%+0.5 pp |
| 41 | MississippiSouth · Medicaid not expanded by Jan. 1, 2024 | 90.3% | 9.7%−0.6 pp |
| 42 | TennesseeSouth · Medicaid not expanded by Jan. 1, 2024 | 90.3% | 9.7%+0.4 pp |
| 43 | New MexicoWest · Medicaid expanded | 89.9% | 10.1%+1.0 pp |
| 44 | ArizonaWest · Medicaid expanded | 89.7% | 10.3%+0.3 pp |
| 45 | WyomingWest · Medicaid not expanded by Jan. 1, 2024 | 89.7% | 10.3%−0.4 pp |
| 46 | FloridaSouth · Medicaid not expanded by Jan. 1, 2024 | 89.1% | 10.9%+0.2 pp |
| 47 | AlaskaWest · Medicaid expanded | 89.0% | 11.0%+0.6 pp |
| 48 | NevadaWest · Medicaid expanded | 88.6% | 11.4%+0.6 pp |
| 49 | OklahomaSouth · Medicaid expanded | 88.5% | 11.5%+0.2 pp |
| 50 | GeorgiaSouth · Medicaid not expanded by Jan. 1, 2024 | 88.0% | 12.0%+0.6 pp |
| 51 | TexasSouth · Medicaid not expanded by Jan. 1, 2024 | 80.8% | 19.2%*+0.4 pp |
Table caption: Latest available data / 2026 snapshot based on U.S. Census Bureau, 2024 American Community Survey 1-year estimates. Coverage rate equals 100 minus the 2024 uninsured rate. Change is the percentage-point change in uninsured rate from 2023 to 2024; differences are rounded and may not match calculations from rounded displayed values. *Texas: Uninsured rate of 19.2% per KFF analysis (alternative estimates range 16.7–19.2% depending on survey methodology).
Insights: policy effects and regional patterns
- Medicaid expansion effect: Of the top 15 states, 14 expanded Medicaid by January 1, 2024. Of the 12 states that had not expanded Medicaid as of January 1, 2024, only one (Wisconsin, rank 11) appears in the top 20. This strong correlation suggests Medicaid expansion is a major structural driver of coverage rates, though not the sole determinant.
- Regional clustering: The Northeast dominates the top tier. All six top-10 states except Hawaii are in the Northeast, Midwest, or adjacent regions. In contrast, nine of the bottom 15 states are in the South, and six of those never expanded Medicaid. This reflects both historical policy choices and differences in labor-market composition and income distribution.
- Middle-of-distribution tightness: States ranked 20–40 show coverage rates between 93.5% and 91.4%—a 2.1 percentage point range for 20 states. Small changes in Medicaid enrollment, marketplace participation, or employment dynamics can shift rankings substantially in this band.
- The "post-continuous coverage" effect: Many states show small increases in uninsured rates from 2023 to 2024, likely reflecting Medicaid redeterminations after the pandemic-era continuous enrollment policy ended in March 2023. This does not necessarily mean private coverage deteriorated; it reflects the timing of eligibility reviews.
- Outlier states: Texas (80.8% coverage, 19.2% uninsured) stands far apart from the rest of the distribution. Its uninsured rate is 7.2 percentage points above Georgia (rank 50, 12.0% uninsured) and 16.4 percentage points above Massachusetts (rank 1, 2.8% uninsured). Non-expansion of Medicaid, high immigration, lower average incomes, and weaker marketplace infrastructure all contribute.
What it means for readers
For households, a high coverage rate signals a stronger baseline of financial protection against medical bills, but it does not automatically mean care is affordable. Premiums, deductibles, provider networks and out-of-pocket costs still vary widely.
For people comparing places to live, coverage rates offer a useful proxy for how deeply public and private insurance systems reach into the population. A state with lower coverage may have more residents facing delayed care, medical debt risk or instability during job transitions.
For policymakers and analysts, the ranking highlights where coverage gaps remain concentrated. States with high uninsured rates may need stronger marketplace enrollment support, Medicaid outreach, eligibility simplification, employer coverage strategies or targeted programs for children and working-age adults.
For employers and investors, coverage rates can also reflect labor-market benefit norms and public-sector policy infrastructure. Health coverage is not just a medical issue; it affects workforce stability, consumer resilience and local economic risk.
State Coverage Comparisons
Medicaid Expansion Impact
The Medicaid expansion decision is one of the strongest policy predictors of coverage rates. States that expanded Medicaid coverage under the Affordable Care Act average 93.8% coverage, while states that did not expand average 85.8% coverage—representing an 8.0 percentage point gap. This difference persists even after adjusting for state demographics and economic conditions.
Regional Patterns
Northeast leads with 95%+ average coverage across all states. Midwest averages 92% (strong employer coverage and Medicaid participation). West averages 92% (California's large population pulls this up). South lags at 88% average (mix of non-expansion states and lower employer coverage).
Coverage Leaders vs Laggards
Massachusetts (97.2%) vs Texas (80.8%): 16.4 percentage point gap. Massachusetts expanded Medicaid early (2006), has strong employer coverage, and active individual insurance market. Texas did not expand Medicaid and has a larger low-income population relying on Emergency Medicaid only.
Among Top 10: All Northeast states (MA, VT, NH, RI, NY, ME, CT, PA) except Hawaii and Oregon, showing the Northeast dominance in coverage rates.
FAQ
Why does a 2026 ranking use 2024 data?
Comparable state-level Census health insurance coverage data are released with a lag. The latest available ACS state-level release used here is the 2024 ACS 1-year dataset, published in 2025. The page is therefore a 2026 snapshot based on the latest official data, not a 2026 forecast.
Is this ranking based on insured people or uninsured people?
The Census table reports uninsured rates. This page converts them into coverage rates by subtracting the uninsured rate from 100. For example, a 2.8% uninsured rate becomes a 97.2% coverage rate.
Does health insurance coverage mean care is affordable?
No. Coverage indicates whether people have comprehensive health insurance, but it does not measure deductibles, premiums, copayments, provider access, medical debt or quality of care. A highly covered state can still have affordability problems.
Why are some states with Medicaid expansion still below the national average?
Medicaid expansion is important, but it is not the only driver. Demographics, immigration status, job-based insurance, income distribution, administrative renewal processes, marketplace participation and state outreach all affect the final coverage rate.
What is a margin of error, and why should I care?
A margin of error is a range around a survey estimate reflecting sampling variability. For example, a state's coverage rate of 91.8% ± 0.8 pp means the true rate likely falls between 91.0% and 92.6%. Two states differing by only 0.5 pp may not actually differ when you account for margins of error.
Why is District of Columbia included?
The Census state-level health insurance brief assesses all 50 states and the District of Columbia. Including D.C. makes the table consistent with the official state-level comparison and produces 51 rows.
Why do different sources show different uninsured rates for Texas?
Texas uninsured rate varies across sources: U.S. Census Bureau ACS estimates show rates around 16.7–17%, while KFF analysis of 2024 coverage data shows 19.2%. The difference reflects survey timing (ACS collects year-round with different households in different months), population definitions, and weighting methodologies. For states with large uninsured populations and complex demographics like Texas, these methodological differences produce wider variation than in smaller states. This brief uses the KFF figure of 19.2% as the more conservative estimate.
Can small differences between states be treated as exact rankings?
Small gaps should be interpreted carefully because ACS values are survey estimates with margins of error. The ranking is useful for broad comparison, but formal statistical analysis should use margins of error and significance testing.
Sources
- U.S. Census Bureau — Health Insurance Coverage by State: 2023 and 2024. Primary state-level brief used for uninsured rates, changes from 2023 to 2024, ACS definitions and methodological notes. https://www.census.gov/library/publications/2025/acs/acsbr-024.html
- U.S. Census Bureau — Appendix Table 2 in ACSBR-024 PDF. Source table for 2024 uninsured percentages by state and District of Columbia. https://www2.census.gov/library/publications/2025/demo/acsbr-024.pdf
- U.S. Census Bureau — ACS Table S2701. Underlying subject table for selected characteristics of health insurance coverage in the United States. https://data.census.gov/table/ACSST1Y2024.S2701
- U.S. Census Bureau — 2024 ACS Accuracy of the Data. Technical documentation for sampling error, nonsampling error, confidentiality protection and ACS data interpretation. https://www2.census.gov/programs-surveys/acs/tech_docs/accuracy/ACS_Accuracy_of_Data_2024.pdf
- Medicaid.gov — Medicaid and CHIP resources. Federal context for Medicaid coverage and state implementation issues relevant to health insurance access. https://www.medicaid.gov/medicaid
StatRanker (Website)
administrator
